T H E J O U R N A L O F H U M A N R E S O U R C E S • 45 • 1
Labor Market Entry in Japan and
the United States
Yuji Genda
Ayako Kondo
Souichi Ohta
A B S T R A C T
We examine effects of entering the labor market during a recession on subsequent employment and earnings for Japanese and American men, us-ing comparable household labor force surveys. We find persistent negative effects of the unemployment rate at graduation for less-educated Japanese men, in contrast to temporary effects for less-educated American men. The school-based hiring system and the dismissal regulation prolong the initial loss of employment opportunities for less-educated Japanese men. The effect on earnings for more-educated groups is also stronger in Japan, although the difference between the two countries is smaller than for less-educated groups.
I. Introduction
There is increasing evidence that labor market conditions at labor market entry affect subsequent wages and employment prospects (Ohtake and Inoki
Yuji Genda is a professor of economics at the Institute of Social Science of the University of Tokyo. Ayako Kondo is a lecturer in economics at the Institute of Social and Economic Research of Osaka University. Souich Ohta is a professor of economics at Keio University. The empirical analysis using the Japanese Labor Force Survey was conducted as a part of the project at the Statistical Research and Training Institute. The authors gratefully acknowledge staffs of the Institute and the Statistics Bureau of Japan, including Fumihiko Nishi, Kazuro Nemoto, Mari Suga, Katsuya Akasaka, and Tetsuaki Sato. They also thank two anonymous reviewers, Janet Currie, Till von Wachter, Bentley MacLeod, David S. Lee, Joshua Goodman, and seminar participants at Columbia University, Hitotsubashi University, the University of Tokyo, and KISER for helpful suggestions. A part of the data used in this article are taken from the Japanese Labor Force Survey and housed at the Statistical Research and Training Institute, Tokyo, Japan. Information on access can be obtained by contacting Yuji Genda, Institute of Social Sci-ence, the University of Tokyo, 7-3-1 Hongo, Bunkyo-ku, Tokyo, 113-0033, Japan. E-mail: genda@iss.u-tokyo.ac.jp. The rest of the data and all codes to replicate the tables in this article can be obtained beginning August 2010 through July 2013 from Ayako Kondo, Institute of Social and Economic Research, Osaka University, 6-1 Mihogaoka, Ibaraki, Osaka, 567-0047, Japan. Email: akondo@iser.osaka-u.ac.jp. [Submitted September 2007; accepted October 2008]
158 The Journal of Human Resources
1997 for Japan; Oreopoulos, von Wachter, and Heisz 2006 for Canada; Kahn 2006 for the United States).1 However, these studies typically focus on employees in
relatively large establishments or male college graduates, and tend to ignore less skilled workers in less stable employment. Yet, persistent negative effects of gradu-ating during a recession for less skilled workers or those in unstable employment would have quite different implications for income mobility and inequality than that for more skilled workers. This paper sheds light on the effect of graduating during a recession for less-educated men and its relation to labor market institutions, by comparing more- and less-educated groups in Japan and the United States.
Specifically, we estimate the continuous influence of the unemployment rate at entry on subsequent employment status and real annual earnings, using two com-parable cross-sectional household surveys from 1986 to 2005: the Labor Force Sur-vey in Japan and the Current Population SurSur-vey in the United States. With controls for year- and region- fixed effects and region specific linear trends, we find that a recession at entry has a persistent negative effect for less-educated Japanese men: a one percentage point rise in the unemployment rate at entry reduces the likelihood of being employed by 3–4 percentage points over 12 years and, though standard errors are huge, leads to earning losses by 5–7 percent for the group without a college education. Sample decomposition by employment status suggests that the negative impact on earnings is due to a continuous decline in the probability of fulltime, regular employment. Although we also find a persistent, significantly neg-ative effect on earnings for educated Japanese men, this effect for the more-educated group is not attributable to a decline in regular employment. Only tem-porary effects are observed for less-educated American men, and the effect on earnings for more-educated American men is modest and gradually fading. The pattern of persistence across groups with different educational background exhibits a striking contrast between the two countries.
We explain the persistent effects for less-educated Japanese men by two institu-tional features of Japanese labor market. First, Japanese labor law requires high schools to play a key role in the matching process between graduating seniors and prospective employers. Second, once hired, the case law severely restricts dismissal of regular workers in Japan. This is quite in contrast to the United States where high schools do not intervene in the hiring market, and dismissals are generally not costly. The Japanese school-based hiring system is meant to foster smooth transition from school to work for relatively less skilled workers. Under the strict dismissal regu-lation, however, less skilled workers who fail to obtain a job initially may suffer persistent disadvantages as employers bypass them in favor of new graduates whose qualifications can be vouched for by their schools.
Existing studies that focus on college graduates such as Oreopoulos, von Wachter, and Heisz (2006) typically draw on a combination of search frictions, specific human capital, and contract models similar to Beaudry and DiNardo’s (1991) to interpret the persistent negative effect of graduating during a recession. These factors may
be more relevant to skilled workers with strong attachment to the labor force. Our finding of small penalties for graduating during a recession for less-educated Amer-ican men suggests that the job market for less skilled worker is closer to a spot market. It is consistent with the well-known results that employment and wages are more sensitive to contemporaneous labor market fluctuations for less-educated work-ers in the United States, especially in downturns (Cutler and Katz 1991; Hines, Hoynes, and Krueger 2001).
An additional motivation for looking at Japanese men is a growing social concern about the deteriorated employment situation of young Japanese who entered the labor market during the prolonged recession of the mid-1990s through the early 2000s. As highlighted by Genda (2001), the cost of this recession was born disproportion-ately by young people who were in the course of transition from school to fulltime work, since cutting new hiring was much easier than firing incumbent workers. The fraction of the young labor force not in regular fulltime employment has sharply increased since the 1990s. Repairing the employment prospects of these young peo-ple stranded out of the “regular” track has emerged as a pressing issue, with growing fears of a future expansion of poverty and an increasing burden of social security. Our findings of high persistence of employment instability in the Japanese labor market prove that spontaneous recovery is unlikely.
The rest of the paper is organized as follows. The next section provides the Japanese institutional background in detail. Section III reviews underlying mecha-nisms by a simple screening model. Section IV describes data and methodology and examines comparability of Japanese and American data. Empirical results are re-ported in Section V. Section VI concludes.
II. Institutional Background
Japan’s employment system is characterized by long-term employ-ment beginning right after the completion of education and lasting until mandatory retirement. An obvious consequence of this so-called “lifetime” employment system is long job tenure and high job-retention rates for prime-aged male workers.2Another
important consequence of the lifetime employment system is two-tier structure within an employer. To keep their regular employees during recessions, many Jap-anese firms also hire workers on fixed term contracts or parttime basis as a buffer. A “seishain,” or a regular employee, works full time and is on an employment contract that does not specify the date of termination of the contract, usually thought to be on the lifetime employment track.3 A nonregular worker is usually called
2. For instance, the average tenure of men at age 30–34 in 2000 is about 8.5 years in Japan, while it is about five years in the United States. Note that the difference in turnover rates between more and less-educated Japanese workers is similar to that of American workers: in both countries, the turnover rate of high school educated workers is higher than that of college educated workers.
160 The Journal of Human Resources
“arubaito,” a Japanese word meaning a side worker, or a “parttimer” regardless of how many hours she actually works.
Firing regular employees for economic reasons is almost prohibitive under the social norm against dismissal and the resulting case law in Japan. The prevalence of long-term employment had underdeveloped the job market for midcareer workers and created a perception that firms were responsible for their employees’ job security by the 1970s. Reflecting this social norm, the so-called just cause case law (kaikoken ranyou houri) was established in the mid-1970s.4This case law requires employers
to make every effort to avoid a dismissal of regular workers, including terminating temporary and parttime employment contracts and suspending new hiring. This re-quirement and the potential cost of litigation make a dismissal of regular workers prohibitive.5In contrast, termination of fixed term contracts is relatively easy, and
the case law itself regards nonregular workers as a buffer that protects employment of regular workers.6
In addition to the different degree of employment protection, the hiring market for the regular fulltime workers and that for the nonregular provisional workers work quite differently. In the market for regular jobs, schools play a crucial role; espe-cially, high schools have a legal obligation to share the responsibilities for recruit-ment of graduating seniors with assistance from the Public Employrecruit-ment Security Offices. Consequently, the hiring market for new graduates is isolated from the rest of the labor market. As pointed by Brinton and Kariya (1998), the institutional connection with school allows firms to reduce costs required for screening and find-ing suitable workers by relyfind-ing on school information instead.
According to the Employment Security Law written in 1947, when Japan was still in the postwar turmoil, the government regulates the recruitment process of gradu-ating seniors from junior high school in order to protect them from illegal and unethical employers. In the 1960s, its coverage expanded to graduating seniors from high school. The law forbids employers from making direct contact with seniors who hope to work or using private employment agencies for their recruiting. Instead, the Japanese law encourages schools and public employment offices to play crucial roles in youth employment decisions. Employers who attempt to hire new high school graduates are obliged to submit detailed job information such as job content and payment to the public employment offices. Then the offices evaluate whether the offered job contents and working conditions are appropriate, and after approving these conditions, they introduce the employers to job applicants through junior or senior high schools. Teachers, who can collect superior information about individual students’ characters and performance in school, match each student with a job that is judged to be the best matched to him or her. Because schools have made
long-4. This case law was first codified in the Labor Standards Law in January 2004 and then included in the Labour Contract Law implemented in March 2008.
5. See, for example, Section 5.2 of Passet (2003) for a more detailed description.
tem relationships with firms by providing students for many years, the accumulated information about each specific firm further improves matching between employers and employees.7
Unlike high schools, college students in Japan can make direct contacts with potential employers without mediation of college. A number of large private place-ment-service agencies provide job information for college graduates, instead of pub-lic employment offices. The hiring process is less legally regulated compared to the market for high school graduates. Nevertheless, the hiring market for new college graduates is also separated from the rest of the labor market to some extent, in the sense that many vacancies for regular fulltime jobs explicitly target senior students in college. The private placement-service agencies also distinguish new graduates from other job seekers, though not as strictly as the public employment offices do for high school graduates.
The likelihood that a new graduate obtains a fulltime regular job is procyclical and on a declining trend. Yet, the proportion of new graduates who immediately obtain a fulltime regular job was still as high as 79.8 percent for high school gradu-ates and 90.9 percent for four-year college gradugradu-ates in 1997, according to the Survey of Young Employees.8New graduates who failed to obtain a regular fulltime
job upon graduation often start working at nonregular, provisional jobs. The recruit-ment of nonregular workers mostly relies on advertiserecruit-ment on local newspapers and job magazines, internet, and word-of-mouth advertising. Because schools do not intervene, all young applicants are treated equally in the local spot market. This is quite in contrast to the heavily institutionalized market of regular jobs for senior students.
Overall, the Japanese school-based hiring system can be considered as a subsidy for hiring new graduates from high school as regular workers, in that it allows firms to find suitable workers by relying on school’s information. That is, Japanese firms can outsource the screening of new high school graduates to schools in collaboration with Public Employment Security Offices. Thus, even if expected productivity would be the same between newly graduating seniors and those who have already graduated in the past, firms would prefer to recruit from graduating seniors because risks of having an unqualified applicant is much lower. Therefore, Japanese youths who failed in transition from school face difficulty in searching appropriate jobs and revealing their potentiality without any assistance of schools after graduation.9
Unlike Japan, transition from education to stable employment in the United States is gradual and often takes several years. In particular, there is no formal assistance from high schools for graduating seniors. Instead, young workers try to find suitable
7. However, many troubles have arisen since the mid-1990s as both the demand for and the supply of high school graduates have declined. Ariga (2005) elaborates what went wrong in the 1990s.
8. Despite the decreasing number of new entrants to regular fulltime jobs, regular fulltime workers remain in long-term employment as before. The Survey of Young Employees shows that 68.1 percent of male regular employees at age 25–29 in 1997 had never changed their employer. Kato (2001) also shows that neither the job-retention rate nor the average tenure of regular employees, with controls for the age com-position, has declined since the 1980s.
162 The Journal of Human Resources
jobs by frequent job changes. Topel and Ward (1992) report that two-thirds of all new jobs among young workers end in the first year. Neal (1999) shows that many job changes among young workers involve changes in industry and occupations, emphasizing the importance of searching for well-matched career. He also shows that less-educated workers tend to change industry and occupation more frequently. Another important difference is the substantial rate of layoffs in the United States. According to Farber (1998), the three-year job loss rate of 20–24-year-old workers is about 15 percent and the highest among the five age categories. Probably due to this weak restrictions on dismissals in general, the distinction between fixed-term and indefinite employment contracts is relatively subtle in the United States com-pared to the dichotomous classification of regular and nonregular jobs in Japan.
III. Underlying Mechanisms
Several theories explain how the advantage of obtaining a better job at entry lasts for several years, including time-intensive search models and a partic-ular type of implicit long-term contracts with one-sided commitment by employers. These factors are common in Japan and the United States and expected to affect more-educated workers. On the other hand, the Japanese school-based hiring system is considered as a subsidy for hiring new graduates as regular workers, and it is relevant only for Japanese high school graduates. In this section, we first review mechanisms that are common to Japan and the United States, and then show that subsidized screening of newly graduating high school seniors can produce an ad-ditional permanent effect of graduating during a recession for less-educated Japanese men.
In the United States, Beaudry and DiNardo (1991) find that incumbent workers’ wages rise during booms but do not fall during recessions as long as the workers remain employed, and they explain this by implicit long-term wage contracts with mobile workers. That is, firms cannot dismiss workers or cut their wages during a recession while they have to raise wages to keep workers from the better outside options. Then, it is natural to think that the benefit from obtaining a high-paying job upon graduation due to the tight labor market can last for years. Also, at least for large firms, there is evidence that external labor market conditions at entry to the firm affect long-term wage setting within the firm (Baker, Gibbs, and Holms-trom1994 for the United States; Ariga, Brunello, and Ohkusa 2000 for Japan).
Because it takes time to dissolve initial matches, we anticipate that turnover rates among those who enter the labor market during a recession stay high for several years after entry. In fact, Bowlus (1995) shows that a job that started during a recession tends to end sooner in the United States, implying deteriorated matching quality. Although the turnover rate itself is much lower in Japan, Ohta (1998) and Genda and Kurosawa (2001) find similar evidence that graduating during a recession raises the subsequent quitting rate of the cohort.
and bear risks that the applicant turns out to be unqualified. Hiring an unqualified applicant is especially costly in Japan, where the dismissals are very costly. Since Japanese high schools have much better information on their students than the pro-spective employers do, they can screen the job applicants beforehand to reduce risks borne by the employers. Therefore, firms prefer to rely on the school-based hiring than open the door to nonregular workers and unemployed. Thus, even though the average nonregular worker in a cohort that entered the labor market during a reces-sion is likely to be of higher quality than those in a cohort that entered the labor market during a boom, it may be almost equally difficult for them to get back to the market of regular jobs.
To see this point, suppose that each person stays in the labor force for two periods and there are two states: good (G) or bad (B). Each cohort consists of workers heterogeneous in productivity. The cohort size is fixed toN,and the distribution of productivity is uniform between 0 and N: U
[
0,N]
. The number of vacancies for regular jobs isEBin a bad year andEGin a good year, whereEB⬍EGⱕN. Students who cannot find any jobs become unemployed, and apply for regular jobs in the next period if any jobs are open to them. Each firm knows the distribution of pro-ductivity and can distinguish graduating seniors from unemployed people who have already left schools. However, the firm cannot observe each worker’s productivity until it hires him. On the other hand, when school intervenes, the school can observe each student’s productivity.10To keep the discussion as simple as possible, hereafterwe describe the process as if there were only one firm offering a fixed wage to everyone.11
The job markets under different institutional settings work as follows. Without school’s mediation, the employer randomly picks an applicant from the pool of graduating seniors or the pool of unemployed from the previous cohort. Then, it hires the applicant and learns his productivity. If dismissals are not too costly, a worker whose productivity turned out to be below a certain threshold is fired and goes back to the pool of job seekers. The firm no longer remembers workers whom it fired12and picks another applicant and repeats the same process until all vacancies
are filled with workers above the threshold. Hence, at the end, the worst jobseekers are left unemployed. We call this “the U.S.-type market” hereafter. If dismissals are too costly, firms have to be stuck with the randomly picked workers. Lastly, under the school-based hiring system, the school simply assigns regular jobs to students in order of their productivity, and the least productive ones are left unemployed.
10. This is an extreme assumption just for simplicity. In reality, firms can screen job applicants by inter-views to some extent, and school’s information is not perfect. The point is that schools have better infor-mation than firms.
11. We are assuming that wages do not adjust and the number of vacancies is rationed. Although exploring why wages do not adjust is beyond the scope of this paper, the Wage Census shows that the starting salaries for Japanese new graduates (conditional on educational background) have been downwardly rigid in Japan since the 1980s. Having multiple firms does not change the results qualitatively but complicates the case without school’s mediation. For the case of the school-based hiring system, introducing hetero-geneous employers shows that, even if some firms start hiring from the pool of unemployed, the jobs available to unemployed workers are far worse than the job that the most productive unemployed worker could have obtained if he had graduated in a good year.
164 The Journal of Human Resources
Because we are interested in job reallocation during upturns, consider the case where a good year comes after a bad year. The most productive EBstudents who graduated in year t-1 have settled in regular jobs, and the remainingNⳮE
Bstudents have become unemployed. In year t, the total number of job openings increases to
EG. Since the bestEBstudents graduating in this year are more productive than any unemployed people from the previous cohort, they must settle in regular jobs in both the U.S.-type market and the school-based hiring system. The distribution of productivity among the rest of the students is the same as the distribution among the unemployed people who graduated in the previous year:U
[
0,NⳮEB]
.If the firm continued to hire from the pool of graduating seniors, the average productivity among the students who are still seeking for a job would fall below the average productivity among unemployed people from the previous cohort. Thus, in the U.S.-type market, the firm should start hiring from the pool of unemployed people when the best EB students have been already hired. In contrast, the school-based hiring system ensures that students who are assigned to regular jobs are at least as productive asNⳮEG. Recall that the average productivity of the unemployed from the previous cohort isNⳮEB. Then, the firm is unwilling to hire from the pool
2
of unemployed people from the previous cohort if
NⳮE
B
NⳮE ⱖ
(1) G
2
Inequality Equation 1 can be rewritten as follows:
E ⳮE ⱕ1/2
[
NⳮE]
(2) G B B
This simple model therefore implies that the firm does not hire from the pool of unemployed during an upturn unless the boost in labor demand exceeds half of the level of unemployment during the preceding recession. Although the model is overly simplified and exaggerates the difference in information on workers’ productivity between the school and the firm, it illustrates how the subsidized screening of new graduates and strict employment protection could deprive young Japanese who dropped out from the system of opportunities to recover the initial loss.
In reality, many high school graduates in Japan who failed to obtain a regular job upon graduation find a nonregular job, thus “unemployed” in the above model in-cludes nonregular workers. This is roughly 15–30 percent of high school graduates who do not proceed to college, and the ratio is countercyclical. If they are trapped in nonregular job and unemployment regardless of labor market conditions in the year they graduated, a recession at graduation has a persistent negative effect at the cohort level by reducing the number of regular jobs available to the cohort.
human capital also will lower the average productivity of the cohort in the long run. Provided that provisional workers have much fewer opportunities of training, the loss of work experience on the regular employment track is likely to lower the average productivity of the cohort in the long run and aggravate the loss of earnings for less-educated Japanese men.
Given the lower turnover rate in Japan, the process of dissolving initial bad matches is expected to take a longer time in Japan. Nevertheless, the turnover rate is lower and returns to experience/tenure are greater for the more-educated group in both countries. Thus, without additional mechanisms that affect less-educated Jap-anese, the resulting penalties for graduating during a recession would be stronger for the more-educated group in both Japan and the United States. Hence, if the negative effect of graduating during a recession is particularly strong for less-edu-cated Japanese men, it is likely to be attributable to the lack of opportunity to rejoin in the regular job market after graduating without a job.
IV. Data and Methodology
Our sample consists of Japanese men and American white men who completed their education in 1983 or later and have potential experience in the range of one to 12 years. We restrict our sample to men in order to avoid additional complications from the labor supply behavior of married women, which is quite different in the United States and Japan. We also drop nonwhites from the sample of American men to keep away from issues related to racial disparities.
Our primary sources of data for Japanese men are the Special Survey of the Labour Force Survey (Roudouryoku Chousa Tokubetsu Chousa1986–2001) and the Detailed Supplement to the Labour Force Survey (Roudouryoku Chousa Tokutei Chosahyo2002–2005), both conducted by the Statistics Bureau. The Special Survey was conducted annually in February until 2001, and each year’s sample consists of about 90,000 individuals older than 15 in about 40,000 randomly drawn households. In 2002, the annual Special Survey was replaced with the monthly detailed supple-ment with a sample size of 23,000 individuals; to avoid seasonality bias, we use February samples only. Both surveys are cross-sectional and include the same ques-tions on annual earnings, detailed employment status and employer characteristics, and basic demographic characteristics.
We use the March Supplement to the Current Population Survey, conducted by the Census Bureau and the Bureau of Labor Statistics, to do the same exercise for American men. The March supplement to the Current Population Survey is also cross-sectional, consists of a random sample of households and contains most of the key variables in a comparable form. The sample size varies from about 100,000 in the 1980s to 200,000 individuals in the 2000s.
One of the primary dependent variables is log real annual earnings.13This is the
total income from salary and wages (excluding self-employed persons in
166 The Journal of Human Resources
rated business) of the person in the past year, deflated by the consumer price index. Note that income from other sources is not included. Also, even if the respondent is not employed in the reference week, he is supposed to report positive earnings as long as he has worked at some point in the previous year. Thus, only people who report zero income for the whole year are dropped from the regression. The appen-dixes describe construction of the variable and detail of those missing observations. The other dependent variables including employment status and weekly hours worked are directly taken from the survey questionnaires and measured in the ref-erence week of each survey. The measure of regional labor market conditions for Japan is the unemployment rates for ten regions based on the monthly Labour Force Survey, which are available since 1983. For the United States, we use the state unemployment rates issued by the Bureau of Labor Statistics as the Local Area Unemployment Statistics. The Japanese regions are on average one-fifth the size of the average American state, while having twice the average population.
We define a cohort as a group of people who entered the labor market in the same year and region or state, and then assign each person a vector of past and current regional unemployment rates based on his cohort. Since both the Labour Force Survey and the Current Population Survey are cross-sectional data sets lacking de-tailed employment history, we have to compute the year of graduation from the year of birth and educational background. Students in Japan typically receive job offers by the autumn of their last year of enrollment, while they graduate in March of the following year. Thus, we define entry-year y for the Japanese sample as follows:
year of birthⳭ6Ⳮschoolingfor those born in April-December, andyear of birth
Ⳮ 5 Ⳮ schooling for those born in January-March.14 For the U.S. sample, we
compute year of graduationy as year of surveyⳮageⳭ 6 Ⳮ the highest grade attended. This corresponds to the year of graduation for a person who entered ele-mentary school at age 6 and went straight to the highest grade. Also, we have to use the region/state of current residence as the best available proxy for the region/ state of residence at entry. The appendixes provide a lengthy discussion about the adequacy of our definition of cohorts and reservations that come from measurement errors.
We estimate the effects of the unemployment rate at entry to the labor market on current employment status and earnings net of region-fixed components and year-fixed components.15 It is also necessary to control for temporary macro shocks at
the time of the survey because unemployment rates may be autocorrelated, and the effect of the contemporaneous unemployment rate is itself worth estimating. To take into account these issues, we estimate the following probit model:
* ⬘
Y ⳱1 if Y ⳱ u Ⳮ␥ u Ⳮ␦X ⳭⳭⳭtⳭm Ⳮε ⬎0
(3) ityr ityr (tⳮy) yr (tⳮy) tr it t r r y ityr
⳱0 otherwise
whereYityris an indicator variable that takes one if employed, for personiwho left school in yearyand in regionrobserved in yeart, uyrandutrare the unemployment rates at entry and at present, andXit is other control variables including educational background and potential experience in yeart.tis a survey-year fixed effect,ris a region fixed effect,ris the coefficient of linear trend, which varies with region, and my is an entry-year fixed effect. The remaining errors,ε
ityr, include a random cohort-region effect and a random region-calendar year effect, which are likely to be autocorrelated. To account these aggregate random shocks, standard errors of coefficients are estimated by block bootstrap with clusters by region/state.16
Like-wise, the basic form of the earnings equation to be estimated is written as follows:
⬘
logI ⳱ u Ⳮ␥ u Ⳮ␦X ⳭⳭⳭtⳭm Ⳮε
(4) ityr (tⳮy) yr (tⳮy) tr it t r r y iyr
whereIityris annual earnings.
We allow the coefficients of the unemployment rates,and␥, to vary with the years since entry to see the persistence of the effect. Ideally, we would like to estimate separateand␥by every single year of potential experience. However, in consideration of the sample size of each cohort, we choose a more parsimonious specification with separate s and ␥s for four ranges of potential experience (1–3, 4–6, 7–9, and 10–12 years).
Before going into the main analyses, let us check the comparability of Japanese and American data. The summary statistics of the micro data sets are shown in Table 1. American men are on average more-educated, and the earnings gap between the more-educated group and the less-educated group is larger for American men. Nev-ertheless, within each group by educational background, the two data sets look fairly similar except that the employment rate is slightly higher for Japanese men. The average sample size per cohort (defined by region/state and year of graduation) is 222 for Japanese men and 135 for American men.
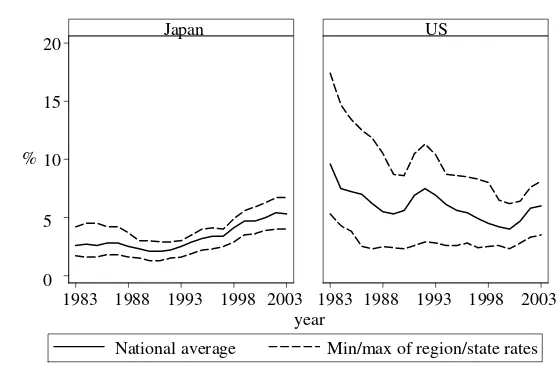
On the other hand, the unemployment rates in Japan and the United States have moved quite differently. Figure 1 plots the national average unemployment rates and the minimum and the maximum of region/state unemployment rates over time for Japan and the United States in 1983–2003. Obviously, both the level of the average unemployment rate and the variation across states are much greater for the United States than Japan. Therefore, a one percentage point rise in the unemployment rate could have a greater impact in Japan than in the United States, just because of the differences in the average level.
Further, Table 2 shows summary statistics of the regional unemployment rates, both raw levels and net of the year- and the region/state- fixed effects and the region/ state specific linear trend. Variation net of these fixed effects and trend terms is essential for identification. Admittedly, a large part of the variation in the raw rates is absorbed by the fixed effects; especially, R-squared for the Japanese regional rates is as high as 0.96, while that for the American state rates is 0.84. This could be partly because the Japanese data have fewer data points and the fixed effects are
168
The
Journal
of
Human
Resources
Table 1
Summary Statistics
Japan, High School or Less
Japan, Junior College or more
United States, schooling ⱕ12
United States, schooling ⬎ 12
Observations 53,557 39,592 63,611 76,699 Experience⳱1–3 17,833 11,417 19,849 17,643 Experience⳱4–6 14,759 12,229 17,297 21,982
Experience⳱7–9 12,083 9,399 14,753 19,994
Experience⳱10–12 8,882 6,547 11,712 17,080
Educational background
Without high school diploma: 6,745, high school diploma: 46,812
Junior/tech college (two-year): 11,383, four-year college or more: 28,209
Average years of schooling: 11.6; S⳱12: 49,798
Average years of schooling: 15.4; S ⬍ 16: 35,216
Log real earnings (10,000 yen in 2000) (100 dollars in 2000)
Experience⳱1–3 5.10 5.50 4.44 5.12
Experience⳱4–6 5.41 5.79 4.88 5.48
Experience⳱7–9 5.60 5.99 5.16 5.70
Experience⳱10–12 5.73 6.15 5.31 5.86
Employed
Experience⳱1–3 76.5% 92.2% 73.9% 88.8%
Experience⳱4–6 88.5% 94.7% 81.6% 90.6%
Experience⳱7–9 90.5% 95.5% 84.8% 92.4%
0 5 10 15 20
1983 1988 1993 1998 2003 1983 1988 1993 1998 2003
Japan US
National average %
year
Min/max of region/state rates
Figure 1
Unemployment rate in Japan and the United States: 1983–2003
Table 2
Summary Statistics of Region/State Unemployment Rates 1983–2003
Observations Mean
Standard
Deviation Minimum Maximum
Regions in Japan 210 3.21 1.23 1.3 6.7
Net of region fixed effects, year fixed effects and region specific linear trenda
(0.00) (0.22) (ⳮ0.60) (0.89)
States in the United States 1,071 5.74 1.95 2.3 17.4 Net of state fixed
effects, year fixed effects and state-specific linear trenda
(0.00) (0.75) (ⳮ2.07) (3.27)
a. Residuals from a regression of raw rates on year dummies and region/state dummies.
170 The Journal of Human Resources
Thus, we believe that we can identify the effect of the unemployment rate at entry net of region and year dummies as well.
Note that entry to the labor market is, by definition, observed only once for each person. Therefore, even if we had a panel data set, we could not control for indi-vidual fixed effects. Also, as shown in Appendix, the effect of contemporaneous unemployment rate on the enrollment rate is weak, suggesting that endogeneity of entry is quantitatively negligible.17A recession at graduation from high school does
not significantly affect the selection of those who proceeds to college, either. Thus, the major limitation of cross-section data is that the year and place of graduation are measured less precisely than panel data. Given that the measurement errors in the year and region of graduation are larger for American men (see Appendix), both the attenuation bias and the size of average unemployment rate will make the esti-mates for American men smaller than those for Japanese men. However, the differ-ence between more and educated Japanese men and that between more and less-educated American men will be comparable because more-less-educated men are more mobile in both countries.
V. Estimated Effects of a Recession at Entry
A. Effects on Employment Status
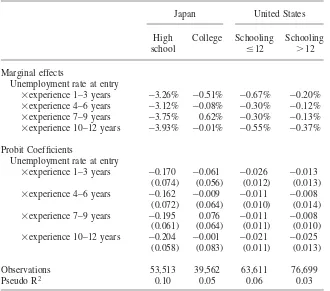
Table 3 shows the effect of a one percentage point rise in the unemployment rate at entry on the likelihood of being employed in the reference week of the survey. The estimated equations are exactly the same as Equation 3. The unemployment rate at entry has a persistent negative effect for less-educated Japanese men: A one percentage point rise in the unemployment rate at entry reduces the likelihood of employment by 3–4 percentage points for over twelve years. The effect for less-educated American men is also negative and marginally significant, but the size of the effect is small. The effect is almost zero and statistically insignificant for more-educated groups both in Japan and in the United States, consistent with the existence evidence for a negligible effect on employment for college graduates by Oreopoulos, von Wachter, and Heisz (2006).
The negative effect of a one percentage point rise in the unemployment rate is not necessarily the same magnitude as the positive effect of a one percentage point fall in the unemployment rate. To see if there is any asymmetry in the response to the unemployment rate between upturns and downturns, we take interactions of the unemployment rate at entry and an indicator variable for a declining unemployment rate (upturns).18As shown in Table 4, the negative effect for Japanese less-educated
17. This is an important difference from the study of the effect of labor market condition at the beginning of job. On the one hand, each person can have multiple jobs over time. On the other hand, each worker is likely to have much more choice in the timing of starting a job than the timing of completing education. Thus, it is not surprising that Beaudry and DiNardo (1991) find different results from pooled regressions and fixed effect regressions exploiting multiple spells per worker.
Table 3
The Effect of the Unemployment Rate at Entry on Employment
Japan United States
High school
College Schooling ⱕ12
Schooling
⬎12
Marginal effects
Unemployment rate at entry
⳯experience 1–3 years ⳮ3.26% ⳮ0.51% ⳮ0.67% ⳮ0.20%
⳯experience 4–6 years ⳮ3.12% ⳮ0.08% ⳮ0.30% ⳮ0.12%
⳯experience 7–9 years ⳮ3.75% 0.62% ⳮ0.30% ⳮ0.13%
⳯experience 10–12 years ⳮ3.93% ⳮ0.01% ⳮ0.55% ⳮ0.37%
Probit Coefficients
Unemployment rate at entry
⳯experience 1–3 years ⳮ0.170 ⳮ0.061 ⳮ0.026 ⳮ0.013
(0.074) (0.056) (0.012) (0.013)
⳯experience 4–6 years ⳮ0.162 ⳮ0.009 ⳮ0.011 ⳮ0.008
(0.072) (0.064) (0.010) (0.014)
⳯experience 7–9 years ⳮ0.195 0.076 ⳮ0.011 ⳮ0.008
(0.061) (0.064) (0.011) (0.010)
⳯experience 10–12 years ⳮ0.204 ⳮ0.001 ⳮ0.021 ⳮ0.025
(0.058) (0.083) (0.011) (0.013)
Observations 53,513 39,562 63,611 76,699
Pseudo R2 0.10 0.05 0.06 0.03
Note: Standard errors in parenthesis are calculated by bootstrapping (reps⳱200) with clustering by state/ region. Other controls included are potential experience, education (dummies for the Japanese sample, years of schooling for the American sample), graduation year dummies, region dummies, survey-year dummies, and region-specific linear trends.
men remains substantial and statistically significant while the difference in the es-timated effect is small and statistically insignificant for all the other groups.
172 The Journal of Human Resources
Table 4
The Effect of the Unemployment Rate at Entry on Employment, Allowing Different Effect between Upturns and Downturns
Japan United States
High school
College Schooling ⱕ12
Schooling
⬎12
Marginal effects
Unemployment rate at entry during downturn
⳯experience 1–3 years ⳮ3.5% ⳮ0.7% ⳮ0.79% ⳮ0.20%
⳯experience 4–6 years ⳮ3.1% ⳮ0.3% ⳮ0.39% ⳮ0.10%
⳯experience 7–9 years ⳮ3.6% 0.5% ⳮ0.45% ⳮ0.15%
⳯experience 10–12 years ⳮ4.3% 0.0% ⳮ0.70% ⳮ0.31%
Unemployment rate at entry during upturn
⳯experience 1–3 years ⳮ3.9% ⳮ0.5% ⳮ0.64% ⳮ0.17%
⳯experience 4–6 years ⳮ4.2% ⳮ0.3% ⳮ0.35% ⳮ0.14%
⳯experience 7–9 years ⳮ4.3% 0.7% ⳮ0.29% ⳮ0.02%
⳯experience 10–12 years ⳮ4.9% 0.5% ⳮ0.53% ⳮ0.38%
Probit coefficients
Unemployment rate at entry to the market
⳯experience 1–3 years ⳮ0.175 ⳮ0.079 ⳮ0.030 ⳮ0.014
(0.093) (0.066) (0.014) (0.014)
⳯experience 4–6 years ⳮ0.158 ⳮ0.030 ⳮ0.015 ⳮ0.006
(0.084) (0.083) (0.012) (0.015)
⳯experience 7–9 years ⳮ0.180 0.062 ⳮ0.017 ⳮ0.010
(0.068) (0.072) (0.011) (0.013)
⳯experience 10–12 years ⳮ0.215 ⳮ0.006 ⳮ0.027 ⳮ0.021
(0.073) (0.090) (0.013) (0.015)
Unemployment rate at entry⳯
upturn dummy
⳯experience 1–3 years ⳮ0.021 0.024 0.006 0.002
(0.029) (0.041) (0.008) (0.009)
⳯experience 4–6 years ⳮ0.054 ⳮ0.005 0.001 ⳮ0.003
(0.020) (0.055) (0.008) (0.009)
⳯experience 7–9 years ⳮ0.037 0.018 0.006 0.008
(0.027) (0.049) (0.008) (0.009)
⳯experience 10–12 years ⳮ0.033 0.067 0.006 ⳮ0.005
(0.020) (0.052) (0.009) (0.008)
Table 4(continued)
Observations 49,336 36,668 63,611 76,699
Pseudo R2 0.10 0.05 0.06 0.03
Note: Standard errors in parenthesis are calculated by bootstrapping (reps⳱200) with clustering by region/ state. Other controls included are the upturn dummy itself, the unemployment rate in survey year, potential experience, education dummies, graduation year dummies, region dummies, survey-year dummies, and region-specific linear trends.
Table 5
The effect of the unemployment rate at entry on fulltime status
(1) Hours worked in last week
Japan United States
High school
College Schooling ⱕ12
Schooling
⬎12
OLS Coefficients
⳯experience 1–3 years ⳮ0.609 0.587 0.047 ⳮ0.051
(0.949) (0.322) (0.102) (0.0106)
⳯experience 4–6 years ⳮ0.356 0.551 0.018 0.022
(0.754) (0.365) (0.081) (0.078)
⳯experience 7–9 years ⳮ0.933 0.324 0.035 0.101
(0.623) (0.294) (0.088) (0.081)
⳯experience 10–12 years ⳮ0.838 0.570 0.031 0.029
(0.718) (0.361) (0.078) (0.072)
Observations 46,169 37,660 50,250 68,430
R2 0.02 0.01 0.04 0.03
(continued)
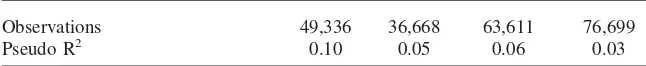
Even though the overall effect on average hours is small, there can be a significant effect on fulltime/parttime status. The lower panel of Table 5 shows the effect on the likelihood of being fulltime.19 The effect is negative and persistent for
less-educated Japanese men, and weaker and marginally significant for less-less-educated American men. There is no statistically significant negative effect for more-educated groups, and the overall pattern across the four groups is similar to the effect on employment.
174 The Journal of Human Resources
Table 5(continued)
(2) Pr(fulltimeemployed)
Japan United States
High school
College Schooling ⱕ12
Schooling
⬎12
Marginal effects
⳯experience 1–3 years ⳮ2.4% 0.5% ⳮ0.5% ⳮ0.4%
⳯experience 4–6 years ⳮ1.7% 0.4% ⳮ0.3% ⳮ0.4%
⳯experience 7–9 years ⳮ2.2% 0.1% 0.2% ⳮ0.4%
⳯experience 10–12 years ⳮ1.6% 1.4% ⳮ0.6% ⳮ0.2%
Probit Coefficients
⳯experience 1–3 years ⳮ0.161 0.053 ⳮ0.019 ⳮ0.019
(0.075) (0.059) (0.012) (0.013)
⳯experience 4–6 years ⳮ0.119 0.041 ⳮ0.010 ⳮ0.019
(0.056) (0.048) (0.012) (0.010)
⳯experience 7–9 years ⳮ0.152 0.012 0.007 ⳮ0.019
(0.052) (0.055) (0.014) (0.011)
⳯experience 10–12 years ⳮ0.109 0.145 ⳮ0.022 ⳮ0.011
(0.054) (0.101) (0.012) (0.012)
Observations 46,169 37,660 51,435 70,087
Pseudo R2 0.03 0.02 0.03 0.02
Note: Standard errors in parenthesis are calculated by bootstrapping (reps⳱200) with clustering by state/ region. Other controls included are the unemployment rate in survey year, potential experience, education (dummies for the Japanese sample, years of schooling for the American sample), graduation year dummies, region dummies, survey-year dummies, and region-specific linear trends.
B. Effect on Earnings
-.5
Unemployment rate at graduation High school or less
Unemployment rate at graduation College or more
Regional unemployment rates and log earnings (Japan)
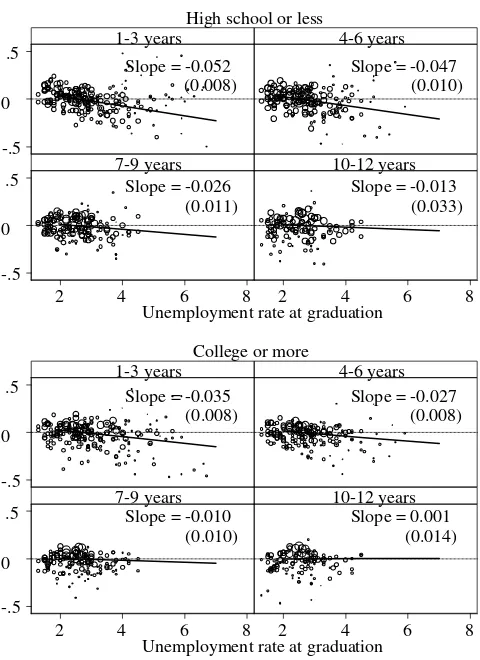
Note: “cohort” is defined by region and year of graduation. Each cohort is weighted by the number of individual observations that belong to the cohort. Log annual earnings are residuals net of the contempo-raneous unemployment rate, years of schooling and experience by single year. Figures in parenthesis under the slopes are standard errors.
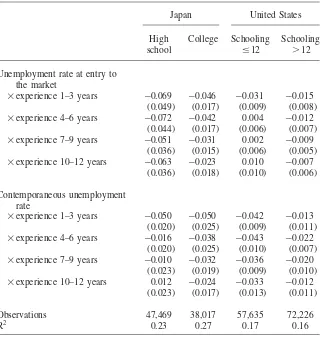
This pattern is robust to the inclusion of region- and graduation year-fixed effects. Table 6 reports the estimated coefficients of the unemployment rate at entry and the contemporaneous unemployment rate on log real annual earnings. The estimated equations are exactly the same as Equation 4.20A high unemployment rate at entry
176 The Journal of Human Resources Years of schooling 12
-1 Years of schooling > 12 Slope = -0.028
State unemployment rates and log earnings (United States)
Note: “cohort” is defined by region and year of graduation. Each cohort is weighted by the number of individual observations that belong to the cohort. Log annual earnings are residuals net of the contempo-raneous unemployment rate, years of schooling and experience by single year. Figures in parenthesis under the slopes are standard errors.
has a persistent negative effect for Japanese men. A one percentage point rise in the unemployment rate at entry leads to earning losses by 5–7 percent for over 12 years for the group without college education, although the large standard errors make the statistical significance marginal.21The effect is smaller but more precisely estimated,
Table 6
The Effect of the Unemployment Rate at Entry and the Contemporaneous Unemployment Rate on Log Real Annual Earnings
Japan United States
High school
College Schooling ⱕ12
Schooling
⬎12
Unemployment rate at entry to the market
⳯experience 1–3 years ⳮ0.069 ⳮ0.046 ⳮ0.031 ⳮ0.015
(0.049) (0.017) (0.009) (0.008)
⳯experience 4–6 years ⳮ0.072 ⳮ0.042 0.004 ⳮ0.012
(0.044) (0.017) (0.006) (0.007)
⳯experience 7–9 years ⳮ0.051 ⳮ0.031 0.002 ⳮ0.009
(0.036) (0.015) (0.006) (0.005)
⳯experience 10–12 years ⳮ0.063 ⳮ0.023 0.010 ⳮ0.007
(0.036) (0.018) (0.010) (0.006)
Contemporaneous unemployment rate
⳯experience 1–3 years ⳮ0.050 ⳮ0.050 ⳮ0.042 ⳮ0.013
(0.020) (0.025) (0.009) (0.011)
⳯experience 4–6 years ⳮ0.016 ⳮ0.038 ⳮ0.043 ⳮ0.022
(0.020) (0.025) (0.010) (0.007)
⳯experience 7–9 years ⳮ0.010 ⳮ0.032 ⳮ0.036 ⳮ0.020
(0.023) (0.019) (0.009) (0.010)
⳯experience 10–12 years 0.012 ⳮ0.024 ⳮ0.033 ⳮ0.012
(0.023) (0.017) (0.013) (0.011)
Observations 47,469 38,017 57,635 72,226
R2 0.23 0.27 0.17 0.16
Note: Standard errors in parenthesis are calculated by bootstrapping (reps⳱200) with clustering by state/ region. Other controls included are potential experience, education (dummies for the Japanese sample, years of schooling for the American sample), graduation year dummies, region dummies, survey-year dummies, and region-specific linear trends.
178 The Journal of Human Resources
Residual regional unemployment rates and residual log earnings (Japan)
Note: “cohort” is defined by region and year of graduation. Each cohort is weighted by the number of individual observations that belong to the cohort. See the text for variable definitions. Figures in parenthesis under the slopes are standard errors.
-1 Years of schooling 12
-1 Years of schooling > 12 Slope = -0.028
Residual state unemployment rates and residual log earnings (United States) Note: “cohort” is defined by state and year of graduation. Each cohort is weighted by the number of individual observations that belong to the cohort. See the text for variable definitions. Figures in parenthesis under the slopes are standard errors.
groups becomes subtle for American men, the difference in these patterns between Japan and the United States remains striking.22
180 The Journal of Human Resources
Table 7
The Effect of the Unemployment Rate at Entry on Log Real Annual Earnings, Allowing Different Effect between Upturns and Downturns
Japan United States
High school
College Schooling ⱕ12
Schooling
⬎12
Unemployment rate at entry to the market
⳯experience 1–3 years ⳮ0.079 ⳮ0.042 ⳮ0.034 ⳮ0.016
(0.055) (0.016) (0.011) (0.009)
⳯experience 4–6 years ⳮ0.080 ⳮ0.042 0.000 ⳮ0.016
(0.049) (0.018) (0.008) (0.008)
⳯experience 7–9 years ⳮ0.062 ⳮ0.028 ⳮ0.003 ⳮ0.011
(0.040) (0.016) (0.007) (0.006)
⳯experience 10–12 years ⳮ0.073 ⳮ0.022 0.007 ⳮ0.008
(0.039) (0.020) (0.011) (0.007)
Unemployment rate at entry⳯
upturn dummy
⳯experience 1–3 years 0.010 0.003 0.003 0.001
(0.009) (0.013) (0.006) (0.005)
⳯experience 4–6 years 0.006 0.008 0.004 0.006
(0.009) (0.013) (0.006) (0.005)
⳯experience 7–9 years 0.012 0.002 0.008 0.003
(0.009) (0.012) (0.005) (0.006)
⳯experience 10–12 years 0.009 0.006 0.004 0.000
(0.009) (0.009) (0.005) (0.006)
Observations 43,574 35,190 57,635 72,226
R2 0.22 0.27 0.17 0.16
Note: Standard errors in parenthesis are calculated by bootstrapping (reps⳱200) with clustering by region/ state. Other controls included are the upturn dummy itself, the unemployment rate in survey year, potential experience, education dummies, graduation year dummies, region dummies, survey-year dummies, and region-specific linear trends.
Table 7 allows the effect of unemployment rate at entry to vary between upturns and downturns; this is the same exercise as Table 4 for employment. Although the effect of the unemployment rate is slightly more negative during downturns for all groups, the differences are small and statistically insignificant.
Since many of those unemployed in the reference week report some positive earn-ings, this bias seems to be small (see the appendixes for more discussion); in any case, if there is any bias, it should work against our findings that the negative effect on earnings is stronger for less-educated Japanese men, because the negative effect on employment is also stronger for them.
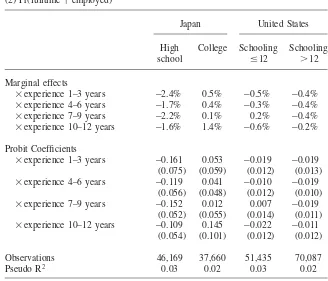
The persistent negative effects on employment and fulltime status for less-edu-cated Japanese men suggest that a part of the negative effect on earnings comes from unstable employment among them. This is consistent with our argument that the school based hiring system in Japan leaves less-educated Japanese men who failed to obtain a regular job upon graduation in unstable employment for a long time. For more direct evidence, Panel 1 of Table 8 confirms that worse labor market conditions at entry lower the ratio of regular employees (seishain)23 among
less-educated Japanese men, and that this effect lasts up to ten years. Also, the effect is weaker and statistically insignificant for the more-educated group.
If a recession at entry lowers the likelihood of having a regular job and it really affects earnings, the estimated effect of the unemployment rate at entry should be smaller within the sample of who obtained regular job upon graduation than in the entire sample. Since the information on the first job is not available, we estimate Equation 4 using the sample of workers currently in regular jobs.24Panel 2 of Table
8 shows that, as expected, the negative effect of graduating from high school during a recession is much smaller for regular employees.25Moreover, the effect does not
change much for college graduates, who are not affected by the school-based hiring system.
VI. Concluding Remarks
Entering the labor market during a recession has a persistent negative effect on earnings for young Japanese men. Moreover, a recession at entry not only lowers the annual earnings, but also raises the likelihood of nonemployment and parttime employment for less-educated Japanese, and a considerable part of the
neg-23. The Japanese Labor Force Survey asks each employed person (excluding self-employed) whether he/ she is employed as a regular employee, based on how their employers call them. The exact Japanese word corresponding to “regular” here is “seiki.” There is another definition of “regular employees,” which means those whose employment contracts do not specify termination date. Although the two classifications are determined independently from each other, the latter category based on the length of contract includes almost everyone classified as “regular” based on how they are called. We decide to use the classification based on how they are called because the classification based on the length of contract also includes a significant number of part-time workers, who are not usually considered as “seishain” or “seiki.” 24. It is difficult to estimate the effect within people who do not have a regular job, because a substantial number of them report zero-income and, at the same time, this group includes a nonnegligible number of high-earning free lancers. This complicates the effect of business cycle on the composition of this group and makes the direction of the potential bias ambiguous.
182 The Journal of Human Resources
Table 8
The Effect through Declined Regular Employment (Seishain) on Earnings in Japan
(1) Ratio ofseishainin the entire cohort (probit)
Japan
High school College
Marginal effects
⳯experience 1–3 years ⳮ4.6% ⳮ1.9%
⳯experience 4–6 years ⳮ4.0% ⳮ0.9%
⳯experience 7–9 years ⳮ2.3% 0.3%
⳯experience 10–12 years ⳮ1.5% 0.2%
Probit coefficients
⳯experience 1–3 years ⳮ0.142 ⳮ0.090
(0.052) (0.041)
⳯experience 4–6 years ⳮ0.121 ⳮ0.041
(0.060) (0.051)
⳯experience 7–9 years ⳮ0.071 0.015
(0.037) (0.048)
⳯experience 10–12 years ⳮ0.046 0.009
(0.034) (0.051)
Observations 53,441 39,521
Pseudo R2 0.07 0.03
(2) Log real annual earnings, forseishainonly (OLS)
Japan
High school College
OLS coefficients
⳯experience 1–3 years ⳮ0.007 ⳮ0.046
(0.019) (0.012)
⳯experience 4–6 years ⳮ0.015 ⳮ0.056
(0.020) (0.014)
⳯experience 7–9 years ⳮ0.013 ⳮ0.042
(0.017) (0.012)
Table 8(continued)
⳯experience 10–12 years ⳮ0.035 ⳮ0.027
(0.019) (0.017)
Observations 38,281 33,778
R2 0.26 0.35
Note: Standard errors in parenthesis are calculated by bootstrapping (reps⳱200) with clustering by region. Other controls included are the unemployment rate in survey year, potential experience, education dummies, graduation year dummies, region dummies, survey-year dummies, and region-specific linear trends.
ative effect on earnings is the effect through the lower likelihood of regular, stable employment. In contrast, the negative impact of graduating from high school during a recession on earnings is temporary in the United States. We find a modestly persistent negative effect of graduating from colleges, similar to the existing studies that focus on college graduates.
Existing studies have mainly focused on college graduates and found persistent but fading negative effect of a recession at entry. Their models implicitly or explic-itly ignore the effect through employment stability, which may be negligible for more-educated workers but not ignorable for less-educated workers. If dismissals are considered, less skilled workers are more likely to be laid off and lose the advantage of obtaining a good first job. We confirm that the effect of the labor market condition at graduation quickly fades away for less-educated American men. On the other hand, legally or institutionally enforced employment protection may place excessive burdens on those left outside of the protection. Our empirical results provide suggestive evidence that the stronger effect for less-educated Japanese men comes from chronic nonregular, unstable employment among those stranded out of the school-based hiring system, which does not exist in the United States.
184 The Journal of Human Resources
Appendix 1
Earnings Data
The Japanese Labour Force Survey asks “Earnings from employed work (including not incorporated self-employment).” The respondent chooses one of the following categories: 0, ⬍ 50, 50–99, 100–149, 150–199, 200–299, 300–399, 400–499, 500– 699, 700–999, 1000–1499, 1500- for 1996–2005; 0, ⬍ 100, 100–199, 200–299, 300–399, 400–499, 500–699, 700–999, 1000–1499, 1500– for 1986–1995 (in 10,000 yen). We define the nominal earnings as the middle value of each earnings category. For the top category, we set 2,100 following the convention of dealing with the CPS top coding (in any case, very few observations are in this category). Then, we divide the nominal earnings with the regional Consumer Price Index normalized so that the national average takes one in 2000.
For the March CPS, we use “PEARNVAL—total persons earnings” as the nom-inal annual earnings. This is the sum of wage and salary income and income from self-employment (including farm). Although this is in principle a continuous vari-able, 62 percent of the observations with positive earnings are bunched at every $1,000 and about 23 percent are even bunched at every $5,000. Thus it is more or less similar to the category data in the Japanese survey. Negative earnings are re-placed with zero. We divide the nominal earnings by the national Consumer Price Index normalized to take one in 2000.
Table A1 summarizes the fraction with zero or missing earnings. Table A2 reports the effect of the unemployment rate at entry on the likelihood of reporting zero earnings or missing earnings. The unemployment rate at entry slightly raises the probability of lacking valid earnings data for the less-educated groups, probably due to nonemployment. Assuming that those with lower potential wages are more likely to lack valid earnings due to nonemployment, the potential bias will, if it is not negligible, work against our argument for Japanese men.
Table A1
Fraction with Zero or Missing Earnings
Japan, High School or
Less
Japan, Junior College or
More
United States, Schooling
ⱕ12
United States, Schooling
⬎12
Experience⳱1–3 19.1% 5.5% 13.8% 6.2%
Experience⳱4–6 8.1% 3.7% 7.9% 5.4%
Experience⳱7–9 6.9% 3.4% 7.2% 5.4%
Table A2
The Effect of the Unemployment rates on the Likelihood of Zero or Missing Earnings
Probit coefficients
Japan United States
High
school College
Schooling ⱕ12
Schooling
⬎12
Unemployment rate at entry to the market
⳯experience 1–3 years 0.068 0.027 0.036 0.023
(0.055) (0.037) (0.014) (0.016)
⳯experience 4–6 years 0.060 0.123 0.024 0.005
(0.054) (0.043) (0.013) (0.013)
⳯experience 7–9 years 0.036 0.035 0.015 ⳮ0.008
(0.040) (0.041) (0.011) (0.013)
⳯experience 10–12 years 0.033 0.010 0.021 0.001
(0.047) (0.064) (0.014) (0.011)
Contemporaneous unemployment rate
⳯experience 1–3 years 0.052 0.020 0.052 ⳮ0.015
(0.045) (0.043) (0.014) (0.015)
⳯experience 4–6 years 0.059 ⳮ0.013 0.032 0.003
(0.034) (0.036) (0.019) (0.018)
⳯experience 7–9 years 0.036 0.001 0.046 ⳮ0.002
(0.033) (0.036) (0.016) (0.018)
⳯experience 10–12 years 0.017 0.041 0.027 ⳮ0.005
(0.045) (0.041) (0.019) (0.016)
Observations 52,342 39,000 63,611 76,699
Pseudo R2 0.186 0.180 0.077 0.026
186 The Journal of Human Resources
Appendix 2
Measurement Errors Caused by Migration across
Regions and Skipped/Repeated Grades
Since we use the region of current residence as a proxy for the region of residence at entry, measurement errors due to migration across regions attenuate the estimated effect of the unemployment rate at entry. The five-year migration rate across regions of Japanese men of relevant ages is about 10 percent or less, while the five-year migration rate across states of American men is 15–20 percent.26Thus, attenuation
bias due to measurement errors will be greater for Americans. However, the relative gap in migration rates between college-educated and not college-educated is fairly similar in Japan and the United States. Although the five-year migration rate across regions in Japan by age and education is unavailable, the migration rate across prefectures by age and education is available. Under an ad hoc assumption that the share of the migration across prefectures within a region in the total across-prefecture migration is the same across groups with different educational background, the five-year migration rate across region for 25–34-five-year-old Japanese men without a college education would be about 6 percent, and that for 25–34-year-olds with a college education would be about 14 percent. The across-state five-year migration rate of 25–39-year-old Americans with a college education is 26.0 percent and that of those without a college education is 13.5 percent, according to the cross-tabulation from Census 2000 by Franklin (2003).27
Another source of attenuation bias is errors in the year of graduation. Errors in the graduation year for Japanese high school graduates are negligible, and those for college graduates are mostly within one or two years. Admittedly, our definition of the year of graduation is noisier for American men: About 2 percent of 20-year-old white men in the CPS are still enrolled in high school, and 16 percent of 24-year-old white men are enrolled in college.28
Appendix 3
Business Cycles and Schooling Choice
First, let us check the effect on the completed education. Panel A of Table A3 shows the effect of unemployment rates around high school completion on the likelihood of college education among adult men. The dependent variable is an indicator of
26. The five-year migration rate across regions in Japan is 13.3 percent for 20–24-year-old men, 10.0 percent for 25–29-year-old men, and 8.2 percent for 30–34-year-old men. The migration rate across states is 18.5 percent for 20–24-year-old American men (including blacks), 19.7 percent for 25–29 year-olds, and 15.3 percent for 30–34 year-olds. Calculated from the Population Census in 2000 of each country. 27. This tabulation includes nonwhites and women.
Table A3
The Effect of the Local Unemployment Rate on the Enrollment Rates
(A) Unemployment rate around completion of high school on Pr(schooling ⬎ 12 years)
Japan United States
Unemployment rate at Age 18 Age 19 Age 18 Age 19
Marginal effect 0.2% ⳮ1.1% 0.5% 0.3%
Coefficient 0.004 ⳮ0.027 0.013 0.007
Standard errors (0.004) (0.021) (0.005) (0.005)
(B) Contemporaneous unemployment rate on high school enrollment rates
Japan United States
Age Current Last Current Last
16
17
18
ⳮ0.004
(0.011) * age 16–18 pooled
0.008 (0.010)
* age 16–18 pooled
0.001 0.000
(0.002) (0.002)
0.000 0.003
(0.002) (0.002)
0.009 0.008
(0.004) (0.004)
19 0.002 ⳮ0.004 0.000 ⳮ0.002
(0.018) (0.018) (0.003) (0.003)
20 N/A N/A ⳮ0.001 0.000
(0.002) (0.002)
(C) Contemporaneous unemployment rate on college enrollment rates
Japan United States
Age Current Last Current Last
18 0.005 0.004 ⳮ0.001 0.002
(0.007) (0.007) (0.004) (0.003)
19 0.018 0.020 0.012 0.013
(0.038) (0.038) (0.005) (0.005)
20 0.000 ⳮ0.011 0.003 0.006
(0.036) (0.036) (0.005) (0.005)