Immigration Policy and the Skills of
Immigrants to Australia, Canada,
and the United States
Heather Antecol
Deborah A. Cobb-Clark
Stephen J. Trejo
a b s t r a c t
Census data for 1990/91 indicate that Australian and Canadian immi-grants have higher levels of English fluency, education, and income (rela-tive to na(rela-tives) than do U.S. immigrants. This skill deficit for U.S. immi-grants arises primarily because the United States receives a much larger share of immigrants from Latin America than do the other two countries. After excluding Latin American immigrants, the observable skills of immi-grants are similar in the three countries. These patterns suggest that the comparatively low overall skill level of U.S. immigrants may have more to do with geographic and historical ties to Mexico than with the fact that skill-based admissions are less important in the United States than in Aus-tralia and Canada.
Heather Antecol is an assistant professor of economics at Claremont McKenna College, Deborah Cobb-Clark is director of the Social Policy Evaluation, Analysis, and Research Centre at the Austra-lian National University, and Stephen Trejo is an associate professor of economics at the University of Texas at Austin. For advice and comments, the authors thank George Borjas, Bruce Chapman, Bob Gregory, Peter Kuhn, Jeffrey Reitz, and two anonymous referees. The data used in this article can be obtained beginning August 2003 through July 2006 from Heather Antecol, Department of Economics, Claremont McKenna College, 500 E. Ninth Street, Claremont, CA 91711.
[Submitted March 2002; accepted May 2002]
ISSN 022-166X2003 by the Board of Regents of the University of Wisconsin System
I. Introduction
Australia, Canada, and the United States share a common history as major immigrant-receiving countries.1 In this paper, we compare the observable
skills—language fluency, education, and income—of immigrants to these three countries. These countries provide fertile ground for comparative analysis because although their economies are similar in many fundamental respects, labor market policies and institutions differ markedly, and this institutional variation provides a promising avenue for identifying the labor market effects of government policy. In addition, high-quality census microdata are available for each of these countries that make it possible to conduct detailed and comparable analyses of labor market out-comes.
Researchers and policymakers in the United States could learn a great deal from the attempts that Australia and Canada have made to screen for workers with special skills or high levels of education (Boyd 1976; Price 1979; Green and Green 1995). These efforts run counter to the family reunification emphasis of U.S. immigration policy. In the United States, concerns have arisen over the declining education and skill levels of successive waves of immigrants (Borjas 1995). Such concerns are reflected in those provisions of the Immigration Act of 1990 that seek to increase the number of immigrants admitted on the basis of employment-related skills, and these concerns have also prompted proposals to introduce more explicitly skill-based admissions criteria like those used in Australia and Canada.
Besides differences in immigration policy, structural and institutional differences in the labor markets of the three countries are also likely to influence the type of immigrants who are attracted to each destination. For many reasons (stronger labor unions, higher minimum wages, national health insurance, more generous unemploy-ment insurance and welfare systems), workers in the lower end of the income distri-bution are generally better off in Australia and Canada than in the United States, especially relative to the average worker in each country (Card and Freeman 1993; Gregory and Daly 1994). Furthermore, although all three countries have experienced widening income inequality over the past two decades, in the United States real incomes have fallen sharply for low-skill workers, whereas in Australia and Canada the corresponding decline in the bottom half of the income distribution has been much more modest (Freeman and Katz 1994). Comparative analysis may therefore shed light on how ongoing changes in the U.S. wage structure will affect the skill composition of immigrants to the United States and how these immigrants are likely to fare in the U.S. labor market.
In an earlier attempt to discern the effects of U.S. and Canadian immigration policy on immigrant outcomes, Duleep and Regets (1992) focused on comparing immigrants originating from the same region of the world. Although Canadian immi-grants were more language proficient, they possessed neither an education nor an earnings advantage relative to their U.S. counterparts. Duleep and Regets concluded that the Canadian points-based system had no effect on immigrant education and
earnings. Pooling immigrants across all source countries, Borjas (1993) found an earnings advantage for Canadian immigrants—resulting from Canadian immigrants having more education on average—which to a large extent disappeared once immi-grants from the same source country were compared. Borjas concluded that the Cana-dian immigration system produced a favorable effect on immigrant outcomes by altering the mix of source countries.
Using more recent data and extending the analysis to include Australia, we reex-amine the consequences of skill-based immigration policies on immigrant outcomes.2
To illustrate our strategy, consider the question of which country should attract the most skilled immigrant flow. On the one hand, the Australian and Canadian policy of admitting a large fraction of immigrants through a point system that screens for labor market skills suggests that these countries should receive a more skilled immi-grant flow than the United States. On the other hand, the theory of selective migration (Borjas 1991) predicts that the generous redistribution systems and relatively egali-tarian wage structures in Australia and Canada work in the opposite direction by attracting less skilled immigrants residing in the bottom half of the income distribu-tion. Because of these conflicting forces, it is not immediately obvious how differ-ences in immigration policies and institutional frameworks across these countries will affect the skill selectivity of immigrant flows.
To a large extent, however, the immigration point systems employed in Australia and Canada select immigrants based on easily observed characteristics such as age, education, language, and occupation. In terms of these characteristics, immigrants to Australia and Canada should be more productive than those migrating to the United States. Our tests of this hypothesis will reveal how successful immigration point systems are, in practice, at selecting immigrants with favorable skill measures, and how much this screening process raises the labor market productivity of immi-grant workers.3
Interestingly, the opposite pattern should emerge if we first control for the charac-teristics for which immigrant point systems screen. In particular, among immigrants with similar observable skill measures, the most productive should locate in the United States where there is less social insurance against poor labor market outcomes but a greater individual return to favorable outcomes. Our tests of this hypothesis will indicate to what extent immigrant location choices based on difficult-to-observe attributes, such as ability and ambition, are able to undo the selectivity intended by point systems. Alternatively, a finding that Australian and Canadian immigrants are superior to U.S. immigrants in terms of unobservable as well as observable
determi-2. For our purposes, an important advantage of the Australian data is that the language questions in the Australian and U.S. censuses are very similar, whereas the language information available in the Canadian census is not directly comparable.
nants of earnings would suggest that the ‘‘personal assessment’’ portion of a point system successfully screens for some of the difficult-to-observe attributes related to labor market productivity.
II. Immigration Policy in Australia, Canada, and the
United States
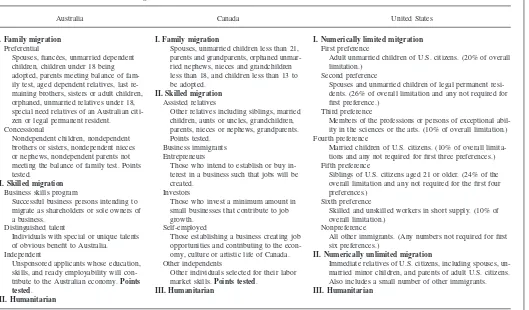
Tables 1 and 2 present an overview of the immigrant admissions policies of Australia, Canada, and the United States as of around 1990.4 Table 1
provides an outline of the main components of each country’s admissions policies, while Table 2 reports the percentages of immigrants who entered under various broad admission categories. Our primary goal is to show that a much larger share of Austra-lian and Canadian immigrants are admitted on the basis of employment-related skills than is true for U.S. immigrants.
In Australia and Canada, so-called ‘‘independent’’ migrants without relatives in the destination country can gain admission by passing a ‘‘points test’’ that weights characteristics such as age, education, language ability, and occupation. Some appli-cants with more distant relatives in the destination country are also evaluated by a points test, which in this case awards points for both skills and the closeness of the family relationship.5In addition, immigrants can be admitted because they possess
special talents or because they meet certain investment requirements and intend to establish a business in Australia or Canada. Immigrants entering Australia or Canada through any of the avenues just described are categorized as ‘‘skilled’’ immigrants in Table 2, because the human capital and potential labor market success of these applicants play a key role in their admission. In contrast, ‘‘family’’ immigrants are admitted solely on the basis of having a close relative in the destination country, and ‘‘refugees’’ are admitted on humanitarian grounds.
U.S. admissions policy distinguishes between two types of family immigrants. ‘‘Numerically unlimited’’ family immigrants are the immediate relatives of U.S. citizens who enter without counting against the overall cap set for annual immigrant admissions. ‘‘Numerically limited’’ family immigrants are the more distant relatives of U.S. citizens and the immediate relatives of U.S. permanent residents who, in 1990, had to enter under one of the relevant preference categories (first, second, fourth, or fifth) that regulate admissions subject to the annual cap.6In Table 2, we
label U.S. immigrants entering under the third or sixth preference categories as ‘‘skilled’’ immigrants, because only these immigrants were admitted on the basis of their occupation or labor market skills.
4. For detailed discussions of immigration policy in these three countries, see Boyd (1976), Briggs (1984), Chiswick (1987), Borjas (1988), Vialet (1989), Cobb-Clark (1990), Reimers and Troper (1992), Green (1995), Green and Green (1995), Lack and Templeton (1995), and Reitz (1998).
5. Immigrant admissions categories in which entry is determined jointly by a points test and by family relationships include the ‘‘concessional’’ category in Australia and the ‘‘assisted relatives’’ category in Canada.
The
Journal
of
Human
Resources
Table 1
Australian, Canadian, and U.S. Immigration Policies
Australia Canada United States
I. Family migration I. Family migration I. Numerically limited mitgration
Preferential Spouses, unmarried children less than 21, First preference
Spouses, fiance´es, unmarried dependent parents and grandparents, orphaned unmar- Adult unmarried children of U.S. citizens. (20% of overall
children, children under 18 being ried nephews, nieces and grandchildren limitation.)
adopted, parents meeting balance of fam- less than 18, and children less than 13 to Second preference
ily test, aged dependent relatives, last re- be adopted. Spouses and unmarried children of legal permanent
resi-maining brothers, sisters or adult children, II. Skilled migration dents. (26% of overall limitation and any not required for
orphaned, unmarried relatives under 18, Assisted relatives first preference.)
special need relatives of an Australian citi- Other relatives including siblings, married Third preference
zen or legal permanent resident. children, aunts or uncles, grandchildren, Members of the professions or persons of exceptional
abil-Concessional parents, nieces or nephews, grandparents. ity in the sciences or the arts. (10% of overall limitation.)
Nondependent children, nondependent Points tested. Fourth preference
brothers or sisters, nondependent nieces Business immigrants Married children of U.S. citizens. (10% of overall
limita-or nephews, nondependent parents not Entrepreneurs tions and any not required for first three preferences.)
meeting the balance of family test. Points Those who intend to establish or buy in- Fifth preference
tested. terest in a business such that jobs will be Siblings of U.S. citizens aged 21 or older. (24% of the
II. Skilled migration created. overall limitation and any not required for the first four
Business skills program Investors preferences.)
Successful business persons intending to Those who invest a minimum amount in Sixth preference
migrate as shareholders or sole owners of small businesses that contribute to job Skilled and unskilled workers in short supply. (10% of
a business. growth. overall limitation.)
Distinguished talent Self-employed Nonpreference
Individuals with special or unique talents Those establishing a business creating job All other immigrants. (Any numbers not required for first of obvious benefit to Australia. opportunities and contributing to the econ- six preferences.)
Independent omy, culture or artistic life of Canada. II. Numerically unlimited migration
Unsponsored applicants whose education, Other independents Immediate relatives of U.S. citizens, including spouses,
un-skills, and ready employability will con- Other individuals selected for their labor married minor children, and parents of adult U.S. citizens. tribute to the Australian economy.Points market skills.Points tested. Also includes a small number of other immigrants.
tested. III. Humanitarian III. Humanitarian
III. Humanitarian
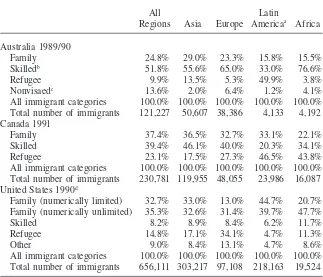
Table 2
Australian, Canadian, and U.S. Legal Immigrants, by Region of Origin and Broad Class of Admission
All Latin
Regions Asia Europe Americaa Africa
Australia 1989/90
Family 24.8% 29.0% 23.3% 15.8% 15.5%
Skilledb 51.8% 55.6% 65.0% 33.0% 76.6%
Refugee 9.9% 13.5% 5.3% 49.9% 3.8%
Nonvisaedc 13.6% 2.0% 6.4% 1.2% 4.1%
All immigrant categories 100.0% 100.0% 100.0% 100.0% 100.0%
Total number of immigrants 121,227 50,607 38,386 4,133 4,192 Canada 1991
Family 37.4% 36.5% 32.7% 33.1% 22.1%
Skilled 39.4% 46.1% 40.0% 20.3% 34.1%
Refugee 23.1% 17.5% 27.3% 46.5% 43.8%
All immigrant categories 100.0% 100.0% 100.0% 100.0% 100.0%
Total number of immigrants 230,781 119,955 48,055 23,986 16,087 United States 1990d
Family (numerically limited) 32.7% 33.0% 13.0% 44.7% 20.7%
Family (numerically unlimited) 35.3% 32.6% 31.4% 39.7% 47.7%
Skilled 8.2% 8.9% 8.4% 6.2% 11.7%
Refugee 14.8% 17.1% 34.1% 4.7% 11.3%
Other 9.0% 8.4% 13.1% 4.7% 8.6%
All immigrant categories 100.0% 100.0% 100.0% 100.0% 100.0%
Total number of immigrants 656,111 303,217 97,108 218,163 19,524
Sources: Australia (Bureau of Immigration Research, 1991, Table 2); Canada (Employment and Immigra-tion Canada 1992, Table IM16); United States (U.S. Department of Justice 1991, Tables 5 and 7) a. Includes Mexico, Central America, South America and the Caribbean.
b. Includes immigrants admitted under the Concessional Family Migration Program.
c. Immigrants for whom no visa is required, including New Zealand citizens, special eligibility migrants, Australian children born overseas, and others.
d. The U.S. figures reported here exclude those formerly undocumented migrants who were legalized under the amnesty provisions of the Immigration Reform and Control Act of 1986 (IRCA).
Table 2 shows that labor market skills play a much larger role in the immigrant admission policies of Australia and Canada than that of the United States. Around 1990, half of Australian immigrants and almost 40 percent of Canadian immigrants were admitted because of their labor market skills, whereas less than 10 percent of U.S. immigrants gained entry in this way.7Conversely, two-thirds of U.S. immigrants
were admitted on the basis of their family relationships, as compared with only a quarter of Australian immigrants and 37 percent of Canadian immigrants. The rela-tive importance of skilled versus family migration varies somewhat across regions of origin, but for all source regions the share of skilled immigrants is much higher and the share of family immigrants is much lower in Australia and Canada than in the United States.
Table 2 describes immigrant admissions in the three countries as of around 1990, but the same basic pattern existed throughout the 1970s and 1980s, when most of the immigrants we analyze below arrived in their destinations. Since the 1965 Amendments to the Immigration and Nationality Act, the skilled category has made up a very small percentage of the U.S. immigration flow (Reitz 1998). Point systems for screening a substantial portion of immigrant applicants were introduced in Can-ada in the late 1960s and in Australia in the early 1970s (Green and Green 1995; Reitz 1998). Although the fraction of immigrants admitted under a point system has varied over time, particularly for Canada, throughout this period the percentage of admissions based on labor market criteria has remained much higher in Australia and Canada than in the United States (Wright and Maxim 1993; Reitz 1998).
III. Data
We analyze individual-level data from the 1991 Australian and Cana-dian censuses and the 1990 U.S. census. These censuses provide comparable data on demographic characteristics and labor force behavior, as well as the requisite information on country of birth and year of arrival for immigrants.8The Australian
data set constitutes a one-percent sample of the population, the Canadian data set is a three-percent sample, and the U.S. data set is a five-percent sample.9Because
our purpose here is to compare immigrant skill levelsacross the three countries, rather than to compare rates of immigrant assimilation, the single cross-section of data that we employ from each country is sufficient.10
We restrict our analysis to men between the ages of 25 and 59 who are not institu-tional residents. We exclude women in order to minimize biases arising from selec-tive labor force participation, and we choose this age range so as to focus on men
larger share of immigrant admissions in Australia and Canada than in the United States. In addition, the data in Table 2 pertain only to legal admissions. The sizeable flow of undocumented migrants entering the United States outside formal channels implies that the share of all U.S. migrants admitted because of their skills is even lower than Table 2 suggests.
8. In this paper, we use the term ‘‘immigrant’’ as synonymous with foreign-born individuals, in contrast to the official terminology used by the U.S. Immigration and Naturalization Service in which immigrants are legal permanent residents, and other foreigners such as tourists, business travelers, and recent refugee arrivals are ‘‘nonimmigrant aliens.’’ The census data analyzed here cannot make such distinctions among foreign-born individuals.
9. The U.S. sample is much larger than the other two samples. To lighten the computational burden, we employ a 0.1 percent (or one in a 1,000) sample of U.S. natives, but we use the full 5 percent sample of U.S. immigrants, and we use the full samples of natives and immigrants available in the Australian and Canadian data. The Australian and Canadian census data are self-weighting, whereas the 1990 U.S. census provides sampling weights that we use in all of the calculations reported in the paper.
who have completed their formal schooling and who have a strong attachment to the labor market. Often, we compare outcomes for immigrants with those for natives who reside in the same destination country. In this way, natives can serve as a control for cross-country differences in social or economic conditions or in how the census data were collected. To increase comparability of the native samples and improve their usefulness as a control group, we exclude nonwhites from the native (but not the immigrant) samples.11Finally, residents of the Atlantic Provinces and the
Territo-ries are excluded from the Canadian samples, because for these individuals the infor-mation about country of birth and year of immigration is not reported in sufficient detail.
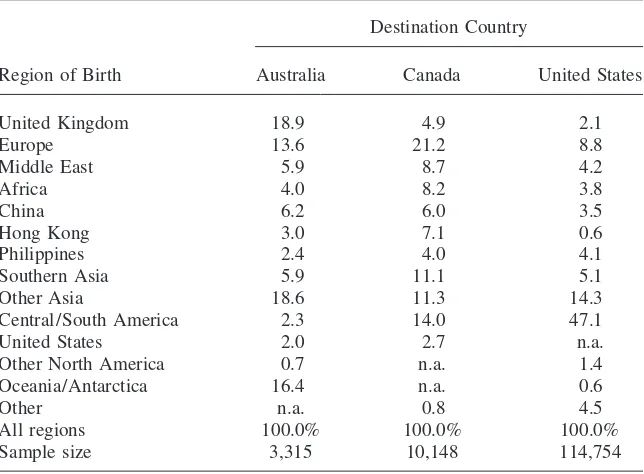
These restrictions produce final samples of immigrant men totaling approximately 11,500 for Australia, 38,600 for Canada, and 297,000 for the United States. For each destination country, Table 3 displays the region of birth distribution for the immi-grants in our samples who arrived within ten years of the census. The most striking difference in the national origin composition of recent immigrants to the three coun-tries involves Latin America. Almost half of post-1980 immigrants to the United States hail from Central or South America (including Mexico and the Caribbean), whereas only 14 percent of Canadian immigrants and 2 percent of Australian immi-grants come from this region.12 In addition, the United States receives relatively
fewer immigrants from the United Kingdom and Europe than do the other countries: immigrants from these regions comprise 11 percent of the U.S. immigration flow as compared to 26 percent of the Canadian flow and 33 percent of the Australian flow.13Another difference is that Asians make up a somewhat larger share of the
immigrant flow to Australia (36 percent) and Canada (40 percent) than to the United States (28 percent). Lastly, note that Australia receives a sizeable number of immi-grants from New Zealand.
In the sections that follow, we examine in turn three different measures of immi-grant labor market skills: fluency in the language of the destination country, years of schooling, and income. Our analysis will show that the national origin differences documented in Table 3—particularly the large share of U.S. immigrants from Latin America—explain most of the observed skill differences between immigrants to the three destination countries.
IV. Fluency in the Destination Country Language
The Australian and U.S. censuses provide very similar measures of English language proficiency. Respondents were first asked whether they speak a language other than English at home, and then only those who answered affirmatively were asked how well they speak English, with possible responses of ‘‘very well,’’ ‘‘well,’’ ‘‘not well,’’ or ‘‘not at all.’’ For the Australian and U.S. data, we define individuals as ‘‘fluent in the destination country language’’ if they speak only English11. In particular, we exclude blacks, Asians, Hispanics, and aboriginals from the native sample for each destination country.
12. The Australian and Canadian census data do not identify particular countries or sub-regions within Latin America, so we cannot further disaggregate this region of birth.
Table 3
Region of Birth Distributions of Post-1980/81 Immigrant Arrivals
Destination Country
Region of Birth Australia Canada United States
United Kingdom 18.9 4.9 2.1
Europe 13.6 21.2 8.8
Middle East 5.9 8.7 4.2
Africa 4.0 8.2 3.8
China 6.2 6.0 3.5
Hong Kong 3.0 7.1 0.6
Philippines 2.4 4.0 4.1
Southern Asia 5.9 11.1 5.1
Other Asia 18.6 11.3 14.3
Central/South America 2.3 14.0 47.1
United States 2.0 2.7 n.a.
Other North America 0.7 n.a. 1.4
Oceania/Antarctica 16.4 n.a. 0.6
Other n.a. 0.8 4.5
All regions 100.0% 100.0% 100.0%
Sample size 3,315 10,148 114,754
Note: Data are from the 1991 Australian and Canadian censuses and the 1990 U.S. census. The samples include foreign-born men ages 25–59 who immigrated during 1981–91 in the Australian and Canadian data or during 1980–90 in the U.S. data. Entries of ‘‘n.a.’’ indicate regions of birth that cannot be defined for a particular destination country. Columns may not sum to 100 percent because of rounding error. Sampling weights were used in the U.S. calculations.
or else report speaking English ‘‘very well’’ or ‘‘well.’’ Unfortunately, the language information available in the Canadian census is not directly comparable. In the Cana-dian data, we define individuals as fluent in the destination country language if they are able to conduct a conversation in either English or French.14
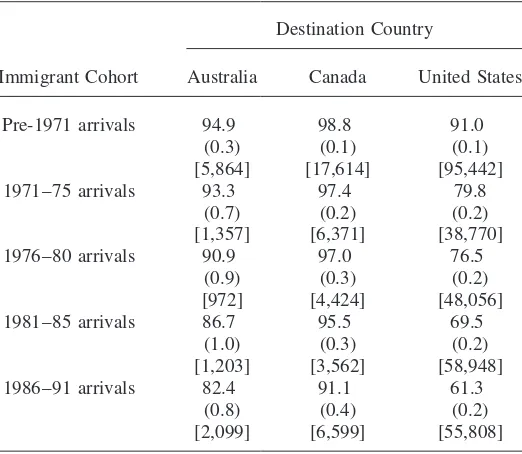
Given these definitions, Table 4 reports for each destination country the percent of immigrant men who are fluent in the native language, by five-year arrival cohorts.15
In all three destination countries, immigrant fluency rates rise monotonically with the length of time since arrival. This pattern is largely due to the fact that immigrants
14. In their study of immigrants to Canada and the United States, Duleep and Regets (1992) use these same definitions in an attempt to create roughly comparable measures of language fluency from the 1981 Canadian census and the 1980 U.S. census.
Table 4
Percent of Immigrants Fluent in Destination Country Language, by Arrival Cohort
Destination Country
Immigrant Cohort Australia Canada United States
Pre-1971 arrivals 94.9 98.8 91.0
(0.3) (0.1) (0.1)
[5,864] [17,614] [95,442]
1971–75 arrivals 93.3 97.4 79.8
(0.7) (0.2) (0.2)
[1,357] [6,371] [38,770]
1976–80 arrivals 90.9 97.0 76.5
(0.9) (0.3) (0.2)
[972] [4,424] [48,056]
1981–85 arrivals 86.7 95.5 69.5
(1.0) (0.3) (0.2)
[1,203] [3,562] [58,948]
1986–91 arrivals 82.4 91.1 61.3
(0.8) (0.4) (0.2)
[2,099] [6,599] [55,808]
Note: Standard errors are in parentheses, and sample sizes are in brackets. Data are from the 1991 Australian and Canadian censuses and the 1990 U.S. census. The sam-ples include foreign-born men ages 25–59. In the Australian and U.S. data, immigrants are designated as ‘‘fluent in the destination country language’’ if they speak only En-glish or else report speaking EnEn-glish ‘‘very well’’ or ‘‘well.’’ In the Canadian data, the corresponding measure of fluency identifies immigrants who can conduct a conver-sation in either English or French. The intervals listed above for the immigrant arrival cohorts are those defined in the Australian and Canadian data; the slightly different immigrant cohorts defined in the U.S. data are as follows: pre-1970, 1970–74, 1975– 79, 1980–84, and 1985–90. Sampling weights were used in the U.S. calculations.
who do not speak the destination country language when they arrive tend to acquire fluency over time as they adapt to their new home. We must caution, however, that differences between immigrant arrival cohorts observed at a single point in time may reflect permanent differences between these cohorts as well as the changes that occur for a given cohort as it spends more time in the destination country.16
For every arrival cohort, fluency rates are lower for U.S. immigrants than for Australian and Canadian immigrants, and the fluency deficit of U.S. immigrants is particularly large for cohorts arriving after 1970. For example, among the most recent
Table 5
Percent of Post-1980/81 Immigrant Arrivals Fluent in Destination Country Language, by Birthplace
Destination Country
Region of Birth Australia Canada United States
United Kingdom 100.0 100.0 99.7
(.) (.) (0.1)
Europe 75.3 89.7 77.6
(2.0) (0.7) (0.5)
Middle East 71.3 95.1 88.2
(3.2) (0.7) (0.5)
Africa 100.0 99.5 94.6
(.) (0.2) (0.4)
China 53.9 70.0 55.5
(3.5) (1.9) (0.9)
Hong Kong 81.0 96.7 81.6
(3.9) (0.7) (1.5)
Philippines 98.7 99.5 94.4
(1.3) (0.3) (0.4)
Southern Asia 96.4 94.5 93.5
(1.4) (0.7) (0.4)
Other Asia 66.8 88.3 64.7
(1.9) (0.9) (0.4)
Central/South America 57.7 94.6 51.2
(5.9) (0.6) (0.2)
All regions listed above 80.4 92.4 64.8
(0.7) (0.3) (0.2)
All regions, excluding Central/South 81.0 92.0 78.6
America (0.7) (0.3) (0.2)
immigrants (those arriving within five years of the census), only 61 percent of U.S. immigrants are fluent, as compared to 82 percent of Australian immigrants and 91 percent of Canadian immigrants. Even among immigrants who have spent 15–20 years in the destination country (1971–75 arrivals), the fluency rate of U.S. immi-grants (80 percent) is well below that of Australian immiimmi-grants (93 percent) and Canadian immigrants (97 percent). Given the substantial weight that the immigration point systems used in Australia and Canada have typically placed on language skills, these data seem to indicate that the Australian and Canadian point systems have been effective at tilting the immigration flow towards those proficient in the language of the destination country. In Table 4, the relative fluency of Canadian immigrants is probably overstated because of the particular wording of the language questions asked in the Canadian census. Recall, however, that the virtually identical language questions asked in the Australian and U.S. censuses produce fluency measures for these two countries that are directly comparable to each other. Moreover, the sheer magnitude of the fluency deficit observed for U.S. immigrants suggests that at least a portion of this deficit is real.
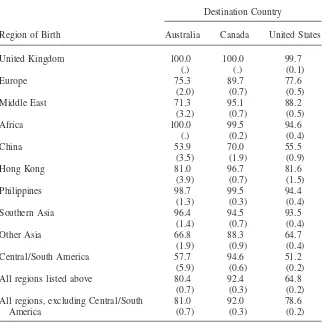
To learn more about the source of the fluency deficit for U.S. immigrants, Table 5 reports fluency rates separately by immigrant region of birth.17 In this table, we
limit the sample to immigrants who have been in the destination country for ten years or less. The fluency rates for Canadian immigrants are generally much higher than those observed for immigrants in the other two countries, but once again these high rates may well be an artifact of the way that fluency is measured in the Canadian data. More interesting and informative is the comparison between Australia and the United States. Fluency rates are quite similar for Australian and U.S. immigrants who come from the same source region. The last two rows of Table 5 show that the overall fluency rate for U.S. immigrants (65 percent) falls well short of the Australian rate (80 percent) almost entirely because the United States is home to a large popula-tion of Latin American immigrants who tend to speak English poorly. When we exclude immigrants from Central and South America, the U.S. fluency rate jumps to 79 percent, whereas the Australian fluency rate rises only very slightly to 81 percent.
V. Education
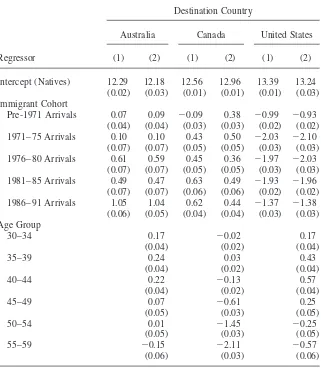
The second immigrant skill measure we analyze is education. Table 6 reports the results of least squares regressions in which the dependent variable is years of schooling and the independent variables include dummies identifying immigrants from various arrival cohorts.18The samples for these regressions include
natives as well as immigrants. In the columns labeled (1), no other independent variables are included in the regressions, so the intercepts represent the average edu-cation level of natives in each destination country, and the coefficients on the
immi-17. In Table 5, we exclude immigrants from the four source regions listed in Table 3 that cannot be defined for all three destination countries. The excluded regions are the following: United States, Other North America, Oceania/Antarctica, and Other.
grant cohort dummies show the education differentials between immigrants of each arrival cohort and natives. U.S. natives display the highest mean education level, 13.4 years, followed by Canadian natives with 12.6 years and Australian natives with 12.3 years.19U.S. immigrants, however, have substantially lower levels of
edu-cational attainment than U.S. natives, with the deficit ranging between one and two years, depending on the arrival cohort. This contrasts with Australian and Canadian immigrants, who tend to have more schooling than natives, in their respective desti-nations. The education levels of U.S. immigrants are low not just relative to U.S. natives, but also when compared directly with those of other immigrants. For all cohorts arriving after 1970, immigrants to Australia or Canada average at least a year more schooling than do U.S. immigrants from the same cohort.
The columns labeled (2) in Table 6 present education regressions that also include dummy variables identifying five-year age groups, with the dummy for ages 25–29 omitted. In these regressions, the intercepts now represent the average education level of 25–29 year-old natives, the immigrant cohort coefficients measure immi-grant-native differences after conditioning on age, and the coefficients on the age dummies, reflect education differentials between each age group and 25–29 year-olds. The age coefficients capture the secular rise in schooling levels that took place over this period, particularly in Canada, where average educational attainment is sharply higher for those born after 1940. Controlling for age, however, has little effect on the estimated immigrant-native schooling differentials or on the conclusion that the United States is less successful than Australia and Canada at attracting well-educated immigrants.
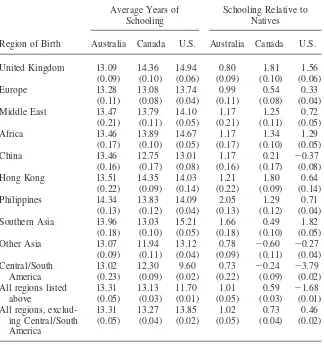
Table 7 shows immigrant educational attainment by region of birth for post-1980/ 81 arrivals. The first three columns report average years of schooling for each immi-grant group. Among immiimmi-grants from a particular source region, the education level of U.S. immigrants typically matches or exceeds that of Australian and Canadian immigrants, yet on the whole U.S. immigrants average about a year and a half less schooling than immigrants in the other two destination countries. As was the case with language fluency, the explanation for this pattern is the large immigration flow from Latin America to the United States. U.S. immigrants from Central and South America average less than ten years of schooling, and excluding this group from the calculations causes the mean education level of U.S. immigrants to shoot up from 11.7 years to 13.9 years. Considering only those who originate from outside of Latin America, U.S. immigrants average half a yearmoreschooling than immi-grants to Australia and Canada.
Because of differences across countries in educational practices and in the census questions used to elicit information about educational attainment, the years of school-ing variable we have constructed may suffer from comparability problems. To a large extent, however, we would expect such factors to impact measured schooling in similar ways for immigrants and natives in the same destination country. It is therefore useful to examine a measure of immigrant education that is defined relative to the education level of natives in the destination country, because in this way we may be able to mitigate biases from country-specific idiosyncrasies in the
Table 6
Education Regressions
Destination Country
Australia Canada United States
Regressor (1) (2) (1) (2) (1) (2)
Intercept (Natives) 12.29 12.18 12.56 12.96 13.39 13.24
(0.02) (0.03) (0.01) (0.01) (0.01) (0.03) Immigrant Cohort
Pre-1971 Arrivals 0.07 0.09 ⫺0.09 0.38 ⫺0.99 ⫺0.93
(0.04) (0.04) (0.03) (0.03) (0.02) (0.02)
1971–75 Arrivals 0.10 0.10 0.43 0.50 ⫺2.03 ⫺2.10
(0.07) (0.07) (0.05) (0.05) (0.03) (0.03)
1976–80 Arrivals 0.61 0.59 0.45 0.36 ⫺1.97 ⫺2.03
(0.07) (0.07) (0.05) (0.05) (0.03) (0.03)
1981–85 Arrivals 0.49 0.47 0.63 0.49 ⫺1.93 ⫺1.96
(0.07) (0.07) (0.06) (0.06) (0.02) (0.02)
1986–91 Arrivals 1.05 1.04 0.62 0.44 ⫺1.37 ⫺1.38
(0.06) (0.05) (0.04) (0.04) (0.03) (0.03) Age Group
30–34 0.17 ⫺0.02 0.17
(0.04) (0.02) (0.04)
35–39 0.24 0.03 0.43
(0.04) (0.02) (0.04)
40–44 0.22 ⫺0.13 0.57
(0.04) (0.02) (0.04)
45–49 0.07 ⫺0.61 0.25
(0.05) (0.03) (0.05)
50–54 0.01 ⫺1.45 ⫺0.25
(0.05) (0.03) (0.05)
55–59 ⫺0.15 ⫺2.11 ⫺0.57
(0.06) (0.03) (0.06)
Table 7
Average Education of Post-1980/81 Immigrant Arrivals, by Birthplace
Average Years of Schooling Relative to
Schooling Natives
Region of Birth Australia Canada U.S. Australia Canada U.S.
United Kingdom 13.09 14.36 14.94 0.80 1.81 1.56
(0.09) (0.10) (0.06) (0.09) (0.10) (0.06)
Europe 13.28 13.08 13.74 0.99 0.54 0.33
(0.11) (0.08) (0.04) (0.11) (0.08) (0.04)
Middle East 13.47 13.79 14.10 1.17 1.25 0.72
(0.21) (0.11) (0.05) (0.21) (0.11) (0.05)
Africa 13.46 13.89 14.67 1.17 1.34 1.29
(0.17) (0.10) (0.05) (0.17) (0.10) (0.05)
China 13.46 12.75 13.01 1.17 0.21 ⫺0.37
(0.16) (0.17) (0.08) (0.16) (0.17) (0.08)
Hong Kong 13.51 14.35 14.03 1.21 1.80 0.64
(0.22) (0.09) (0.14) (0.22) (0.09) (0.14)
Philippines 14.34 13.83 14.09 2.05 1.29 0.71
(0.13) (0.12) (0.04) (0.13) (0.12) (0.04)
Southern Asia 13.96 13.03 15.21 1.66 0.49 1.82
(0.18) (0.10) (0.05) (0.18) (0.10) (0.05)
Other Asia 13.07 11.94 13.12 0.78 ⫺0.60 ⫺0.27
(0.09) (0.11) (0.04) (0.09) (0.11) (0.04)
Central/South 13.02 12.30 9.60 0.73 ⫺0.24 ⫺3.79
America (0.23) (0.09) (0.02) (0.22) (0.09) (0.02)
All regions listed 13.31 13.13 11.70 1.01 0.59 ⫺1.68
above (0.05) (0.03) (0.01) (0.05) (0.03) (0.01)
All regions, exclud- 13.31 13.27 13.85 1.02 0.73 0.46
ing Central/South (0.05) (0.04) (0.02) (0.05) (0.04) (0.02)
America
ment of schooling levels. The last three columns of Table 7 report a relative education measure, here defined as the difference in average years of schooling between a particular immigrant group and natives in the same destination country. Because of the relatively high education level of U.S. natives, by this measure U.S. immigrants remain somewhat less educated than Australian and Canadian immigrants even after we exclude those originating from Latin America. In particular, considering only immigrants who arrived after 1980/81 and who were not born in Latin America, Australian immigrants average a year more schooling than Australian natives and Canadian immigrants average three-quarters of a year more schooling than Canadian natives. The relative education advantage for U.S. immigrants of one-half year is smaller than the corresponding education advantages observed for Australian and Canadian immigrants, but note that including Latin American immigrants in the cal-culation results in U.S. immigrants averaging 1.68 years lessschooling than U.S. natives. Regardless of whether immigrant education levels are measured in absolute terms or relative to natives, the educational gap between U.S. immigrants and immi-grants in the other two destination countries arises primarily because the United States receives a large flow of poorly-educated immigrants from Latin America.20
Tables 6 and 7 provide information about average schooling levels. Immigration point systems like those used in Australia and Canada might be particularly effective at screening out immigrants from the bottom tail of the education distribution. In our data, however, the patterns evident at low education levels are similar to those just described for average education levels. For example, among immigrants arriving after 1980/81, the share with ten or fewer years of schooling is 15.8 percent in Australia, 15.7 percent in Canada, and 29.9 percent in the United States.21Excluding
immigrants from Latin America barely affects the Australian and Canadian calcula-tions but drops the share for U.S. immigrants to 13.8 percent. Once immigrants from Latin America are excluded, U.S. immigrants are less likely than Australian and Canadian immigrants to possess low levels of schooling.
VI. Income
The final immigrant skill measure we analyze is personal income. Ideally, we would prefer to use data on earnings rather than income, but the Austra-lian census does not distinguish earnings from other income sources.22To increase
the correspondence between income and earnings, we now restrict the samples to employed men.23The Australian data report employment during the census survey
week and ‘‘usual’’ weekly income, whereas the Canadian and U.S. data on
employ-20. This conclusion continues to hold when we replicate the analysis in Table 7 for immigrant cohorts arriving before 1980/81.
21. The corresponding shares among natives are 32.2 percent in Australia, 21.1 percent in Canada, and 8.1 percent in the United States.
22. Earning information is available in the Canadian and U.S. censuses, however, and for these two coun-tries we have replicated the analyses reported below using earnings rather than income as the dependent variable. The income and earnings regression produce similar results.
ment and income refer to the calendar year preceding the census. The Canadian and U.S. income data have been converted to a weekly basis so as to match the Australian data.24
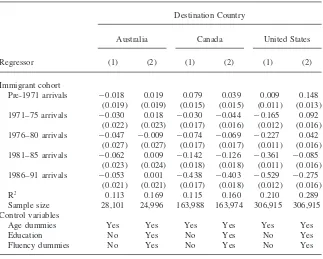
Tables 8 and 9 present estimates from least squares regressions in which the depen-dent variable is the natural logarithm of weekly personal income, and the samples pool immigrant and native men. Two specifications are reported for each destination country. In the first specification, the independent variables include immigrant arrival cohort dummies, age dummies, controls for geographic location, and indicators for hours worked during the census survey week. The coefficients of the geographic location and weekly hours of work variables are restricted to be the same for immi-grants and natives, whereas the coefficients of the age dummies are allowed to vary by nativity. The second specification adds as regressors years of schooling and indi-cators for fluency in the language of the destination country, and here the return to education can vary by nativity.
Table 8 reports the immigrant cohort coefficients from these regressions. These coefficients have been normalized to represent immigrant-native income differentials for men who are aged 25–29 (in both specifications) and who have 12 years of schooling (in Specification 2). Table 9 reports the coefficients of the age, education, and fluency variables. Note that the interactions between nativity and age in these regressions imply that the immigrant-native income gaps presented in Table 8 for ages 25–29 will differ at older ages.
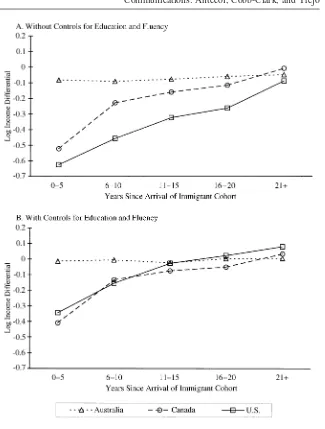
Figure 1 provides a convenient way of summarizing the immigrant-native income differentials implied by these regressions. Based on the specification that does not control for education and fluency, the top panel of Figure 1 shows the predicted log income differentials between immigrant and native men, by destination country and immigrant arrival cohort.25The bottom panel of Figure 1 is the same as the top panel,
except that the bottom panel is based on the regression specification that adds con-trols for education and fluency.26In other words, the top panel of Figure 1
corre-sponds to Specification 1 in Tables 8 and 9, whereas the bottom panel of the figure corresponds to Specification 2.
A word of caution is in order about interpreting these graphs. Because analyses of immigrant outcomes using a single cross section of data cannot distinguish
assimi-24. Another difference between the income measures available for each country is that the Australian census reports income in 14 intervals, whereas the Canadian and U.S. censuses provide continuous mea-sures of income. For Australia, we use the midpoints of the reported income intervals to construct the income variable employed in our regressions. For Canada and the United States, the results reported here employ a continuous income variable, but we obtain similar results when we instead group these data into intervals and assign midpoints so as to mimic the Australian data.
25. To control for age differences, both across countries and between immigrants and natives within a country, these calculations assign the same age distribution to all groups. In particular, we use the age distribution observed for our sample of U.S. immigrants: 20.2 percent are in the 25–29 age range, 20.7 percent are 30–34, 17.5 percent are 35–39, 14.8 percent are 40–44, 11.2 percent are 45–49, 9.0 percent are 50–54, and 6.7 percent are 55–59. Because the immigrant-native income differentials estimated for each country are allowed to vary by age group, the overall differentials shown in Figure 1 depend on the particular age distribution used. However, similar patterns emerge from using the age distributions observed for any of the immigrant or native samples in our three destination countries.
Table 8
Income Regressions: Immigrant Cohort Coefficients
Destination Country
Australia Canada United States
Regressor (1) (2) (1) (2) (1) (2)
Immigrant cohort
Pre-1971 arrivals ⫺0.018 0.019 0.079 0.039 0.009 0.148 (0.019) (0.019) (0.015) (0.015) (0.011) (0.013) 1971–75 arrivals ⫺0.030 0.018 ⫺0.030 ⫺0.044 ⫺0.165 0.092
(0.022) (0.023) (0.017) (0.016) (0.012) (0.016) 1976–80 arrivals ⫺0.047 ⫺0.009 ⫺0.074 ⫺0.069 ⫺0.227 0.042
(0.027) (0.027) (0.017) (0.017) (0.011) (0.016) 1981–85 arrivals ⫺0.062 0.009 ⫺0.142 ⫺0.126 ⫺0.361 ⫺0.085
(0.023) (0.024) (0.018) (0.018) (0.011) (0.016) 1986–91 arrivals ⫺0.053 0.001 ⫺0.438 ⫺0.403 ⫺0.529 ⫺0.275
(0.021) (0.021) (0.017) (0.018) (0.012) (0.016) R2 0.113 0.169 0.115 0.160 0.210 0.289
Sample size 28,101 24,996 163,988 163,974 306,915 306,915 Control variables
Age dummies Yes Yes Yes Yes Yes Yes Education No Yes No Yes No Yes Fluency dummies No Yes No Yes No Yes
Note: The dependent variable is the natural logarithm of weekly personal income. The coefficients were estimated by least squares, and standard errors are shown in parentheses. Data are from the 1991 Australian and Canadian censuses and the 1990 U.S. census. The samples include men ages 25–59, with nonwhites excluded from the native but not the foreign-born samples. Only employed men are included in samples. In addition to the control variables listed above, all regressions include indicators for geographical location and hours worked during the survey week. The coefficients of the controls for geographic location, weekly hours of work, and fluency are restricted to be the same for immigrants and natives, whereas the coefficients of the age and education variables are allowed to vary by nativity. The intervals listed above for the immigrant arrival cohorts are those defined in the Australian and Canadian data; the slightly different immigrant cohorts defined in the U.S. data are as follows: pre-1970, 1970–74, 1975–79, 1980–84, and 1985–90. The immigrant cohort coefficients reported in this table have been normalized to represent immi-grant-native income differentials for men who are aged 25–29 (in both specifications) and who have 12 years of education (in Specification 2). Sampling weights were used in the U.S. calculations.
lation and cohort effects, the plots do not portray the life-cycle trajectories of immi-grants as they gain experience in the destination country labor market. Instead, the graphs are only intended to illustrate the income differences between immigrants of various arrival cohorts and natives at a given point in time.
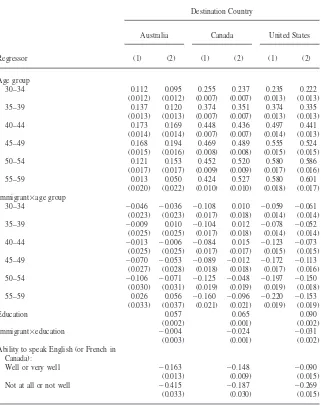
immi-Table 9
Income Regressions: Age, Education, and Fluency Coefficients
Destination Country
Australia Canada United States
Regressor (1) (2) (1) (2) (1) (2)
Age group
30–34 0.112 0.095 0.255 0.237 0.235 0.222 (0.012) (0.012) (0.007) (0.007) (0.013) (0.013) 35–39 0.137 0.120 0.374 0.351 0.374 0.335
(0.013) (0.013) (0.007) (0.007) (0.013) (0.013) 40–44 0.173 0.169 0.448 0.436 0.497 0.441
(0.014) (0.014) (0.007) (0.007) (0.014) (0.013) 45–49 0.168 0.194 0.469 0.489 0.555 0.524
(0.015) (0.016) (0.008) (0.008) (0.015) (0.015) 50–54 0.121 0.153 0.452 0.520 0.580 0.586
(0.017) (0.017) (0.009) (0.009) (0.017) (0.016) 55–59 0.013 0.050 0.424 0.527 0.580 0.601
(0.020) (0.022) (0.010) (0.010) (0.018) (0.017) Immigrant⫻age group
30–34 ⫺0.046 ⫺0.036 ⫺0.108 0.010 ⫺0.059 ⫺0.061 (0.023) (0.023) (0.017) (0.018) (0.014) (0.014) 35–39 ⫺0.009 0.010 ⫺0.104 0.012 ⫺0.078 ⫺0.052
(0.025) (0.025) (0.017) (0.018) (0.014) (0.014) 40–44 ⫺0.013 ⫺0.006 ⫺0.084 0.015 ⫺0.123 ⫺0.073
(0.025) (0.025) (0.017) (0.017) (0.015) (0.015) 45–49 ⫺0.070 ⫺0.053 ⫺0.089 ⫺0.012 ⫺0.172 ⫺0.113
(0.027) (0.028) (0.018) (0.018) (0.017) (0.016) 50–54 ⫺0.106 ⫺0.071 ⫺0.125 ⫺0.048 ⫺0.197 ⫺0.150
(0.030) (0.031) (0.019) (0.019) (0.019) (0.018) 55–59 0.026 0.056 ⫺0.160 ⫺0.096 ⫺0.220 ⫺0.153
(0.033) (0.037) (0.021) (0.021) (0.019) (0.019)
Education 0.057 0.065 0.090
(0.002) (0.001) (0.002) Immigrant⫻education ⫺0.004 ⫺0.024 ⫺0.031
(0.003) (0.001) (0.002) Ability to speak English (or French in
Canada):
Well or very well ⫺0.163 ⫺0.148 ⫺0.090 (0.013) (0.009) (0.015) Not at all or not well ⫺0.415 ⫺0.187 ⫺0.269
(0.033) (0.030) (0.015)
Figure 1
Predicted Immigrant-Native Income Differentials
per-cent for Australian immigrants, 7.5 perper-cent for Canadian immigrants, and 2.7 perper-cent for U.S. immigrants. The comparison between the top and bottom panels of Figure 1 suggests that the smaller income deficits (relative to natives) observed for Austra-lian and Canadian immigrants than for U.S. immigrants are largely explained by the higher levels of education and fluency possessed by Australian and Canadian immigrants. Indeed, after conditioning on these observable skill measures, the rela-tive incomes of U.S. immigrants compare favorably with those of Canadian immi-grants for all arrival cohorts, and they compare favorably with those of Australian immigrants for cohorts that have been in the destination country for more than ten years.
In Australia, immigrant-native income differences are relatively small to begin with and essentially disappear after controlling for education and fluency. Consistent with previous research, the Australian data show little correlation between an immi-grant’s income and his year of arrival.27In addition, Table 9 indicates that Australian
immigrants earn the same return to education as Australian natives, whereas the Canadian and U.S. data show the expected pattern of a lower return to education for immigrants.28Evidently, both in terms of the intercept and the return to education,
the wage structure is similar for immigrants and natives in Australia.
Tables 10 and 11and Figure 2 replicate the preceding analysis of immigrant-native income differentials, but now using samples from each country that exclude immi-grants born in Central and South America. With respect to comparisons of the relative incomes of immigrants in the three destination countries, notice that the toppanel of Figure 2 resembles thebottompanel of Figure 1. Excluding Latin American immi-grants (Figure 2) dramatically shrinks immigrant-native income differentials in the United States, resulting in income gaps for U.S. immigrants that are smaller than those of Canadian immigrants and some groups of Australian immigrants. With Latin American immigrants included in the samples (Figure 1), recall that controlling for education and fluency generated this same general pattern of results. Given our ear-lier findings that unskilled immigration from Latin America explains why U.S. immi-grants overall have lower levels of education and English fluency than Australian and Canadian immigrants, it is not surprising that the impact of excluding Latin American immigrants on immigrant-native income differentials in the three countries is similar to the impact of controlling for education and fluency.
Table 10
Income Regressions, Excluding Immigrants from Central/South America: Immigrant Cohort Coefficients
Destination country
Australia Canada United States
Regressor (1) (2) (1) (2) (1) (2)
Immigrant cohort
Pre-1971 arrivals ⫺0.020 0.017 0.073 0.037 0.078 0.125 (0.019) (0.019) (0.016) (0.016) (0.012) (0.013) 1971–75 arrivals ⫺0.033 0.013 ⫺0.008 ⫺0.009 0.003 0.099
(0.023) (0.023) (0.018) (0.018) (0.013) (0.017) 1976–80 arrivals ⫺0.049 ⫺0.015 ⫺0.062 ⫺0.045 ⫺0.089 0.010
(0.028) (0.028) (0.018) (0.018) (0.013) (0.018) 1981–85 arrivals ⫺0.063 0.006 ⫺0.128 ⫺0.099 ⫺0.240 ⫺0.115
(0.023) (0.024) (0.020) (0.020) (0.013) (0.018) 1986–91 arrivals ⫺0.051 0.002 ⫺0.440 ⫺0.388 ⫺0.381 ⫺0.281
(0.021) (0.021) (0.019) (0.019) (0.013) (0.018) R2
0.113 0.168 0.113 0.159 0.198 0.273 Sample size 27,959 24,892 160,147 160,133 183,193 183,193 Control variables
Age dummies Yes Yes Yes Yes Yes Yes Education No Yes No Yes No Yes Fluency dummies No Yes No Yes No Yes
Table 11
Income Regressions, Excluding Immigrants from Central/South America: Age, Education, and Fluency Coefficients
Destination Country
Australia Canada United States
Regressor (1) (2) (1) (2) (1) (2)
Age group
30–34 0.112 0.095 0.252 0.236 0.235 0.222 (0.012) (0.012) (0.007) (0.007) (0.013) (0.013) 35–39 0.137 0.120 0.370 0.350 0.374 0.334
(0.013) (0.013) (0.007) (0.007) (0.013) (0.013) 40–44 0.173 0.169 0.445 0.434 0.496 0.441
(0.014) (0.014) (0.007) (0.007) (0.014) (0.013) 45–49 0.168 0.194 0.466 0.488 0.555 0.524
(0.015) (0.016) (0.008) (0.008) (0.015) (0.015) 50–54 0.121 0.153 0.449 0.518 0.580 0.585
(0.017) (0.017) (0.009) (0.009) (0.017) (0.016) 55–59 0.013 0.050 0.421 0.525 0.580 0.601
(0.020) (0.022) (0.010) (0.010) (0.018) (0.017) Immigrant⫻age group
30–34 ⫺0.048 ⫺0.035 ⫺0.101 0.018 ⫺0.022 ⫺0.018 (0.023) (0.023) (0.019) (0.019) (0.015) (0.015) 35–39 ⫺0.008 0.011 ⫺0.091 0.029 ⫺0.010 0.026
(0.025) (0.025) (0.018) (0.019) (0.016) (0.015) 40–44 ⫺0.007 0.001 ⫺0.075 0.025 ⫺0.038 0.021
(0.025) (0.025) (0.018) (0.018) (0.016) (0.016) 45–49 ⫺0.068 ⫺0.050 ⫺0.072 0.006 ⫺0.057 0.004
(0.027) (0.028) (0.019) (0.019) (0.018) (0.018) 50–54 ⫺0.104 ⫺0.068 ⫺0.119 ⫺0.034 ⫺0.104 ⫺0.043
(0.030) (0.032) (0.020) (0.020) (0.020) (0.019) 55–59 0.026 0.058 ⫺0.153 ⫺0.080 ⫺0.137 ⫺0.051
(0.033) (0.037) (0.022) (0.022) (0.021) (0.020)
Education 0.057 0.064 0.090
(0.002) (0.001) (0.002) Immigrant⫻education ⫺0.004 ⫺0.024 ⫺0.029
(0.003) (0.001) (0.002) Ability to speak English (or French in
Canada)
Well or very well ⫺0.164 ⫺0.171 ⫺0.089 (0.013) (0.010) (0.018) Not at all or not well ⫺0.425 ⫺0.222 ⫺0.236
(0.034) (0.032) (0.023)
Figure 2
VII. Conclusion
Census data for 1990/91 indicate that Australian and Canadian immi-grants have higher levels of English fluency, education, and income (relative to na-tives) than do U.S. immigrants. This skill deficit for U.S. immigrants arises primarily because the United States receives a much larger share of immigrants from Latin America than do the other two countries.
In his analysis of earlier census data for Canada and the United States, Borjas reports a similar finding: ‘‘Differences in the national-origin mix of immigrants arriv-ing in Canada and the United States since 1965 are mainly responsible for the higher average skills and relative wages of immigrants in Canada‘‘ (Borjas 1993, p. 35). The large U.S. immigration flow from Latin America plays a leading role in this story, although not quite as dominant a role in Borjas’s version of the story as it does in ours.29From his analysis, Borjas concludes that the Canadian ‘‘point system works
because it alters the national-origin mix of immigrant flows‘‘ (Borjas 1993, p. 40). We do not believe, however, that our analysis provides much support for the prop-osition that the skills of U.S. immigrants would improve if the United States were to adopt an immigration point system similar to those in Australia and Canada. For several reasons, we strongly suspect that the Australian and Canadian point systems are not the primary reason that these countries receive few Latin American immi-grants relative to the United States. First of all, the United States shares a wide border and a long history with Mexico, and these factors undoubtedly contribute to the large presence of Latin American immigrants in the United States. Second, Australia and Canada never received many immigrants from Latin America, even before immigra-tion point systems were introduced in Australia in the 1970s and Canada in the late 1960s (see Reitz 1998, Table 1.1, pp. 10–12). Third, much of U.S. immigration from Latin America is undocumented (Warren and Passel 1987; Woodrow and Passel 1990) and subject to limited official control (Bean, Espenshade, White, and Dymow-ski 1990; Donato, Durand, and Massey 1992; Kossoudji 1992). A point system that screens legal immigrants for skills may do little to raise the skills or restrict the entry of Latin American immigrants to the United States, because these immigrants seem to find it relatively easy to enter outside of the official admissions system. Finally, we note that the general patterns reported here for men also emerge for women, even though female immigrants are much more likely to enter as dependent family members not subject to any particular selection criteria (Antecol, Cobb-Clark, and Trejo 2002).
References
Antecol, Heather, Deborah A. Cobb-Clark, and Stephen J. Trejo. 2002. ‘‘Human Capital and Earnings of Female Immigrants to Australia, Canada, and the United States.’’ Bonn, Germany: IZA Discussion Paper #575.
Australian Department of Immigration, Local Government, and Ethnic Affairs (ADILGEA).
1991.Efficiency Audit, Audit Report No. 11, 1991–1992. Canberra: Australian Govern-ment Publishing Service.
Bean, Frank D., Thomas J. Espenshade, Michael J. White, and Robert F. Dymowski. 1990. ‘‘Post-IRCA Changes in the Volume and Composition of Undocumented Migration to the United States: An Assessment Based on Apprehensions Data.’’ InUndocumented Migra-tion to the United States: IRCA and the Experience of the 1980s, ed. Frank D. Bean, Barry Edmonston, and Jeffrey S. Passel, 111-58. Washington, D.C.: Urban Institute Press. Borjas, George J.1988.International Differences in the Labor Market Performance of
Im-migrants. Kalamazoo, Mich.: W.E. Upjohn Institute for Employment Research. ———. 1991. ‘‘Immigration and Self-Selection.’’ InImmigration, Trade, and the Labor
Market, ed. John M. Abowd and Richard B. Freeman, 29-76. Chicago: University of Chi-cago Press.
———. 1993. ‘‘Immigration Policy, National Origin, and Immigrant Skills: A Comparison of Canada and the United States.’’ In Small Differences That Matter:Labor Markets and Income Maintenance in Canada and the United States, ed. David Card and Richard B. Freeman, 21–43. Chicago: University of Chicago Press.
———. 1995. ‘‘Assimilation and Changes in Cohort Quality Revisited: What Happened to Immigrant Earnings in the 1980s?’’Journal of Labor Economics13(2):201–45. Boyd, Monica. 1976. ‘‘Immigration Policies and Trends: A Comparison of Canada and the
United States.’’Demography18(1):83–104.
Bureau of Immigration Research, Statistics Section. 1991.Settler Arrivals 1989-1990 Statis-tical Report No. 3.Canberra: Australian Government Publishing Service.
Briggs, Vernon M., Jr. 1984.Immigration Policy and the American Labor Force. Balti-more: Johns Hopkins University Press.
Card, David, and Richard B. Freeman, eds. 1993.Small Differences That Matter: Labor Markets and Income Maintenance in Canada and the United States.Chicago: University of Chicago Press.
Carliner, Geoffrey. 1995. ‘‘The Language Ability of U.S. Immigrants: Assimilation and Co-hort Effects.’’ Cambridge, Mass.: National Bureau of Economic Research Working Pa-per#5222.
———. 1996. ‘‘The Wages and Language Skills of U.S. Immigrants.’’ Cambridge, Mass.: National Bureau of Economic Research Working Paper#5763.
Chapman, Bruce J., and Robyn R. Iredale. 1993. ‘‘Immigrant Qualifications: Recognition and Relative Wage Outcomes.’’International Migration Review27(2):359–87. Chiswick, Barry R. 1978. ‘‘The Effect of Americanization on the Earnings of Foreign
Born Men.’’Journal of Political Economy86(5):897–921.
———. 1987. ‘‘Immigration Policy, Source Countries, and Immigrant Skills: Australia, Canada, and the United States.’’In The Economics of Immigration: Proceedings of a Conference at the Australian National University, ed. Lyle Baker and Paul Miller, 163-206. Canberra: Australian Government Publishing Service.
Cobb-Clark, Deborah A. 1990.Immigrant Selectivity: The Roles of Household Structure and U.S. Immigration Policy. Ph.D. dissertation, Department of Economics. Ann Arbor: University of Michigan.
Donato, Katharine M., Jorge Durand, and Douglas S. Massey. 1992. ‘‘Stemming the Tide? Assessing the Deterrent Effects of the Immigration Reform and Control Act.’’ Demogra-phy29(2):139–57.
Duleep, Harriet Orcutt, and Mark C. Regets. 1992. ‘‘Some Evidence on the Effects of Ad-missions Criteria on Immigrant Assimilation.’’In Immigration, Language and Ethnic Is-sues: Canada and the United States, ed. Barry R. Chiswick, 410–39. Washington, D.C.: American Enterprise Institute.
Evans, M.D.R., Jonathan Kelley, and Richard A. Wanner. 1998. ‘‘The Consequences of Di-vorce for Children’s Education: Australia, Canada, and the U.S.A., 1940–1990.’’ Can-berra: Australian National University. Mimeo.
Freeman, Richard B., and Lawrence F. Katz. 1994. ‘‘Rising Wage Inequality. The United States Vs. Other Advanced Countries.’’ InWorking Under Different Rules, ed. Richard B. Freeman, 29–62. New York: Russell Sage Foundation.
Funkhouser, Edward. 1996. ‘‘How Much of Immigrant Wage Assimilation is Related to English Language Acquisition?’’ Santa Barbara: University of California. Mimeo. Green, Alan. G. 1995. ‘‘A Comparison of Canadian and U.S. Immigration Policy in the
Twentieth Century.’’ InDiminishing Returns: The Economics of Canada’s Recent Immi-gration Policy, ed. Don J. DeVoretz, 31–64. Toronto: C.D. Howe Institute.
Green, Alan G., and David A. Green. 1995. ‘‘Canadian Immigration Policy: The Effective-ness of the Point System and Other Instruments.’’Canadian Journal of Economics
28(4b):1006–41.
Gregory, Robert G., and Anne E. Daly. 1994. ‘‘Welfare and Economic Progress of Indige-nous Men of Australia and the U.S., 1980–1990.’’ Canberra: Australian National Univer-sity. Mimeo.
Kossoudji, Sherrie A. 1992. ‘‘Playing Cat and Mouse at the U.S.-Mexican Border.’’ Demog-raphy29(2):159–80.
Lack, John, and Jacqueline Templeton. 1995.Bold Experiment: A Documentary History of Australian Immigration Since 1945. Melbourne: Oxford University Press.
McDonald, James T., and Christopher Worswick. 1999. ‘‘The Earnings of Immigrant Men in Australia: Assimilation, Cohort Effects, and Macroeconomic Conditions.’’Economic Record75(228):49–62.
Miller, Paul and Leanne Neo. 2001. ‘‘Labor Market Flexibility and Immigrant Adjust-ment.’’ Perth: University of Western Australia. Mimeo.
Price, Charles. 1979. ‘‘Australia.’’ InThe Politics of Migration Policies, ed. Daniel Kubat, 3–18. New York: Center for Migration Studies.
Reimers, David M., and Harold Troper. 1992. ‘‘Canadian and American Immigration Pol-icy since 1945.’’ InImmigration, Language and Ethnic Issues: Canada and the United States, ed. Barry R. Chiswick, 15–54. Washington, D.C.: American Enterprise Institute. Reitz, Jeffrey G. 1998.Warmth of the Welcome: The Social Causes of Economic Success
for Immigrants in Different Nations and Cities. Boulder, Colo.: Westview Press. Statistics Canada, Housing, Family, and Social Statistics Division. 1990.Immigrants in
Canada: Selected Highlights. Ottawa: Canadian Government Printing Centre.
U.S. Department of Justice, Immigration and Naturalization Service. 1991.1990 Statistical Yearbook of the Immigration and Naturalization Service. Washington, D.C.: GPO. Vialet, Joyce C. 1989.Immigration: Numerical Limits and the Preference System.
Washing-ton, D.C.: Congressional Research Service.
Vialet, Joyce C. and Larry M. Eig. 1990.Immigration Act of 1990 (P.L. 101–649). Wash-ington, D.C.: Congressional Research Service.
Warren, Robert, and Jeffrey S. Passel. 1987. ‘‘A Count of the Uncountable: Estimates of Undocumented Aliens Counted in the 1980 United States Census.’’Demography24(3): 375–93.
Woodrow, Karen A., and Jeffrey S. Passel. 1990. ‘‘Post-IRCA Undocumented Immigration to the United States: An Assessment Based on the June 1988 CPS.’’ InUndocumented Migration to the United States: IRCA and the Experience of the 1980s, ed. Frank D. Bean, Barry Edmonston, and Jeffrey S. Passel, 33–72. Washington, D.C.: Urban Insti-tute Press.