Jurnal Administrasi Bisnis (JAB)| Vol. 2 No. 2 Februari 2015| administrasibisnis.studentjournal.ub.ac.id
1
THE IMPACT OF INFORMATION QUALITY AND SYSTEM QUALITY ON USER
SATISFACTION IN WEB-BASED INFORMATION SYSTEM
(Study on the Employees of Bank Rakyat Indonesia Malang)
Rechardilla Ardyanti Kumala Endang Siti Astuti, Kertahadi
Faculty Of Administrative Science, Brawijaya University, e-mail:[email protected]
Abstract
The aim in this research are to analyze and explain the influence of information and system quality on BRINETS user satisfaction partially and simultaneously in Bank Rakyat Indonesia Malang.
Research that is used to test the hypothesis is explanatory research that performed using quantitative method. Data collection is conducted using questionnaire, interview and documentation techniques. Variable that used in this research are Information Quality, System Quality and User Satisfaction. Data analysis is conducted using Descriptive and Inferencial Statistic Methods including Multiple Regression Analysis.
The result are that information quality has significant impact with user satisfaction. System Quality has significant impact with user satisfaction. Information quality and system quality has significant impact with user satisfaction.However, the user satisfaction that employees felt not too big because some of them found that BRINETS still not good. This is because many obstacles that occur in BRINETS. Generally, system and information quality of BRINETS is good enough but, some employees believe that it is not good even worse.
Keywords: web based information system, information quality, system quality, user satisfaction, BRINETS (BRI Integrated Network and Information System).
INTRODUCTION
In globalization era, technology development has contributed positively to the use of information system. Firms can engage in electronic commerce the use of the computer as a primary tool for performing the basic business operations. Firms engage in electronic commerce for variety of reason, but the overriding objective is competitive advantage.
Many people commonly use the terms internet and World Wide Web interchangeably. This is not really a problem but people should remember that the internet itself is the global communications network that connects millions of computers. It presence give positive impact in various sectors as a medium to get information universally.
“By information we mean data that have been shaped into a form that is meaningful and useful to
human beings.” (Laudon & Laudon, 2012:15). The
right use of information will increase the education of firms, so can improve the competitive advantage with good management that can make decision using the quality information. O’Brien & Marakas
(2011:4) define “Information system is combination
that organize by human, hardware, software, communication network, and data to collect,
transform, and disseminate the information in an
organization”. Good system is system that can provide performance and benefit for users. Fulfill the users need will give satisfaction for user information system and can motivated to doing the job optimally. User satisfaction generally determined by whether or not the users satisfaction are met. Firm needs to understand what the user need on information system that they used. User satisfaction of the system satisfaction related with system and information quality that generated by the information system.
System quality is quality from combination of hardware and software on information systems. Information quality in accordance with the needs and requires of the users will increase a level of satisfaction to the users.
Jurnal Administrasi Bisnis (JAB)| Vol. 2 No. 2 Februari 2015| administrasibisnis.studentjournal.ub.ac.id
2 customers, but also in banking technology. BRI has
attempted to implement the information technology system and communication with development of systems. The name of online technology is BRI Integrated Network and Information System (BRINETS). Problems that occur in BRI related with BRINETS are speed and system response on produce information that too long. Researcher will explain the system and information quality that produce from information system that has been applied could provided satisfaction to user. It can show that evaluation needed on success of the system. According to Delone and McCLean (2003),
“successes IS models could measured from multi
dimensional construct (such as system and information quality) that have a causal relationship, so that can estimated and predict the impact of IS
usage on individual and organizations”.
Based on the background, the problem formulations are:
1. Does the information quality and system quality can influence on BRINETS user satisfactions partially in PT. Bank Rakyat Indonesia (Persero), Tbk. Malang?
2. Does the information quality and system quality can influence on BRINETS user satisfactions simultaneously in PT. Bank Rakyat Indonesia (Persero), Tbk. Malang?
THEORYTICAL REVIEW
DeLone & McLean IS Success Model (2003) The basic theory in this research is using DeLone & McLean Is Success Model. DeLone & McLean created first IS Success model in 1992, but in this research used the updated D&M model in 2003. This is Success Model System Information from Delone and McClean (2003).
Picture 1 DeLone&McLean Is Success Model Source: Delone& McClean (2003)
According to the Delone & McClean models above, measure of success in applied an information system decided by 6 variables. The variables include information, system and service quality, intention to use (use), user satisfaction, and net benefits. Each variable that describe the success of information systems consistent with one or more of the six main dimensions from the model.
Web Based Information System
Internet creates a platform technology for running a new business, one of them to build a new type of production, services, strategy, and organization. The ability of the Internet known as the World Wide Web be the special attention from the manager and the organization.
Filipe & Cordeiro (2008:257) assume that “Web
information systems is computer application contruct using web technology”. Components of web-based
information system according to O'Brien & Marakas (2011:178) divided into three web browsers, servers, and hypermedia databases.
Based on the description, researcher conclude that the web-based information system refers to systems that use Internet web technology that is a web browser to accessible wherever and convey the information to the user.
Information Quality
According Jogiyanto (2007:15) argues that "information quality measure the output quality from
the information system”. Based on the explanation,
conclude is information quality as a measurement focused in output that produced by system, and value from the users output.
Sutabri (2012:41) explained that information quality depended on three things, there are:
a. Accurate
Information must free from mistakes and non misleading. Accurate means information have to clearly reflect the intention. Information have to accurate because it is usually from the source to the receiver of information may be occur the noise that can changes or destroy the information.
b. Timeliness
Information that comes on the recipient may not be too late. The information is outdated will not have value anymore because the information is a basic in the decision.
c. Relevance
Information has benefits for its user. Relevance of information for people with one another is different.
System Quality
Jurnal Administrasi Bisnis (JAB)| Vol. 2 No. 2 Februari 2015| administrasibisnis.studentjournal.ub.ac.id
3
technology itself”. Based on the opinions can conclude that system quality is the size of information system itself and focused in interaction between user and systems.
Nelson et.al., (2005:206) explained that system quality can be measure with five dimensionals, are: a. Reliability, measure the realibility of system that
operated.
b. Flexibility, system can adapt to a variety of user needs and the changing conditions
c. Integrated, system makes it easy to combine the data from various sources to support business decision making.
d. Accessibility, easy to access or generated the information from the system.
e. Time response, assuming a rapid response system or timely to requests for information.
User Satisfaction
According Jogiyanto (2007:23) "User satisfaction is the user's response to the output of usage of information systems". That is means that rise of satisfaction causes the system used to optimally utilized with direct interaction between the user and computer. The researchers who use this approach assume that user is satisfied will have better performance than the user was not satisfied with the information systems. Based on the opinion above, conclude is user satisfaction related to response or user attitude with system interactions and usage of output, so it can be used optimally.
Satisfaction measurements that used in this research uses research from Somers et.al., (2005:597) reveals that "there are five dimensions of user satisfaction measurement, are: the content, accuracy, format, timeliness, and easy to use".
Relationship Between Information Quality and System Quality with User Satisfaction
Investation of information systems have benefit, to know the usage of information system can not be random. This is needs the measurement to determine information systems effectiveness. Measurements aimed to obtain information procurement success an information system facilities. An information system that can meet the needs of users will improve the user satisfaction. This is manifested by the tendency of increased use of the information system.
Conversely, if the system can not meet the information needs of users then the user satisfaction will not increase and further use will be avoided. This satisfaction relating to systems and information quality that produced by the information system.
Both information and system quality are assumed have a relationship with the user satisfaction. Better of system and information quality generated cause the user satisfaction of information systems will also increase.
Reliable information system if it has a good system and information quality and able to give satisfaction to the users. The failure of an information system may be due to the inability of an information systems meet the user expectations. System quality shows the size of the information systems that used. The good system quality will provide satisfaction for the user because it can help doing the job quickly. The results of research from DeLone & McLean (2003), shown that the system quality has a positive relationship to its user satisfaction.
Information quality indicates the measurement of information systems output. The higher the information quality that produced by an information system will further improve the user satisfaction.
Concept Model
Picture 2 Concept Model
From the picture above, can explained that information quality and system quality can influence user satisfaction of information systems. If the information and system quality have been properly fulfilled, it will give satisfaction for user of information system.
Hypothesis Model
Based on the background and theories that have been described, the formulation of the hypothesis in this research are as follows:
H1: There is a positive relationship between the information quality (X1) with user satisfaction (Y).
H2: There is a positive relationship between the systems quality(X2) with the user satisfaction (Y).
H3: There is a positive relationship among information quality (X1) and system quality (X2) with user satisfaction (Y) simultaneously.
Information Quality
System Quality
Jurnal Administrasi Bisnis (JAB)| Vol. 2 No. 2 Februari 2015| administrasibisnis.studentjournal.ub.ac.id
4 Research Methods
Research that is used to test the hypothesis is explanatory research that performed using quantitative. As said by Singarimbun and Effendi(2006:5) "Explanatory research or explanation research is a research that explained the causal relationship between the variables using hypothesis testing".
According Sarjono and Julianita (2011: 21) "The population is all the characteristics that the research object, which is related to the characteristics of the entire group of people, events, or objects that are the center of attention for researchers". Based on the statement above, the population in this research are 108 employees in the Branch Office of PT Bank Rakyat Indonesia (Persero),Tbk. Malang that use BRINETS (BRI Integrated Network and Information System).
“Sample is subset of population, consist of several member of population. This subset is taken because in many cases may impossible to select the entire population, therefore we formed a
representative of population that called sample.”
(Ferdinand, 2006)
In this research, due to time constraints, not all the population can be used in sample. Based on this reasons, the sample that researcher selected is 52 employees from population in the Branch Office of PT Bank Rakyat Indonesia (Persero) Tbk. Malang. The formula that used to determine the amount of sample is Slovin formula:
n = + NeN ²
n : sample N : Population
e : percentage leeway carefully situations due to lack of sampling error that can be tolerated (10%).
Source: Prasetyo & Lina (2008:137)
� = + 8 ,8 2
� = + 8 ,8
� = + , 88
� = , 88
n = 51,923076923077
From 108 people as population, with 10% critical limit (e) the number of sample to be taken are 52 respondents.
Data Collection Techniques
Data collection techniques in this research using three ways, there are:
a. Questionnaire Distribution
Data collection techniques done by providing a written statement to the respondent to be answered. The contents of the questionnaire are a statement relating to the system and information quality with user satisfaction of information system.
b. Interview
Data collection techniques by conduct a direct question and answer to the object of research concern the problem in research to support the questionnaire.
c. Noted Documentation
The data collection technique is done by the record the documents and other data that can support the research.
Data Analysis Methods
a. Descriptive Statistic Analysis
This analysis used to describe the results of the research by describing the research object consisting of circumstances respondents surveyed, and the distribution of items of each variable. The data will collect with questionnaires in the form of a statement with answer choices that have been determined, the next activity is processing and tabulating the data into a frequency table and then discusses the processed data descriptively.
b. Inferencial Statistic Analysis
CLASSIC ASSUMPTION TEST
1. Normality Test
Aims to test whether the regression model, the dependent variable, independent variables, or both have a normal distribution or not. Regression models are distributed either normal or near normal. (Sarjono and Julianita, 2011:90). Basis for decision making is as follows:
a) If the data is spread around the diagonal line and follow the direction of the diagonal line, then the regression model to meet normality.
b) If the data is spread away from the diagonal line and not follow the direction of the diagonal line, then the regression model did not meet normality.
2. Multicollinearity test
Jurnal Administrasi Bisnis (JAB)| Vol. 2 No. 2 Februari 2015| administrasibisnis.studentjournal.ub.ac.id
5 the tolerance values> 0.10 or if VIF <10 Sarjono and
Jualianita (2011: 91).
3. Heteroscedasticity Test
Heteroscedasticity test aims to test whether there is inequality in the regression model residual variance from one observation to the other observations. In this research using a scatter plot graph between the predicted value of the dependent variable (ZPRED) with residual (SRESID). If there are points that form a certain pattern as regular as bumpy, widened, then narrowed it had happened heteroscedasticity. If the points spread above and below the 0 on the Y axis without forming a specific pattern then there is no heteroscedasticity (Sarjono and Jualianita, 2011:105).
MULTIPLE LINIER REGRESSION
This type of research views of the relationship between variables so that the association is an analytical tool used multiple linear regression. Multiple linear regression analysis was performed to measure the strength of the relationship between two or more independent variables on the dependent variable (Sarjono and Jualianita, 2011:110). The formula used in the multiple regression analysis method is as follows:
�= � + � � + � � + � � + …+ �� ��
: dependent variable
� , � , � , � , �� : Koefeisien regression � , � , � , �� : independent variable Source: Uyanto S. (2009:243)
HYPOTHESIS PARTIAL TESTING (T-test)
T-test basically shows how far the influence of the independent variables in explaining the variation individually dependent variable (Sarjono and
Jualianita, 2011:111). This test aims to test the effect of independent variables on the dependent variable (user satisfaction) separately or partial.
Formula:
t = b SEb Description:
b: estimator for β
SEb: standart error of β Source: Sarjono and Jualianita (2011:111)
HYPOTHESIS SIMULTAN TESTING (F-test) Hypothesis simultan test is used to determine the effect of independent variables simultaneously (together) on the dependent variable. Formula that use in this research is:
F = SSE SSR⁄k n − k − ⁄
Source: Sarjono and Jualianita (2011:115) Descriptions:
SSR : regression sum of square K : degrees of freedom SSE : error sum of square n-k-1 : degrees of freedom
RESULT AND DISCUSSION
Based on the results of research conducted by questionnaires to respondents, taking a sample of 52 employees of PT. Bank Rakyat Indonesia (Persero), Tbk Kawi Malang, it can be an overview the characteristics of the respondents surveyed as follows:
1. Gender of Respondents
Characteristics of respondents (employees) by gender, shown in the following table:
Table 11 Overview of Respondents' Gender
Frequency Percent Valid Percent
Cumulative Percent
Valid
Male 29 55.8 55.8 55.8
Female 23 44.2 44.2 100.0
Total 52 100.0 100.0
Source: primary data processed
Based on the table, it can be seen that the total of male respondents are 29 people (55,8%) and female respondents totaled 23 people (44,2%). This is indicates that most of the gender employees who use the system BRINETS is male.
2. Age of Respondents
Jurnal Administrasi Bisnis (JAB)| Vol. 2 No. 2 Februari 2015| administrasibisnis.studentjournal.ub.ac.id
6 Table 2 Overview of Respondents' Age
F Percent
Valid Percent
Cumulative Percent
Va lid
<26 11 21.2 21.2 21.2
26-28 12 23.1 23.1 44.2
29-31 7 13.5 13.5 57.7 32-34 11 21.2 21.2 78.8
35-37 7 13.5 13.5 92.3
38-40 3 5.8 5.8 98.1 >40 1 1.9 1.9 100
Total 52 100.0 100.0
Source: primary data processed
Based on the table, indicates that most of the employees who use the system BRINETS aged between 26-28 years.
3. Respondent Education levels
Characteristics of respondents by level of education can be seen from the table:
Table 3 Overview of Respondents' Education Level
F Percent
Valid Percent
Cumulative Percent
Valid D3 1 1.9 1.9 1.9
S1 50 96.2 96.2 98.1
S2 1 1.9 1.9 100.0
To
tal 52 100.0 100.0
Source: primary data processed
Based on the table, shown that most of the recent education of employees who use the system BRINETS is S1
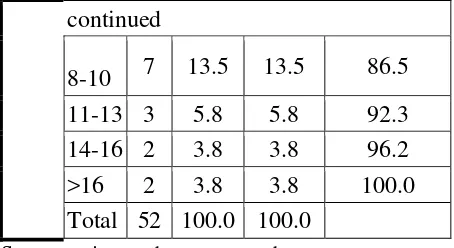
4. Working Period of Respondents
Characteristics of respondents based on working period can be seen:
Table 4 Overview of Respondents' Working Period
F
Percen t
Valid Percent
Cumulative Percent
Valid <2 3 5.8 5.8 5.8 2-4 18 34.6 34.6 40.4
5-7 17 32.7 32.7 73.1
continued
8-10 7 13.5 13.5 86.5
11-13 3 5.8 5.8 92.3
14-16 2 3.8 3.8 96.2 >16 2 3.8 3.8 100.0
Total 52 100.0 100.0
Source: primary data processed
Based on the table, shown that most of the employees who use the system BRINETS been working for 2-4 years.
5. Respondents Job Department
Characteristics of respondents based on the work can be seen from the table:
Table 6 Overview of Respondents' Job Department
F Percent
Valid Percent
Cumulative Percent
Valid DM 1 1.9 1.9 1.9
AO 16 30.8 30.8 32.7
ADK 4 7.7 7.7 40.4
ADM 6 11.5 11.5 51.9
LOG 2 3.8 3.8 55.8
IT 1 1.9 1.9 57.7
PAU 3 5.8 5.8 63.5
TELL
ER 12 23.1 23.1 86.5
CS 7 13.5 13.5 100.0
Total 52 100.0 100.0
Source: primary data processed
Based on the table, indicates that most of the employees who use the system BRINETS is the Account Officer (AO)
Methods of Data Analysis
DESCRIPTIVE STATISTIC ANALYSIS
Jurnal Administrasi Bisnis (JAB)| Vol. 2 No. 2 Februari 2015| administrasibisnis.studentjournal.ub.ac.id
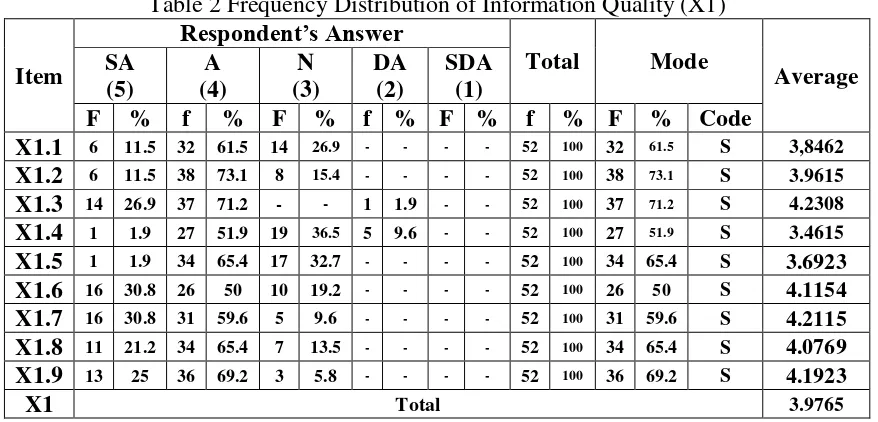
7 Information Quality (X1)
There are nine statements presented to the respondents about the information quality (X1).
Based on the statement obtained nine answers were seen in the table:
Table 2 Frequency Distribution of Information Quality (X1)
Item
Respondent’s Answer
Total Mode
Average SA
(5)
A (4)
N (3)
DA (2)
SDA (1)
F % f % F % f % F % f % F % Code
X1.1 6 11.5 32 61.5 14 26.9 - - - - 52 100 32 61.5 S 3,8462
X1.2 6 11.5 38 73.1 8 15.4 - - - - 52 100 38 73.1 S 3.9615
X1.3 14 26.9 37 71.2 - - 1 1.9 - - 52 100 37 71.2 S 4.2308 X1.4 1 1.9 27 51.9 19 36.5 5 9.6 - - 52 100 27 51.9 S 3.4615
X1.5 1 1.9 34 65.4 17 32.7 - - - - 52 100 34 65.4 S 3.6923
X1.6 16 30.8 26 50 10 19.2 - - - - 52 100 26 50 S 4.1154
X1.7 16 30.8 31 59.6 5 9.6 - - - - 52 100 31 59.6 S 4.2115
X1.8 11 21.2 34 65.4 7 13.5 - - - - 52 100 34 65.4 S 4.0769
X1.9 13 25 36 69.2 3 5.8 - - - - 52 100 36 69.2 S 4.1923
X1 Total 3.9765
Source: Primary Data Processed
Description:
X1.1 : Information that generated by BRINETS systems free from error.
X1.2 : Information that generated by BRINETS systems not cause doubt.
X1.3 : Information that generated by BRINETS systems have good completeness as required. X1.4 : Information that generated by BRINETS
systems is never too late.
X1.5 : Information that generated by BRINETS systems is never outdated.
X1.6 : Information that generated by BRINETS systems precise for user need.
X1.7 : Information that generated by BRINETS systems is useful for user.
X1.8 : Information that received are precise and right to help make decisions.
X1.9 : Information that generated by BRINETS systems has several choices.
The results of the information quality (X1) frequency distribution obtained from the largest number of frequencies of each item, amounting to nine items. In addition, based on the amount of the total average value of all the items with 3.8986 has shown that the information quality on BRI Integrated Network and Information System (BRINETS) contained in the Office of PT. Bank Rakyat Indonesia (Persero), Tbk Kawi Malang is not good enough. It means that many employees belief that information quality in BRINETS system have many lack like cause doubt, not free from error and have ploblem in timeliness (outdate information and slow response).
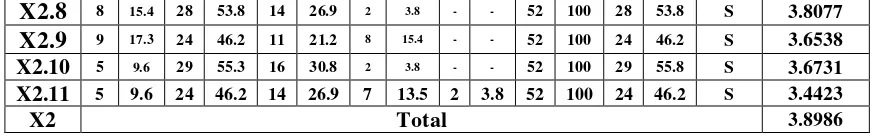
System Quality (X2)
There are eleven statements filed with the respondents about the system quality (X2). Based on the statement obtained the answer seen in the table:
Table 8 Distribution Frequency Quality System (X2)
Item
Respondent’s Answer
Total Mode
Average SA
(5)
A (4)
N (3)
DA (2)
SDA (1)
F % f % f % F % f % F % F % Code
X2.1 8 15.4 40 76.9 4 7.7 - - - - 52 100 40 76.9 S 4.0769
X2.2 8 15.4 34 65.4 10 19.2 - - - - 52 100 34 65.4 S 3.9615
X2.3 5 9.6 29 55.8 18 34.6 - - - - 52 100 29 55.8 S 3.75
X2.4 6 11.5 35 67.3 11 21.2 - - - - 52 100 35 67.3 S 3.9038
X2.5 10 19.2 32 61.5 10 19.2 - - - - 52 100 32 61.5 S 4.0
X2.6 21 40.4 29 55.8 2 3.8 - - - - 52 100 29 55.8 S 4.3654
Jurnal Administrasi Bisnis (JAB)| Vol. 2 No. 2 Februari 2015| administrasibisnis.studentjournal.ub.ac.id
8 Continued
X2.8 8 15.4 28 53.8 14 26.9 2 3.8 - - 52 100 28 53.8 S 3.8077
X2.9 9 17.3 24 46.2 11 21.2 8 15.4 - - 52 100 24 46.2 S 3.6538
X2.10 5 9.6 29 55.3 16 30.8 2 3.8 - - 52 100 29 55.8 S 3.6731
X2.11 5 9.6 24 46.2 14 26.9 7 13.5 2 3.8 52 100 24 46.2 S 3.4423
X2 Total 3.8986
Source: Primary Data Processed Description:
X2.1 : BRINETS systems can be trusted when operated.
X2.2 : BRINETS systems easily identified when an error occurs.
X2.3 : BRINETS systems easily corrected if an error occurs.
X2.4 : BRINETS systems easily adaptable to meet various user needs changing.
X2.5 : BRINETS systems can be adapted to the new conditions or demand.
X2.6 : BRINETS systems as medium of data connecting from different areas.
X2.7 : BRINETS systems as medium of information connecting from different areas.
X2.8 : BRINETS systems can be accessed easily. X2.9 : BRINETS systems can be accessed any time. X2.10 : BRINETS systems able to provide a very rapid response system.
X2.11 : BRINETS systems has never been barier.
The results of the frequency distribution of the quality system (X2) is obtained from the largest
number of frequencies of each item, amounting to eleven items. In addition, based on the amount of the total average value of all the items with 3,8986 shown that the quality of web-based information system with BRI Integrated Network And Information System (BRINETS) contained in the Office of PT. Bank Rakyat Indonesia (Persero) Tbk. Kawi Malang is not good enough. It caused many employees belief that quality system in BRINETS have many problem such as, difficult to identified and correct the errors, adaptaded in eser needs changing, complicated of use system, have barier in speed (time access and response system).
User Satisfaction (Y)
There are thirteen statements posed to respondents regarding user satisfaction variable (Y). Based on these thirteen statements obtained are
shown in the table answer
Table 9 Distribution Frequency of User Satisfaction (Y)
Item
Respondent’s Answer
Total Mode
Average SA
(5)
A (4)
N (3)
DA (2)
SDA (1)
f % f % F % F % F % F % f % Code
Y1 11 21.2 36 69.2 5 9.6 - - - - 52 100 36 69.2 S 4.1154
Y2 9 17.3 38 73.1 5 9.6 - - - - 52 100 38 73.1 S 4.0769
Y3 3 5.8 47 90.4 2 3.8 - - - - 52 100 47 90.4 S 4.0192
Y4 2 3.8 38 73.1 12 23.1 - - - - 52 100 38 73.1 S 3.8077
Y5 5 9.6 37 71. 2 10
19.
2 - - - - 52 100 37 71.2 S 3.9038 Y6 6 11.5 38 73.
1 8 15.
4 - - - - 52 100 38 73.1 S 3.9615
Y7 2 3.8 39 75 11 21.2 - - - - 52 100 39 75 S 3.8269
Y8 1 1.9 43 82. 7 8
15.
4 - - - - 52 100 43 82.7 S 3.8654 Y9 4 7.7 42 80.
8 6 11.
5 - - - - 52 100 42 80.8 S 3.9615 Y10 1 1.9 36 69.2 15 28.8 - - - - 52 100 36 69.2 S 3.7308
Y11 2 3.8 31 59. 6 18
34.
6 1 1.9 - - 52 100 31 59.6 S 3.6538
Y12 2 3.8 39 75 11 21.2 - - - - 52 100 39 75 S 3.8269
Y13 1 1.9 41 78. 8 10
19.
2 52 100 41 78.8 S 3.8269
Jurnal Administrasi Bisnis (JAB)| Vol. 2 No. 2 Februari 2015| administrasibisnis.studentjournal.ub.ac.id
9 Source: Primary Data Processed
Description:
Y1 : BRINETS systems provide the precise information for user need.
Y2 : The information content of the BRINETS system meet user needs.
Y3 : BRINETS system provides the information that can be understand.
Y4 : BRINETS system provides complete information.
Y5 : BRINETS system is accurate.
Y6 : Satisfied with the accuracy of the BRINETS system.
Y7 : The output of the BRINETS system is presented in a useful format.
Y8 : BRINETS system information is clear. Y9 : Get the information that needed from the
BRINETS system at a suitable time. Y10 : BRINETS system provides up-to-date information.
Y11 : Sure that BRINETS system is easy to use. Y12 : Satisfied with the BRINETS system because
easy to do information retrieval.
Y13 : Satisfied with BRINETS system can be used by specified users to achieve specified goals with effectiveness and efficiency in a specified context of use.
The results of the frequency distribution of user satisfaction (Y) is obtained from the largest number of frequencies of each item, amounting to thirteen items. In addition, based on the amount of the average value of all the items with 3.8905 shown that
user satisfaction on the web-based information BRI Integrated Network And Information System (BRINETS) contained in the branch office of PT. Bank Rakyat Indonesia (Persero), Tbk Kawi Malang not satisfy enough for the users. It caused many lack in BRINETS use to do their job activities including
about complete and accuration of information, complicated in using system, system response, not effective and efficient used in specified content by specified user.
INFERENCIAL STATISTIC ANALYSIS In this research used several tests, there are: 1. Test Results Classical Assumptions
In the use of multiple linear regression analysis, some important things that need to be done to test the assumptions of classical or test requirements of multiple regression analysis so that the regression line equation obtained can actually be used to predict the dependent variable. Classical assumption that needs to be done using multiple linear regression analysis as a means of testing the normality, multicollinearity, and heteroscedasticity.
Normality Test
Figure 3 Graphic of Normality
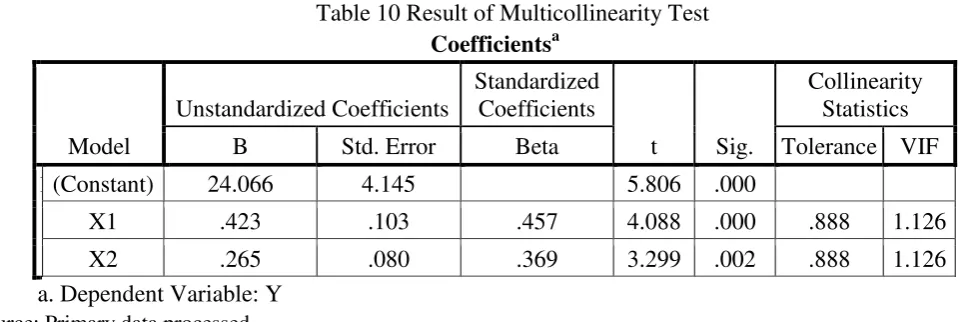
Multicollinearity Test
The following will be presented multicollinearity test results performed using SPSS for windows, the full results can be seen in table:
Table 10 Result of Multicollinearity Test Coefficientsa
Model
Unstandardized Coefficients
Standardized Coefficients
t Sig.
Collinearity Statistics
B Std. Error Beta Tolerance VIF
1 (Constant) 24.066 4.145 5.806 .000
X1 .423 .103 .457 4.088 .000 .888 1.126
X2 .265 .080 .369 3.299 .002 .888 1.126
a. Dependent Variable: Y
Jurnal Administrasi Bisnis (JAB)| Vol. 2 No. 2 Februari 2015| administrasibisnis.studentjournal.ub.ac.id
10 Based on the test results it can be seen that the
tolerance value of each independent variable ranged between 0-1 and VIF value of each independent
variable ≥ 1 From these results it can be concluded
that the regression model used does not happen multicollinearity.
Heteroscedasticity test
Heteroscedasticity test results can be presented in the following graph:
Figure 4 Graphic of Heteroscedasticity
In the scatterplot above can be seen that there are points on the graph does not spread and form a specific pattern so it can be concluded that the residuals have constant variance (homoscedasticity) or absence of heteroscedasticity.
Multiple Regression Analysis
Table 11 Model Summary of Multiple Regression Analysis
Model Summaryb
Mo del R
R Square
Adjusted R Square
Std. Error of
the Estimate
Durbin -Watson
1 .676a .457 .435 2.63093 1.758 a. Predictors: (Constant), X2, X1
b. Dependent Variable: Y
Source: Primary data processed
Based on the model of summary table through multiple linear analysis above, we mentioned that the value of the correlation coefficient R=0.676, which means greater than 0, thus it can be stated the influence of X1 and X2 on Y.
Table 12 Coefficient of Multiple Regression Analysis Coefficientsa
Model
Unstandardized Coefficients
Standardized Coefficients
T Sig.
Collinearity Statistics
B Std. Error Beta Tolerance VIF
1 (Constant) 24.066 4.145 5.806 .000
X1 .423 .103 .457 4.088 .000 .888 1.126
X2 .265 .080 .369 3.299 .002 .888 1.126
a. Dependent Variable: Y
Source: Primary data processed
Based on the results of multiple linear regression analysis of each variable quality of information (X1)
and system quality (X2), the results indicate that the independent variables X1 and X2 significantly affect the dependent variable Y.
Hypothesis Partial Testing (T-test)
Table 13 Result of Hypothesis Partial
Independent Variable
Significancy
Value of Coefficient t
Count Table
Information
Quality (X1) 0,000 4,088 0,688
(α = 5%) System
Jurnal Administrasi Bisnis (JAB)| Vol. 2 No. 2 Februari 2015| administrasibisnis.studentjournal.ub.ac.id
11 Dependent Variable: User Satisfaction
Source: Secondary data processed
Table of T-test result has shown that:
a. In the variable quality of information, from the results of partial calculations indicate that value of t = 4,088 > ttable = 0,688 or Sig.t value = 0,000 < 0,05 then partially no significant relationship between the quality of information on user satisfaction BRINETS system. b. In the variable quality of the system,
from the results of partial calculations indicate that value of t = 3,299 > ttable = 0,688 or Sig.t value = 0,002 < 0,05 then partially no significant effect of system quality on user satisfaction BRINETS system.
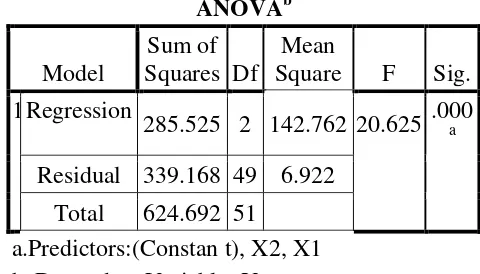
Hypothesis Simultan Testing (F-test)
Table 14 Result of Hypothesis Simultan Testing (F-test)
Source: Primary data processed
Based on the data above ANOVA can be seen from the results of simultaneous calculations indicate that value of F = 20,625, while the results of a calculation of the value of F table = 3,186 (df = 49
and α = 0,05). Because of F = 20,625 > F = 3,186
and sig. F = 0,000 < 0,05 so it can be concluded that there are significant independent variables (X1 and X2) simultaneously (together) on the dependent variable (Y).
Discussions
Influence of information quality on BRINETS user satisfaction in PT Bank Rakyat Indonesia (Persero) Tbk. Malang.
Based on the research method that is done, the researchers stated that information quality partially influence on user satisfaction. The higher value of information quality used, the user satisfaction will increase, whereas if information quality low then, user satisfaction will decrease.
Influence of system quality on BRINETS user satisfaction in PT Bank Rakyat Indonesia (Persero) Tbk. Malang.
Based on the research method that is done, the researchers stated that the system quality partially influence on user satisfaction. The higher the system quality used, user satisfaction will increase.
Whereas, if the system quality is low user satisfaction will decrease.
Influence of information quality and system quality on BRINETS user satisfaction
simultaneously in PT Bank Rakyat Indonesia (Persero) Tbk. Malang.
Based on the research methods, researchers stated that there are significant influenced information quality and system quality simultaneously (together) on User Satisfaction. The higher of information quality and systems quality, user satisfaction will increase, whereas if information quality and system quality is low then user satisfaction will decrease.
From the results of tests performed can be concluded that the two hypotheses proposed in this study are correct. Both information quality and system quality variables have a positive influence on user satisfaction BRINETS system. The company must pay attention to the ability of the system chosen to support all activities in banking. Although the
results of the study showed that there is a positive correlation between the independent variables and the dependent variable, but it proven less powerful. Based on this, it is necessary to take into account improvements in the quality of systems and information.
Regardless of the final outcome of the research, the quality of the system is also important in contributing to the company to support operations and utilize existing information that will optimize the user satisfaction precisely that will eventually be used as a basis for judgment in managerial decision making and strategic. It can be used as a reference in selecting an information system in accordance with the company that is expected to improve performance and give satisfaction to the users of the system. Attention also needs in quality system to be balanced by an increase in the quality of human resources so that they can understand and use the
ANOVAb
Model
Sum of Squares Df
Mean
Square F Sig.
1 Regression
285.525 2 142.762 20.625 .000a
Residual 339.168 49 6.922
Jurnal Administrasi Bisnis (JAB)| Vol. 2 No. 2 Februari 2015| administrasibisnis.studentjournal.ub.ac.id
12 existing system well and can indirectly have a
positive influence on the company.
CONCLUSIONS AND SUGGESTIONS Conclusions
The conclusion of this study, namely:
1. Based on the research, there are has significant impact simultanly and parcially between information quality and system quality on user satisfaction at Bank Rakyat Indonesia Kawi Malang. However, the user satisfaction that employees felt not too big because some of them found the system and information quality on BRINETS system still not good enough.
2. System quality in BRINETS system has not good enough. It is basically have a significant impact on user satisfaction but, not too dominant in comparison to the information quality. In addition, generally some employees believe that system quality is not good even worse.
3. Information quality in BRINETS has not good enough. It is a dominant variable but, the results showed that the effect is less strong. In addition, some employees found lack of information quality caused by a problem that occurs.
Suggestions
Based on the conclusion of the study, the researchers propose some suggestions are as follows: 1. Based on the results of questionnaires on the users BRINETS system in Branch Office Kawi Malang, information quality and system quality is not good enough. However, the opinion of some employees who indicate that the information and system quality are not good even worse can be a reference for Bank Rakyat Indonesia to develop the BRINETS system so that the system can be better and user satisfaction can be increase.
2. Based on the test results through the deployment of questionnaire, generally the system quality is not good enough and the use of the system is still too complicated for the users and any problems occur. Needed develop and improve the BRINETS system in the future especially for network or internet used (eg. add bandwitch, etc.) so that the error rate can be minimized and operasional activity not hampered because of frequent offline and did not experience significant obstacles.
REFFERENCES
DeLone, William H. & Ephraim R. McClean. 2003. The DeLone and McLean Model of Information Systems Success: A Ten-Year Update. Sharpe, Inc. Vol. 9 No. 4.
Ferdinand, A. 2006. Structural Equation Modeling Dalam Penelitian Manajemen.Semarang: Balai Penerbit Universitas Diponegoro.
Filipe, J. and Cordeiro, J. 2011. Web Information Systems and Technologies. New York: Springer
Jogiyanto, H.M. 2007. Model Kesuksesan Sistem Teknologi Informasi. Yogyakarta: Andi.
Laudon, Kenneth C & Jane P. Laudon. 2012. Management Information System: Managing The Digital Firm. 12thed. New Jersey: Prentice Hall.
Nelson, R. R., Todd, P. A., and Wixom, B. H. 2005. Antecedents of Information and System Quality: An Empirical ExaminationWithin the Context of Data Warehousing. Management Information Systems, 21(4): 199-235.
O’Brien, J. A and Marakas, G. M. 2011. Management Information Systems.10th ed. New York: McGraw-Hill.
Prasetyo, Bambang & Lina M.J. 2008. Metode Penelitian Kuantitatif: Teori Dan Aplikasi. Jakarta: Rajawali Pers
Sarjono, Haryadi & Winda Julianita. 2011. SPSS vs LISREL: Sebuah Pengantar, Aplikasi untuk Riset. Jakarta: Salemba Empat.
Singarimbun, M. dan Effendi, S. 2006. Metode Penelitian Survai. Edisi Revisi. Jakarta: PT. Pustaka LP3ES.
Somers, T.M., Nelson, K., and Karimi, J. 2005. Confirmatory Factor Analysis of the End-User Computing Satisfaction Instrument: Replication within an ERP Domain. Decision Science, 34(3): 595-621.
Sutabri, Tata. 2012. KonsepSistemInformasi.
Yogyakarta: ANDI.