5 CHAPTER 2
LITERATURE REVIEW AND THEORETICAL BACKGROUND
2.1. Literature Review
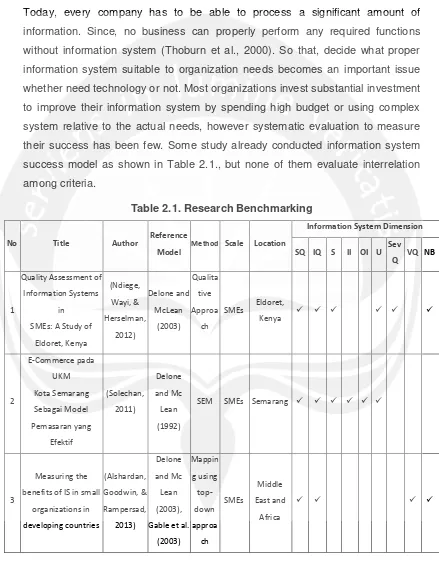
Today, every company has to be able to process a significant amount of information. Since, no business can properly perform any required functions without information system (Thoburn et al., 2000). So that, decide what proper information system suitable to organization needs becomes an important issue whether need technology or not. Most organizations invest substantial investment to improve their information system by spending high budget or using complex system relative to the actual needs, however systematic evaluation to measure their success has been few. Some study already conducted information system
benefits of IS in small
6
Note: SQ:System Quality; IQ:Information Quality; II:Individual Impact; OI:Organizational
Impact; S:Satisfaction; U:Use; SevQ:Service Quality; NB: Net Benefit; VQ:Vendor Quality
7
Ballantine et al. (1996) identified that there is a myopic focus for implementing the information system on finance. It means that general factors that influence the success of an organization cannot be directly used, but it requires an evaluation of organization needs.
Information technology is a tool to process and organize data becomes information. Most enterprises invest technology to improve their business by purchasing particular software without properly measure what the actual necessary is. In fact, most level of information technology success is quite far from satisfactory claimed by academic literature frequently with adoption (Caldeira et al., 2012).
To support the improvement of technology access for Small Scale Medium Enterprises (SMEs), Sinaga et al. (2015) had done early research regarding the adoption of Gable’s model which adopted Delone and McLean model to construct new information system model suited to SMEs. Their findings for information success model were using ISM (Interpretive Structural Modeling). The model only identified which factors that either affect or are affected the organizational impact and its factors, but how the factors effectively interplay each other in SMEs has not been discussed.
8
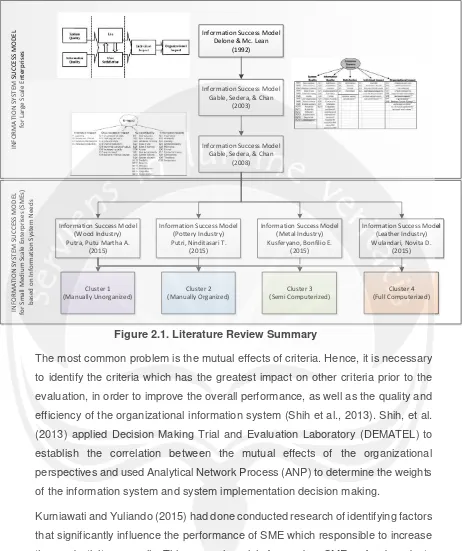
The most common problem is the mutual effects of criteria. Hence, it is necessary to identify the criteria which has the greatest impact on other criteria prior to the evaluation, in order to improve the overall performance, as well as the quality and efficiency of the organizational information system (Shih et al., 2013). Shih, et al. (2013) applied Decision Making Trial and Evaluation Laboratory (DEMATEL) to establish the correlation between the mutual effects of the organizational perspectives and used Analytical Network Process (ANP) to determine the weights of the information system and system implementation decision making.
9
that enable SMEs to enhance their competitiveness as well. The most critical factor of the SME performance is human resource as well as the result.
The difference among this study and some previous researches is, this study aims to evaluate and measure specifically the interrelation of information system success model in Cluster 2 of SMEs at Yogyakarta among the influence factors and decide whether they need technology improvement or not. The scope covered in this study is SMEs which manually organize information system at Yogyakarta province.
2.2. Basic Theory
2.2.1. Information System
In 2009, Effy Oz defines what information system is:
“The terms ‘data’ and ‘information’ do not mean the same thing. The word data is derived from the Latin datum, literally a given or fact, which might take
the form of a number, a statement, or a picture. Data is the raw material in
the production of information. Information, on the other hand, is facts or
conclusions that have meaning within a context. Raw data is rarely
meaningful or useful as information. To become information, data is
manipulated through tabulation, statistical analysis, or any other operation
that leads to greater understanding of a situation.
Simply put, a system is an array of components that work together to achieve
a common goal, or multiple goals, by accepting input, processing it, and
producing output in an organized manner.
With an understanding of the terms “information” and “system,” the definition of an information system is almost intuitive: an information system (IS)
consists of all the components that work together to process data and
produce information. Almost all business information systems consist of
many subsystems with sub-goals, all contributing to the organization’s main
goal.”
10
That is why the way how to find interrelation among the components which affect information system becomes an important issue. Moreover the components should be suitable to the organization needs to find the correct interrelation.
2.2.2. Information Success Model
a. Delone and Mc Lean Information System Success Model
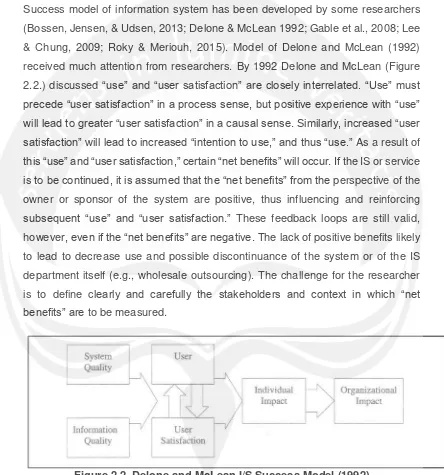
Success model of information system has been developed by some researchers (Bossen, Jensen, & Udsen, 2013; Delone & McLean 1992; Gable et al., 2008; Lee & Chung, 2009; Roky & Meriouh, 2015). Model of Delone and McLean (1992) received much attention from researchers. By 1992 Delone and McLean (Figure 2.2.) discussed “use” and “user satisfaction” are closely interrelated. “Use” must precede “user satisfaction” in a processsense, but positive experience with “use” will lead to greater “user satisfaction” in a causal sense. Similarly, increased “user satisfaction” will lead to increased “intentionto use,” and thus “use.” As a result of this “use” and “user satisfaction,” certain “net benefits” will occur. If the IS or service is to be continued, it is assumed that the “net benefits” from the perspective of the owner or sponsor of the system are positive, thus influencing and reinforcing subsequent “use” and “user satisfaction.” These feedback loops are still valid, however, even if the “net benefits” are negative. The lack of positive benefits likely to lead to decrease use and possible discontinuance of the system or of the IS department itself (e.g., wholesale outsourcing). The challenge for the researcher is to define clearly and carefully the stakeholders and context in which “net benefits” are to be measured.
Figure 2.2. Delone and McLean I/S Success Model (1992)
11
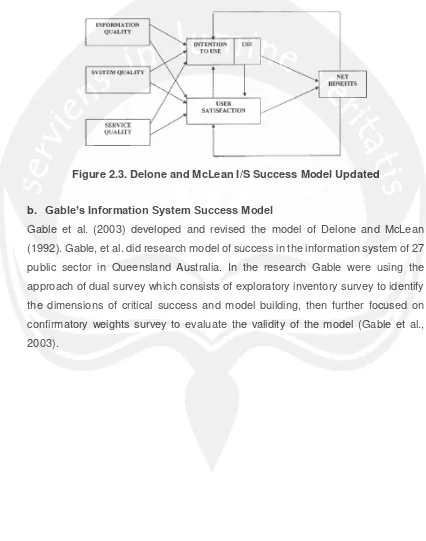
study. For example, in one instance a high-quality system will be associated with more use, more user satisfaction, and positive net benefits. The proposed associations would then all be positive. In another circumstance, more use of a poor quality system would be associated with more dissatisfaction and negative net benefits. The proposed associations would then be negative as shown in Figure 2.3. (Delone & McLean, 1992).
Figure 2.3. Delone and McLean I/S Success Model Updated
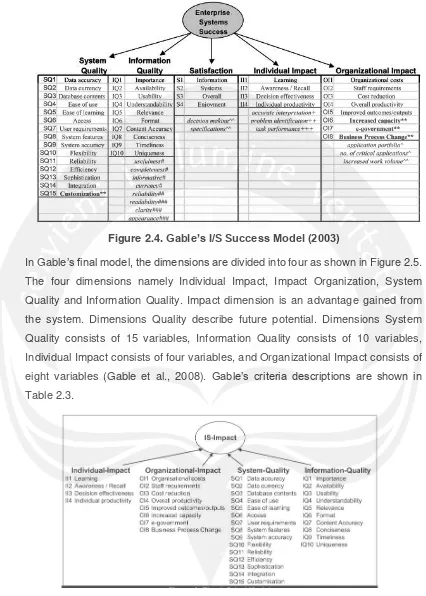
b. Gable’s Information System Success Model
12
Figure 2.4. Gable’s I/S Success Model (2003)
In Gable’s final model, the dimensions are divided into four as shown in Figure 2.5. The four dimensions namely Individual Impact, Impact Organization, System Quality and Information Quality. Impact dimension is an advantage gained from the system. Dimensions Quality describe future potential. Dimensions System Quality consists of 15 variables, Information Quality consists of 10 variables, Individual Impact consists of four variables, and Organizational Impact consists of eight variables (Gable et al., 2008). Gable’s criteria descriptions are shown in Table 2.3.
13
Table 2.3. Information System Success Criteria Definition
Criteria Definition
System-Quality of the [the IS] is a multifaceted construct designed to capture how the system performs from a technical and design perspective.
SQ1 Data Accuracy Data from [the IS] often needs correction SQ2 Data Currency Data from [the IS] is current enough SQ3 Database Contents [the IS] is missing key data
SQ4 Ease of Use [the IS] is easy to use SQ5 Ease of Learning [the IS] is easy to learn
SQ6 Access It is often difficult to get access to information that is in [the IS]
SQ7 User
Requirements
[the IS] meets [the Unit’s] requirements
SQ8 System Features [the IS] includes necessary features and functions SQ9 System Accuracy [the IS] always does what it should
SQ10 Flexibility The [the IS] user interface can be easily adapted to one’s personal approach
SQ11 Reliability
The [the IS] system is always up-and-running as necessary
SQ12 Efficiency The [the IS] system responds quickly enough
SQ13 Sophistication [the IS] requires only the minimum number of fields and screens to achieve a task
SQ14 Integration All data within [the IS] is fully integrated and consistent
SQ15 Customization [the IS] can be easily modified, corrected or improved.
Information-Quality is concerned with the quality of [the IS] outputs: namely, the quality of the information the system produces in reports and on-screen.
IQ1 Importance Information available from [the IS] is important
IQ2 Availability Information needed from [the IS] is always available
IQ3 Usability Information from [the IS] is in a form that is readily usable
14
Table 2.3. Information System Success Criteria Definition (Continued)
Criteria Definition
IQ5 Relevance [the IS] provides output that seems to be exactly what is needed
IQ6 Format Information from [the IS] appears readable, clear and well formatted
IQ7 Content Accuracy Though data from [the IS] may be accurate, outputs sometimes are not
IQ8 Conciseness Information from [the IS] is concise IQ9 Timelines Information from [the IS] is always timely
IQ10 Uniqueness Information from [the IS] is unavailable elsewhere Individual-Impact is concerned with how [the IS] has influenced individual capabilities and effectiveness on behalf of the organization
II1 Learning I learnt much through the presence of [the IS].
II2 Awareness / Recall
[the IS] enhances my awareness and recall of job related information
II3 Decision Effectiveness
[the IS] enhances my effectiveness in the job
II4 Individual Productivity
[the IS] increases my productivity
Organizational-Impact refers to impacts of [the IS] at the organizational level; namely improved organizational results and capabilities.
OI1 Organizational Costs
[the IS] is cost effective
OI2 Staff
Requirements
[the IS] has resulted in reduced staff costs
OI3 Cost Reduction
[the IS] has resulted in cost reductions (e.g. inventory holding costs, administration expenses, etc.)
OI4 Overall Productivity
[the IS] has resulted in overall productivity improvement
OI5 Improved
Outcomes/Outputs
15
Table 2.3. Information System Success Criteria Definition (Continued)
Criteria Definition
OI6 Increased Capacity
[the IS] has resulted in an increased capacity to manage a growing volume of activity (e.g. transactions, population growth, etc.)
OI7 E-Business [the IS] has resulted in better positioning for e-Business.
OI8 Business Process Change
[the IS] has resulted in improved business processes
Source:
Appendix B – The Pool of 37 IS-Impact Measures (a-priori model) (Gable et al., 2008).
c. Information Success Model Suitable for SME at Yogyakarta
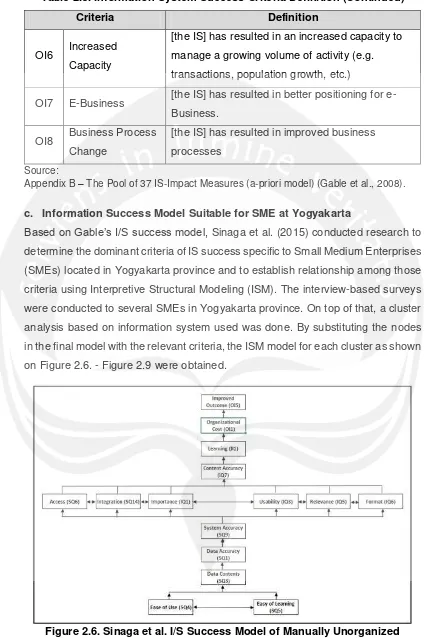
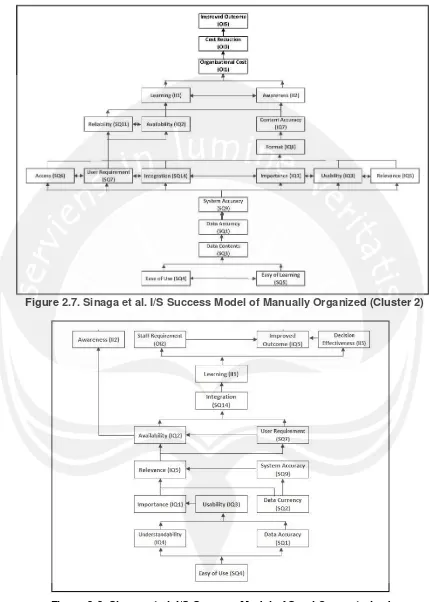
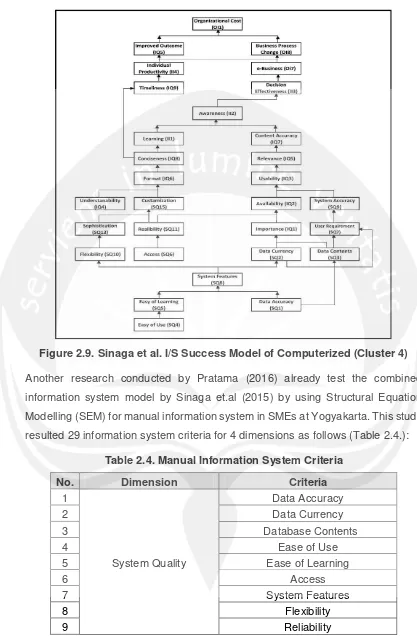
Based on Gable’s I/S success model, Sinaga et al. (2015) conducted research to determine the dominant criteria of IS success specific to Small Medium Enterprises (SMEs) located in Yogyakarta province and to establish relationship among those criteria using Interpretive Structural Modeling (ISM). The interview-based surveys were conducted to several SMEs in Yogyakarta province. On top of that, a cluster analysis based on information system used was done. By substituting the nodes in the final model with the relevant criteria, the ISM model for each cluster as shown on Figure 2.6. - Figure 2.9 were obtained.
16
Figure 2.7. Sinaga et al. I/S Success Model of Manually Organized (Cluster 2)
17
Figure 2.9. Sinaga et al. I/S Success Model of Computerized (Cluster 4)
Another research conducted by Pratama (2016) already test the combined information system model by Sinaga et.al (2015) by using Structural Equation Modelling (SEM) for manual information system in SMEs at Yogyakarta. This study resulted 29 information system criteria for 4 dimensions as follows (Table 2.4.):
Table 2.4. Manual Information System Criteria
No. Dimension Criteria
1
System Quality
Data Accuracy
2 Data Currency
3 Database Contents
4 Ease of Use
5 Ease of Learning
6 Access
7 System Features
8 Flexibility
18
Table 2.4. Manual Information System Criteria (Continued)
No. Dimension Criteria
10
29 Business Process Change
2.2.3. Decision Making Trial and Evaluation Laboratory (DEMATEL)
19
dependency issues among criteria. The four steps of method calculation are described as follows (Shih et al., 2013):
a. Step 1: Generate an original impact matrix (A)
The calculations of the original mean matrix are conducted by pairwise comparisons of dimensions (criteria) to evaluate the perceived level of impact of each respondent regarding the dimensions (criteria). The evaluation scale ranges from 0 to 4, where 0 represents no impact among the dimensions (criteria); 1 represents a low level of impact; 2 represents a medium level of impact; 3 represents a high level of impact; and 4 represents an extremely high level of impact as shown in Table 2.5. The original mean impact matrix (A) can be obtained by the average of the summation of the expert answer matrices.
Table 2.5. DEMATEL Scale Range Respondent’s Evaluation
Scale Description
0 No impact between the criteria 1 Low level of impact 2 Medium level of impact 3 High level of impact 4 Extremely high level of impact
b. Calculate the direct impact matrix (M)
First, obtain the maximum values of all rows or columns of the original mean matrix (A), then apply Eq. (1) and (2) to normalize the processes to obtain the direct impact matrix (M); next, conduct priority ranking of the direct impact matrix among dimensions (criteria) by using the summations of the rows and columns of the direct impact matrix (M), where, i and j denote the dimensions (criteria).
� = . � (1)
= � (
�� 11≤ ≤ ∑=1|� |
,
1
��1≤ ≤ ∑=1|� |
) , , = , , , … ,
(2)c. Calculate the total impact matrix (T)
By Eq. (3), the total impact matrix (T) can be obtained.
� = � � − � −1 (3)
20
(D + R); subtract the column vector (D) and the reverse of the row vector (R) to obtain the row and column difference vector (D-R). When the value of (D + R) is higher, it means that the mutual effects of the dimensions (criteria) are greater. The
difference vector (D-R) represents the net impact of the total impact matrix. If (D-R > 0), it means that the dimension (criteria) has greater impact on other
dimensions (criteria) than the impact of other dimensions (criteria) on it, hence, it is referred to as the dispatcher. On the contrary, if (D-R < 0), the dimension (criteria) has a smaller impact on other dimensions (criteria) than the impact of other dimensions (criteria) on it, and hence, it is referred to as receiver.
� = [� ] × , , = , , , … , (4)
= ∑ =1� (5)
� = ∑=1� (6)
d. Step 4: Structural correlation analysis
After obtaining the total impact matrix, construct the correlation diagram and analyze the impact relations of the value of (D-R) and the value (D + R) by diagram to obtain the structural correlation impact.
2.2.4. Analytical Network Process (ANP)
Professor Thomas L. Saaty wrote module of Analytical Network Process (ANP) in a journal that explains:
“The Analytic Hierarchy Process (AHP) is a theory of relative measurement with absolute scales of both tangible and intangible criteria based on the
judgment of knowledgeable and expert people. The main concerned of the
mathematics of the AHP is how to measure intangibles. The AHP reduces a
multidimensional problem into a one dimensional one. Decisions are
determined by a single number for the best outcome or by a vector of priorities
that gives an ordering of the different possible outcomes. We can also combine
our judgments or our final choices obtained from a group when we wish to
cooperate to agree on a single outcome.
The Analytic Network Process (ANP) is a generalization of the Analytic
Hierarchy Process (AHP), by considering the dependence between the
elements of the hierarchy. Many decision problems cannot be structured
higher-21
level elements in a hierarchy on lower-level elements. Therefore, ANP is
represented by a network, rather than a hierarchy.
The Analytical Network Process (ANP) is a general theory of relative
measurement used to drive composite priority ratio scales from individual ratio
scales that represent relative measurement of the influence of elements that
interact with respect to control criteria (Saaty, 1999). ANP is one of the
multivariate decision making methods. It's useful when decision makers should
consider multiple factors and choices.
The feedback structure does not have the top-to-bottom form of a hierarchy but
a network, with cycles connecting its components of elements, which we can
no longer call levels, and with loops that connect a component to itself. It also
has sources and sinks. A source node is an origin of paths of influence
(importance) and never a destination of such paths. A sink node is a destination
of paths of influence and never an origin of such paths. A full network can
include source nodes; intermediate nodes that fall on paths from source nodes,
lie on cycles, or fall on paths to sink nodes; and finally sink nodes. Some
networks can contained only source or sink nodes.”
The ANP is a coupling of two parts. The first consists of a control hierarchy or network of criteria and sub criteria that control the interactions. The second is a network of influences among the elements and clusters. The network varies from criteria to criteria and a different super matrix of limiting influence is computed for each control criterion. Finally, each of these super matrix is weighted by the priority of its control criterion and the results are synthesized through addition for all the control criteria.
ANP resolves both quantitative and qualitative issues that compare the respondent perceived to cluster and nodes. The judgments are collected in qualitative terms
by numerical. The Fundamental Scale used for the judgments is given in Table 2.6. Unlike DEMATEL, matrix of ANP is a geometric matrix in which a
22
Table 2.6. ANP Fundamental Scale
Numerical Scale Preference Level
1 Equally preferred
2 Equally to moderately preferred 3 Moderately preferred
4 Moderately to strongly preferred 5 Strongly preferred
6 Strongly to very strongly preferred 7 Very strongly preferred
8 Very strongly to extremely preferred 9 Extremely preferred
The vector of priorities is the principal eigenvector of the matrix. This vector gives the relative priority of the criteria measured on a ratio scale. That is, these priorities are unique to within multiplication by a positive constant. However, if one ensures that they sum to one they are then unique and belong to a scale of absolute numbers. Associated with the weights is an inconsistency. The Consistency Index (CI) and Consistency Ratio (CR) of a matrix is given by (7) and (8) (Saaty, 1999).
� = � ��−
−1 (7)
� = ���� (8)
The consistency ratio is obtained by forming the ratio of CI (Consistency Index)
and the appropriate one of the following set of numbers (RI) as shown in Table 2.7., each of which is an average random consistency index computed for
n≤10 for very large samples. They create randomly generated reciprocal matrices using the scale 1/9, 1/8,…,1/2, 1, 2,…, 8, 9 and calculate the average of their eigenvalues. This average is used to form the Random Consistency Index eigenvalues. This average is used to form the Random Consistency Index (RI).
Table 2.7. Random Index (RI)
Order 1 2 3 4 5 6 7 8 9 10
RI 0 0 0.52 0.89 1.11 1.25 1.35 1.40 1.45 1.49