Three decades of deforestation in southwest Sumatra:
Have protected areas halted forest loss and logging,
and promoted re-growth?
David L.A. Gaveau
a,b,*, Hagnyo Wandono
c, Firman Setiabudi
d aWildlife Conservation Society-Indonesia Program, Jl. Pangrango No. 8, Bogor, IndonesiabDurrell Institute of Conservation and Ecology, Department of Anthropology, University of Kent, Canterbury, CT2 7NR, Kent, UK cBukit Barisan Selatan National Park Office, Directorate General of Forest Protection and Nature Conservation (PHKA),
Kota Agung Barat, Lampung Province, Indonesia
dIllegal Logging Response Centre-European Union/Ministry of Forestry, Manggala Wanabakti Bld. Block VII, 6th Floor,
Jl. Jend. Gatot Subroto, Jakarta, Indonesia
A R T I C L E I N F O
Article history:
Received 7 February 2006 Received in revised form 5 August 2006
Accepted 31 August 2006 Available online 1 November 2006
Keywords:
Protected Areas (PA) Forest loss
Logging Forest re-growth Satellite imagery Southwest Sumatra
A B S T R A C T
Much of the forest cover in southern Sumatra, Indonesia has been cleared since the early 1970s, but accurate estimates of the scales and rates of loss are lacking. This study com-bined high-quality remote sensing applications and extensive field surveys, both to provide an accurate picture of deforestation patterns across an area of 1.17 million ha in southwest Sumatra and to assess whether southwest Sumatra’s Bukit Barisan Selatan National Park (BBSNP) has halted forest loss and logging, and promoted re-growth, since its creation in 1984. Of the single large (692,850 ha) contiguous area of forest standing across our study area in 1972, nearly half (344,409 ha) has been cleared from 1972 to 2002, at an average rate per original forest cover of 1.69% y 1. In Gunung Raya Wildlife Sanctuary (GRWS) and Hydrological Reserves (HR), forests have shrunk by 28,696 ha and 113,105 ha, at an average rate of 2.74% y 1and 2.13% y 1, respectively. In contrast, forests in BBSNP have reduced four times more slowly than those in GRWS and HR, and have shrunk by 57,344 ha, at an average rate of 0.64% y 1. Nevertheless, the forests within BBSNP were cleared almost as rapidly during the post-establishment, as during the pre-establishment, period (0.65% y 1 and 0.63% y 1, respectively) despite the introduction of protection measures during the post-establishment period, following the government’s pledge to expand and protect Indo-nesia’s network of Protected Areas (PAs) at the 1982 Bali World Parks Congress. While these protection measures failed to slow down rates of forest loss caused by agricultural encroachments they reduced large-scale mechanised logging by a factor of 4.2 and stabi-lized some 8610 ha of agricultural encroachments, enabling forest re-growth.
Ó2006 Elsevier Ltd. All rights reserved.
0006-3207/$ - see front matterÓ2006 Elsevier Ltd. All rights reserved. doi:10.1016/j.biocon.2006.08.035
*Corresponding author: Address: Wildlife Conservation Society-Indonesia Program, Jl. Pangrango No. 8, Bogor, Indonesia. Tel.: +62 251342135.
E-mail addresses: [email protected], [email protected] (D.L.A. Gaveau), [email protected] (H. Wandono), ilrc-gis@ cyber-isp.net.id (F. Setiabudi).
a v a i l a b l e a t w w w . s c i e n c e d i r e c t . c o m
1.
Introduction
Despite the dramatic loss of the world’s humid tropical forests (Achard et al., 2002), an interview-based study in 93 tropical ter-restrial Protected Areas (PAs) world-wide suggests that >83% of the sites surveyed are maintaining or increasing their forest cover (Bruner et al., 2001). Several satellite-based studies con-cur with the conclusions ofBruner et al. (2001), and indicate that tropical terrestrial PAs are generally effective at slowing deforestation within their boundaries (Sanchez-Azofeifa et al., 2003; Defries et al., 2005; Naughton-Treves et al., 2005; Nepstad et al., 2006). Nevertheless, DeFries et al. (2005) noted that Southeast Asian PAs inhibit forest loss less effectively than Latin America PAs. In Indonesian Borneo (Kalimantan) pro-tected lowland forests declined by more than 56% during the period 1985 to 2001, mainly due to concession-based timber extraction and plantation establishment (Curran et al., 2004). In Indonesia’s second largest island (Sumatra), where forests declined by 6.7 million ha from 1985 to 1997 (FWI/GFW, 2002) the effectiveness of PAs at conserving forest habitat is also being questioned (Jepson et al., 2001; Kinnaird et al., 2003; Lin-kie et al., 2004). However, the lack of accurate estimates of the scales and rates of forest loss within Sumatran PAs has limited research on PA effectiveness in this part of the tropical world.
Here, we present a novel empirical approach to test the effec-tiveness of Sumatran PAs at conserving forest habitat. Our approach employs high-quality satellite-based data and exten-sive field surveys, rather than interviews (Bruner et al., 2001) that are vulnerable to the biases of informants (Nepstad et al., 2006). The method incorporates deforestation rates in and
around PAs (Defries et al., 2005; Naughton-Treves et al., 2005; Nepstad et al., 2006) and deforestation rates before and after PA establishment (Liu et al., 2002). It also includes re-growth and logging mitigation that are rarely discussed in the literature on PA effectiveness. We examined data for the Bukit Barisan Selatan National Park (BBSNP) in Southern Sumatra because of its important areas of lowland tropical evergreen forest. In 1972, the BBSNP and two other reserves of lesser protection sta-tus protected parts of a single, large contiguous area of forest. First, we determined the fragmentation and deforestation rates of this forested area. Second, we compared the fragmentation and the rates of forest loss across unprotected forests and pro-tected forests, to test whether unpropro-tected forests have reduced more rapidly than protected forests and whether forests within PAs of lesser protection status have reduced more rapidly than forests within the BBSNP. Third, we measured the rates of forest loss before and after the BBSNP was declared a national park, to test whether the current BBSNP prevented agricultural encroachments. Fourth, we measured logging trail networks during BBSNP’s pre- and post-establishment phases, to test whether the current BBSNP prevented large scale mechanised logging. Finally, we measured forest re-growth after the BBSNP was declared a national park, to test whether the current BBSNP promoted forest re-growth.
2.
Study area
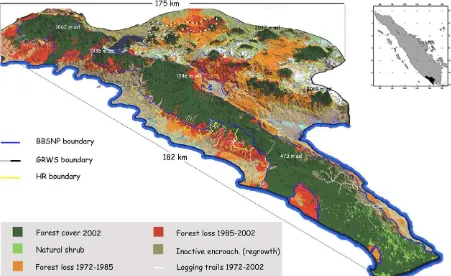
Our study area extends for 220 km along the South Barisan Mountains in southwest Sumatra (Fig. 1), and encompasses 1.17 million ha of land stretching across Sumatra’s southern
provinces of Lampung, Bengkulu, and South Sumatra. Its southern and western sides are bordered by a 537 km coastline with the Indian Ocean, while its northern and eastern sides are defined by the limits of satellite coverage and limits of neg-ligible cloud cover. The topography ranges in elevation from sea level to 2200 m asl. Rainfall is generally high, between 3000 and 4000 mm per year. In 1972, the study area comprised one large contiguous area of forest known as, the Bukit Bari-san Selatan Forest Landscape (BBSFL). The BBSFL represents the maximum available forest area in our study site.
Southern Sumatra’s human population has increased dra-matically since the 1930s, and this region began to lose its for-ests sooner than any other Sumatran region (Benoit et al., 1989). Nevertheless, the BBSFL still contains one of the largest remaining tracts of lowland and hill rainforests on Sumatra. BBSFL is home to at least 118 species of mammal, 425 species of bird, 45 amphibian and reptile species, and 649 species of higher plant. These include large threatened mammals, such as Sumatran tigers (Panthera tigris), Asian elephants (Elephas maximus) and Sumatran rhinoceroses (Dicerorhinus sumatren-sis) (O’Brien and Kinnaird, 1996). To conserve the fauna, flora and watershed functions of the BBSFL the Dutch colonial power established three reserves in southwest Sumatra dur-ing the 1930s. These comprised: the 324,494 ha South Sumatra I Nature Reserve (SSINR), the 47,782 ha Gunung Raya Wildlife Sanctuary (GRWS), and a 256,620 ha network of Hydrological Reserves (HR). In 1984, the South Sumatra I Nature Reserve was declared as the Bukit Barisan Selatan National Park (BBSNP). In 2004, the BBSNP was declared a World Heritage site by UNESCO (decision 28COM 14B. 5).
3.
Methods
3.1. Mapping forest loss
3.1.1. Time series satellite data
To generate maps of changing forest cover across the study area, we acquired LANDSAT scenes for the years 1972 (MSS), 1985 (MSS) and 2002 (ETM+), all of which had negligible (less than 3.5%) cloud cover. The 1985 imagery was used to calculate deforestation rates during the BBSNP’s pre- and post-establish-ment periods. We geo-referenced the 2002 scenes to the ground with Ground Control Points (GCPs) collected in the field by the World Wildlife Fund (WWF) using a handheld Global Positioning System (GPS) set in the Universal Transverse Mer-cator (UTM) projection, Zone 48 South. Then, we matched the 1972 and 1985 scenes in x- and y- to the 2002 scenes through a second order polynomial co-registration technique (Schowengerdt, 1997). The spatial precision obtained was smaller than one pixel. We obtained additional cloud-free LANDSAT and aerial imagery for 1976, 1978, 1989, 1994, 1997 and 2000 in areas where large-scale mechanised logging had occurred to map the spatial distribution of logging trails (truck roads). The locations of these areas were identified from maps and reports of old timber concessions bordering BBSNP (Meijer, 1975) and by interviewing long-serving BBSNP staff.
3.1.2. Classification strategy
We identified forest and non-forest by analysing the reflection of sunlight from the Earth’s surface in three spectral regions:
red, near infrared, and short wave infrared on the ETM+ data (bands 3, 4 and 5), and red and near infrared on the MSS data (bands 2, 3 and 4). The red and infrared bands were scattered less by the atmosphere than the blue and green bands (Born and Wolf, 1975) and therefore produced the highest available contrast between forest and non-forest.
We interpreted the imagery as a temporal progression of forest change to identify areas of deforestation. We defined ‘Deforestation’ as the complete removal of forest cover over an area equivalent toP1 ha. We defined the ‘forest’ class as
non-modified forest areas of old-growth vegetation dominated by closed-canopy tree cover (P50%). ‘Non-forest’ comprised
human settlements, Imperata cylindrica grasslands, and re-growth areas dominated by shrubs and young forest trees, paddy fields and tree crops. Tree crops included coffee and pepper gardens, cinnamon, coconut and oil palm plantations, orchards and an old-growth agro-forest dominated byShorea javanicaa species of Dipterocarp (Michon and de Foresta, 1992). We used a gaussian Maximum Likelihood Classification (MLC) algorithm (Schowengerdt, 1997) to generate a classifica-tion of the study area into one forest class and one non-forest class. We filtered classification results to remove clumps of pixels whose corresponding size on the earth surface was <1 ha. We edited classification results visually by on-screen digitizing in areas of haze and in areas of high topographic complexity, where the MLC algorithm often produces mis-classification errors. We digitized logging trails manually by on-screen digitizing. Small-scale logging by local communi-ties lacking heavy equipment remained undetected.
3.1.3. Topography and PA boundary
We employed the NASA SRTM Digital Elevation Model (DEM) (Rabus et al., 2003) to categorise forest types by elevation and slope. We placed forest areas into four elevation-based categories using the altitudinal zoning system proposed by vanSteenis (1961): lowland: 0–500 m; hill: 500–1000 m; lower montane: 1000–1500 m; and, upper montane: 1500–2200 m asl. Forest areas were further categorised into four slope-based forest classes, using Indonesia’s Ministry of Forestry classification system: 0–8.5°, 8.5–24°, 24–45°, +45°.
The BBSNP boundary was obtained from the BBSNP Office at a scale of 1:25,000, and corrected in the field with GPS, by a team from the BBSNP Office, the Wildlife Conservation Soci-ety (WCS) and WWF. The GRWS and HR boundaries were ob-tained from the Ministry of Forestry at a scale of 1:250,000, but were rescaled to 1:25,000 in selected areas by the Interna-tional Centre for Research in Agro forestry (ICRAF) and WCS, again using GPS.
3.1.4. Accuracy assessment
on-screen digitizing technique to create a reference forest map for year 1976 (in 1:25,000 scale) and for year 2002 (in 1:3,600 scale) directly comparable to the LANDSAT MSS- & TM-based 1972 and 2002 forest maps (in 1:108,000 scale).
We generated two confusion matrices (Aronoff, 1982; Foo-dy, 1992) by assigning either forest or non-forest classes to (i) 220 points on the LANDSAT-MSS 1972 forest map and on its reference map (aerial photography-based) and to (ii) 145 points on the LANDSAT-TM 2002 forest map and its reference map (IKONOS -based). These points were chosen randomly, but with a separation distance of 1000 m between two points to minimize the effects of spatial autocorrelation (Koening, 1999). From each confusion matrix, we calculated the overall accuracy,poand the kappa coefficient,k (Cohen, 1960). We could not validate the accuracy of the 1985 forest map be-cause we did not possess reference information for that year.
3.1.5. Forest fragmentation
To provide ecologically meaningful measures, we extracted fragmentation statistics only on forest fragments >an arbi-trarily chosen threshold of 100 ha (McGarigal and Marks, 1994). We measured the degree of isolation of each fragment by calculating the Nearest Neighbour Distance (NND) as an edge-to-edge distance from one fragment to its nearest neigh-bour. We measured the degree of roundedness of each frag-ment by calculating the ratio, R between the minor and major axes of a fitted ellipse having equal area. We measured the proportion of forest area for each fragment in low and high altitudinal forest by calculating the ratio between the areas of forest at low altitude (<1000 m asl) and at high alti-tude (>1000 m asl). Likewise, we computed the ratio between the area of forest on gentle slopes (<16.5°) and on steep slopes (>16.5°).
As forest fragments sometimes fall across areas with dif-ferent protection status, we ruled that a given fragment be-longed to that particular protection status only when the latter enclosed more than 50% of the fragment area. Con-versely, when more than 50% of a fragment fell into unpro-tected land, then that fragment was considered as unprotected. This rule enabled us to quantify the number of forest fragments by status of PA, in order to calculate their associated summary fragmentation statistics.
3.2. Mapping re-growth
While we could map forest loss and logging trails consistently across the study area with satellite imagery, we could not map forest re-growth by satellite alone because this land cov-er type produces similar reflectance values to those gencov-erated by smallholder tree crops, and vice versa (King, 2002). There-fore we combined our There-forest maps with field surveys to mea-sure the amount of re-growth within the current BBSNP after it was declared a national park.
3.2.1. Satellite-based forest maps
The LANDSAT-based forest maps derived for 1972, 1985 and 2002 helped categorise the encroachments into BBSNP (de-fined as those areas within BBSNP where forest has been re-moved since 1972). These encroachments were classified as either ‘active’ or ‘inactive’, based on whether or not they
had expanded in size during BBSNP’s post-establishment per-iod, from 1985 to 2002. We predicted a predominance of re-growth areas and absence of agricultural land in the ‘inactive’ encroachments, but a predominance of agricultural land, and absence of re-growth in the ‘active’ encroachments. We sub-sequently verified our satellite-based assumptions with field surveys.
3.2.2. Field evaluation of forest re-growth in BBSNP
From September 2004 to May 2005, three teams from the BBSNP Office and WCS recorded which land use types have substituted natural forests within ‘active’ and ‘inactive’ encroachments into BBSNP. The forest edge and BBSNP boundary marked the limit of any areas of encroachment. Each team sampled agricultural and non-agricultural areas of land by walking along a line transect placed in each area of encroachment. Within non-agricultural areas, the teams sampled re-growth areas, grassland areas as well as recent clearings. The teams recorded this vegetation change in nearly all the encroachments to capture the entire spatial var-iability of forest conversion processes inside the park. Because of time constraints, the surveyors were prevented from mea-suring vegetation parameters using tools, as used in smaller scale, rigorous forest inventories (Husch et al., 1993). We placed the pre-determined line transect across the full topo-graphic gradient of the encroachment to avoid the selective sampling of vegetation in more accessible areas, and we avoided positioning it along footpaths, to encourage surveyors to sample all the vegetation types within the encroachment.
Each field team carried a LANDSAT-based 108,000 scale map of the surveyed encroachment area under investigation. The map displayed the forest edge and BBSNP boundary to mark the border of the surveyed encroachment, topographic contour lines, road, village and river networks overlays and the position of the pre-determined line transect. The teams used a compass and handheld GPS unit to follow the direction of the line transect and a digital camera to photograph the vegetation. While walking each transect, the surveyors cap-tured a GPS reading at the transition from agriculture to non-agriculture and from areas of re-growth to grasslands or to recent clearing (and vice-versa), and took a picture of the landscape. This surveying method provided a length mea-surement and photograph of every homogeneous stand of vegetation and land use type encountered along the line tran-sect. The GPS point data and associated attributes were sub-sequently entered in a Geographic Information System (GIS) and converted to a length measurement, to partition the line transect into segments of varying lengths. Each segment had vegetation and land use attribute and an associated photo-graph. The photograph was subsequently referred to, to en-sure the three teams provided consistent results.
4.
Results
4.1. Accuracy results
k1972= 0.86 andk2002= 0.88, respectively. We believe the classi-fication accuracy for 1985 is as good as for 1972, given that the same sensors and processing methods were employed across each classification.
4.2. Deforestation patterns across the study area
Of the 1.17 million ha study area, over half (692,850 ha) was covered in natural forest in 1972 (Table 1,Fig. 1). This forest area constituted one single, large contiguous area of forest, the BBSFL. Lowland forests, 6500 m asl, and hill forests, >500 m and61000 m asl, accounted for 40% and 39% of this forest ecosystem, respectively.
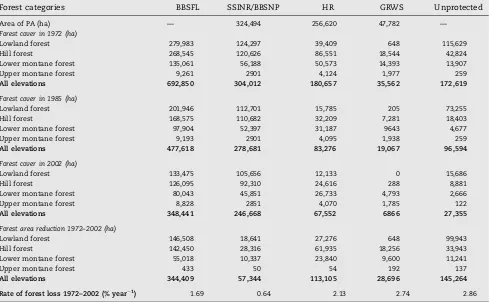
By 2002, the overall size of BBSFL had reduced by nearly half (Table 1,Fig. 1), at an average rate per original forest cover of 1.69% y 1. The rates of loss of lowland, hill and lower mon-tane forest areas were similar, averaging 1.7% y 1, 1.8% y 1 and 1.4% y 1, respectively (Fig. 2). In contrast, the rate of loss of upper montane forests was much lower at 0.2% y 1. Defor-estation rates increased from 0.2% y 1on extreme slopes of +45°, to 1.9% y 1on gentle slopes <8.5°. Overall, 84% of the for-est area lost across the BBSFL was of lowland and hill forfor-est <1000 m asl. However, this loss did not alter the proportion of different forest types by elevation (Fig. 3).
The loss of forest cover resulted in the breaking up of BBSFL into smaller fragments. By 2002, BBSFL comprised 1094 forest fragments, but the size of these fragments was heavily skewed. Approximately 45% of the fragments were
<2.7 ha, while the three largest fragments were 17,673 ha, 120,000 ha and 159,000 ha, respectively. Of the 1094 frag-ments, 32 fragments were >100 ha. The NND between these 32 fragments ranged from 0.06 km to 9.88 km (Table 2), and some 72% of the fragments were separated by more than 1 km. The roundedness (R) values of the forest fragments ran-ged from 0.21 to 0.91. Approximately 19% and 9% of the frag-ments were either round (RP0.8), or highly elongated
(R60.3), respectively, and the largest forest fragment had the most elongated shape (R= 0.21). Approximately 69% and 56% of the fragments contained a higher proportion of forest area at higher altitudes and on steep slopes, respectively ( Ta-ble 2).
4.3. Deforestation patterns within PAs
In 1972, the combined area of PAs made up by the former SSINR, and by GRWS and HR protected 75% of the BBSFL ( Ta-ble 1,Fig. 1). In the subsequent 30-year period, unprotected forests have reduced by 145,264 ha, representing an 84% loss of original forest cover, at an average rate of 2.86% y 1. In GRWS, forests have shrunk by 28,696 ha, representing an 81% loss of forest cover, at an average rate of 2.74% y 1, while forests in HR have reduced by 113,105 ha, representing a 62% loss of forest cover, at an average rate of 2.13% y 1. In con-trast, the forest area of the current BBSNP has reduced by 57,344 ha, representing a 19% loss of forest cover, at an aver-age rate of 0.64% y 1. As with the deforestation pattern across
Table 1 – Statistics for losses in forest cover of the BBSFL from 1972 to 1985 and from 1985 to 2002, shown according to protected status
Forest categories BBSFL SSINR/BBSNP HR GRWS Unprotected
Area of PA (ha) — 324,494 256,620 47,782 —
Forest cover in 1972 (ha)
Lowland forest 279,983 124,297 39,409 648 115,629
Hill forest 268,545 120,626 86,551 18,544 42,824
Lower montane forest 135,061 56,188 50,573 14,393 13,907
Upper montane forest 9,261 2901 4,124 1,977 259
All elevations 692,850 304,012 180,657 35,562 172,619
Forest cover in 1985 (ha)
Lowland forest 201,946 112,701 15,785 205 73,255
Hill forest 168,575 110,682 32,209 7,281 18,403
Lower montane forest 97,904 52,397 31,187 9643 4,677
Upper montane forest 9,193 2901 4,095 1,938 259
All elevations 477,618 278,681 83,276 19,067 96,594
Forest cover in 2002 (ha)
Lowland forest 133,475 105,656 12,133 0 15,686
Hill forest 126,095 92,310 24,616 288 8,881
Lower montane forest 80,043 45,851 26,733 4,793 2,666
Upper montane forest 8,828 2851 4,070 1,785 122
All elevations 348,441 246,668 67,552 6866 27,355
Forest area reduction 1972–2002 (ha)
Lowland forest 146,508 18,641 27,276 648 99,943
Hill forest 142,450 28,316 61,935 18,256 33,943
Lower montane forest 55,018 10,337 23,840 9,600 11,241
Upper montane forest 433 50 54 192 137
All elevations 344,409 57,344 113,105 28,696 145,264
Rate of forest loss 1972–2002 (% year 1)
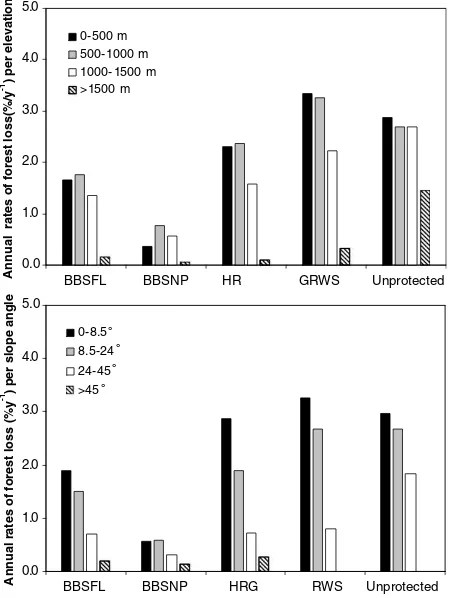
the wider BBSFL, the rates of forest loss in the PAs were high-est in the lowland, hill and lower montane forhigh-ests, and rates of loss increased with decreasing slope angle (Fig. 2). This loss of forest cover significantly altered the proportional area of different forest types by elevation in the GRWS and HR, where the dominant forest type shifted from hill forest to lower montane forest (Fig. 3).
Fragmentation statistics also differed across PAs of differ-ent status (Table 2). The GRWS contained the fewest forest fragments (n= 3) while the HR had the most fragments (n= 16). The mean fragment size decreased with increasing rates of forest loss (Tables 1 and 2). Fragments in the HR and GRWS had the highest mean NND, of 3.00 km and 2.82 km, respectively. In contrast, the current BBSNP had the shortest mean NND of 1.25 km. The HR and GRWS also con-tained a higher proportion of fragments at high altitudes and on steep slopes than did the BBSNP.
4.4. Deforestation and logging rates during BBSNP’s pre-and post-establishment periods
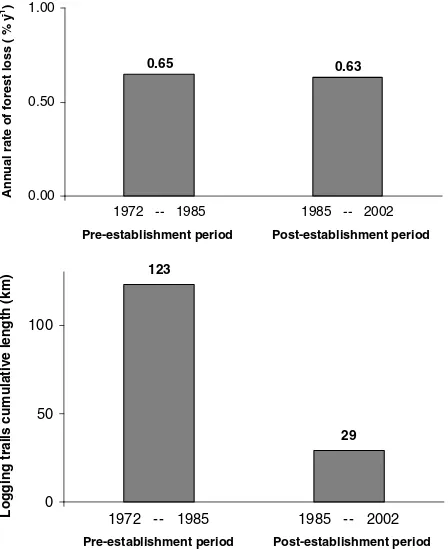
During its pre- (1972–1985) and post-establishment (1985– 2002) periods, the forests within the former SSINR and current BBSNP, have reduced at similar rates relative to the original (1972) forest area, and rates of loss have averaged 0.65% y 1 and 0.63% y 1, respectively (Fig. 4).
The logging trail network extended 123 km in the south-ern and westsouth-ern sections of the former SSINR, during the
pre-establishment period of BBSNP (1972–1985). This net-work extended 29 km in the western and northern sections of BBSNP during its post-establishment period (1985–2002) (Fig. 4).
4.5. Re-growth during BBSNP’s post-establishment period
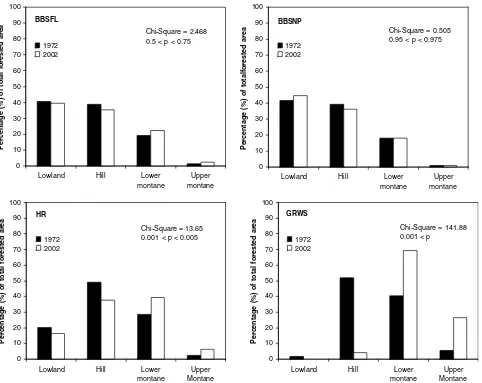
Over the thirty years, an area of 57,344 ha of primary forest has been removed within the boundary of the BBSNP, with 48,734 ha and 8610 ha categorised as ‘active’, and ‘inactive’, respectively. Most ‘inactive’ encroachments were the subject of forced evictions in 1986, following the government’s pledge to intensify the protection of its PAs at the 1982 Bali World Parks congress.
The total transect length extended 365.3 km, with 342.7 km and 22.6 km in ‘active’ and ‘inactive’ encroach-ments, respectively.
Agricultural land occurred along 57.9% and 23.1% of the to-tal lengths of ‘active’ and ‘inactive’ encroachments, respec-tively (Fig. 5).
In ‘inactive’ encroachments, re-growth occurred along 76.9% of the total transect length. This re-growth was domi-nated by tall shrubs and young forest trees characteristic of secondary forest and sometimes bamboo or wild ginger ( Zing-iberaceae). In ‘active’ encroachments, re-growth occurred along 34.5% of the total transect length. This re-growth was dominated by unattended coffee plantations and small shrubs characteristic of fallow vegetation.
0.0 1.0 2.0 3.0 4.0 5.0
BBSFL BBSNP HR GRWS Unprotected
Annual rates of forest loss(%/y
-1) per elevation
0-500 m 500-1000 m 1000- 1500 m >1500 m
0.0 1.0 2.0 3.0 4.0 5.0
BBSFL BBSNP HRG RWS Unprotected
Annual rates of forest loss (%y
-1 ) per slope angle
0-8.5
˚
8.5-24˚
24-45˚
>45˚
These results confirm the predominance of forest re-growth (76.9%) in ‘inactive’ encroachments, and the predom-inance of agricultural land (57.9%) in ‘active’ encroachments. However this survey also reports a significant presence of agricultural land (23.1%) in ‘inactive’ encroachments, and of fallow vegetation (34.5%) in ‘active’ encroachments.
5.
Discussion
5.1. Accurate maps of forest cover and change
This study of deforestation over an extensive area of south-west Sumatra has generated maps of forest cover and forest
BBSFL
Percentage (%) of total forested area
BBSNP
Percentage (%) of totalforested area
HR
Percentage (%) of total forested area
GRWS
Percentage (%) of total forested area
Chi-Square = 2.468
Fig. 3 – Proportions of different forest types by elevation, shown for each of the BBSFL, BBSNP, GRWS and HR, in 1972 and 2002.
Table 2 – Summary of fragmentation statistics within areas of different protection status across the BBSFL in 2002
Fragmentation statistics in 2002 BBSFL SSINR/ BBSNP HR GRWS Unprotected
Area of PA (ha) — 324,494 256,620 47,782 —
No. of fragments (>80 ha) 32 7 16 3 6
Fragment size (ha)
Mean 11,012 41,300 3480 1587 472
Min/Max 120/158,568 169/158,568 121/16,361 1325/2084 120/973
Nearest neighbour distance, NND (km)
Mean 2.41 1.25 3.00 2.82 1.99
Min/Max 0.06/9.88 0.06/4.43 0.15/9.88 1.79/4.14 0.15/6.74
No. of fragments
<1000 m ; >1000 m 10/22 4/3 2/14 0/3 4/2
cover change for 1972, 1985 and 2002 at the very fine spatial scale of 1 ha with high classification accuracies for both non-forest and forest classes, appropriate for analysing fine scale changes in forest cover (Thomlinson et al., 1999). Never-theless, our accuracy assessments were conducted on just a 6–7% spatial subset, and therefore the accuracies presented in this study may vary across the study area.
Our deforestation results merit comparison with those from the earlier study of deforestation over 70% of the area of BBSNP (Kinnaird et al., 2003), which suggested that forest cover had reduced by 66,190 ha from 1985 to 1999, represent-ing a loss of forest cover of 2% y 1during that period. Our deforestation estimates were calculated within more accurate
park boundaries, endorsed by the Park Office as the official boundary, and a more accurate classification method, all of which might explain discrepancies between the rates re-ported byKinnaird et al. (2003)and this study.
5.2. Implications for wildlife conservation
In 1972, the former SSINR, and GRWS and HR, were embedded in a single, large contiguous area of forest known as the BBSFL. Wide ranging species of large mammal could easily disperse from one PA to another through the relative safety of the dense forest interior. However, the BBSFL had shrunk by nearly half in 2002, and had broken up into many small
for-0.65 0.63
0.00 0.50 1.00
1972 -- 1985 1985 -- 2002
Pre-establishment period Post-establishment period
Annual rate of forest loss ( %
y
-1)
29 123
0 50 100
1972 - - 1985 1985 - - 2002 Pre-establishment period Post-establishment period
Logging trails cumulative length (km)
Fig. 4 – Average annual rates of forest loss and cumulative length of logging trails before and after BBSNP was established.
’Active’ encroachments
(area expansion since 1985)re-
growth
Agriculture Grassland Recent clearings77%
23%
58%
34%
5%
3%
’Inactive’ encroachments
(no area expansion since 1985)est fragments. Furthermore, the existing PAs became spatially isolated from one another, while their integrity has also been degraded and fragmented, as has occurred to tropical PAs world-wide (Sanchez-Azofeifa et al., 2003; Linkie et al., 2004; Defries et al., 2005; Naughton-Treves et al., 2005; Nepstad et al., 2006). Increasing isolation and fragmentation may det-rimentally affect the movement patterns of wide ranging and threatened mammals who still live in the BBSFL, such as Sumatran tigers (P. trigris), Asian elephants (E. maximus), and Sumatran rhinoceros (D. sumatrensis). In addition, most remaining forest fragments lie at high altitudes (>1000 m) and on steep land (>16.5°), rather than in the lowland forest preferred by most of these species.Widodo and Santiapillai (1992) found evidence of tiger and elephant presence in the lowland and hill forests of the GRWS in the 1980 s, but this small PA, with its highly fragmented forest habitats can no longer support viable populations of elephants and tigers (Hedges et al., 2005). An estimated 17 elephants still persist in the HR, but this small population may not persist in the long-term (Hedges et al., 2005).
The BBSNP is perhaps the only PA in southwest Sumatra that still offers good forest habitat for wildlife. It includes the largest remaining forest patches, which are narrowly dis-connected from one another, as well as the largest remaining expanses of lowland forest on flat areas of land (Tables 1 and 2). It has also partially reclaimed degraded areas, particularly in the southern peninsular, where large mammal populations have been recorded. The tiger and elephant populations of BBSNP were estimated at 40–43 and 498 individuals, respec-tively in 2001 (O’Brien et al., 2003; Hedges et al., 2005).
Nevertheless, the integrity of the current BBSNP has been compromised over the past 30 years (see also Kinnaird et al., 2003). Its buffer forests have almost completely disap-peared and its remaining forest fragments are thin and elon-gated. This renders the wildlife of BBSNP particularly vulnerable to human pressure, and increases the edge of iso-lated and remote forest patches compared to a circular park of the same area.Kinnaird et al. (2003)showed that tigers, rhi-noceroses and elephants in BBSNP avoid the forest edge, probably because of poaching pressure and fear of humans. Conversely,Hedges et al. (2005)have shown that incidents of human–elephant conflict at the forest edge have escalated in recent times, probably because natural habitats have been fragmented and substituted by farmland, which in turn has increased the likelihood of people encountering elephants ( Si-tati et al., 2003).
5.3. Management capabilities among PAs of different status
As expected, the unprotected forests of southwest Sumatra have been cleared more rapidly than the protected forests. However, the protected forests of the GRWS and HR have been cleared almost as rapidly as the unprotected forests and have become severely fragmented and isolated (Tables 1 and 2), indicating that they have received little protection. Possibly, the GRWS and HR have been less effective than the BBSNP at conserving forests because these reserves do not possess their own management unit while the BBSNP does.
5.4. Park effectiveness
Notwithstanding its superior conservation capabilities com-pared to the other reserves, the BBSNP did not prevent forest loss after the SSINR was declared a national park in 1984. This finding was unexpected because the government of Indonesia implemented radical protection measures after the SSINR was declared a national park following its pledge to expand and protect Indonesia’s network of PAs at the 1982 Bali World Parks congress (Kusworo, 2000). These measures, of cancel-ling logging permits and evicting rural communities, success-fully reduced large-scale mechanized logging by a factor of 4.2 and stabilized some 8610 ha of encroachment, enabling forest re-growth. Nevertheless, they failed to slow down agricultural encroachments. The rapid growth of rural population through spontaneous migrations and the new found rights of the rural communities to shrug off the impositions of government agencies since the 1997–1998 economic crises might explain why the BBSNP failed to inhibit the expansion of agricultural encroachments. Whether deforestation has accelerated in-side the park since 1997–1998, as Curran et al. (2004)have shown for Gunung Palung National Park in Kalimantan, is the subject of further research.
6.
Conclusion
This study has showed that the performance of the BBSNP in Southern Sumatra at conserving forest habitats has achieved only mixed results. One the one hand, the BBSNP performed better than its neighbouring landscape, it halted the develop-ment of large-scale mechanised logging and to some extent promoted forest re-growth. On the other hand, it failed to slow down agricultural encroachments. This finding adds to the body of evidence that Southeast Asian PAs prevent forest loss less effectively than Latin American PAs (Curran et al., 2004; Linkie et al., 2004; Defries et al., 2005).
Broadly, this study demonstrates that the ratio of forest loss outside versus inside a PA boundary cannot measure the effectiveness of PAs at preventing forest loss reliably. Such a measure would have overestimated the effectiveness of the BBSNP at mitigating forest loss because the park performed better than its neighbouring landscape, and yet it failed to slow down agricultural encroachments. Therefore, we ques-tion whether the world’s tropical terrestrial PAs truly prevent forest loss as effectively as claimed, based on three regional studies that used this measure as their main target (Defries et al., 2005; Naughton-Treves et al., 2005; Nepstad et al., 2006).
Acknowledgements
Nigel Leader-Williams, Matthew Linkie, Etienne Delattre, Eric Sanderson, Gari Paoli, Lisa Curran and three anonymous ref-erees, for improving this manuscript. Finally, this work would not have been possible without the dedication of the field team: Bambang Pandu Bharoto, Deky Kristiantono, Susilo, Da-dan Ramradi, Supriatna, Muhammad Zubair, Asiantori, and Wakijan.
R E F E R E N C E S
Achard, F., Eva, H.D., Stibig, H.J., Mayaux, P., Gallego, J., Richards, T., Malingreau, J.P., 2002. Determination of deforestation rates of the World’s humid tropical forests. Science 297, 999–1002.
Aronoff, S., 1982. The map accuracy report: a user’s view. Photogrammetric Engineering and Remote Sensing 48, 1309– 1312.
Benoit, D., Levang, P., Pain, M., Sevin, O., 1989. Transmigration et migrations spontane´es en Indonesie: Propinsi Lampung. Departemen Transmigrasi, Jakarta, Indonesia and ORSTOM, Bondy, France.
Born, M., Wolf, E., 1975. Principles of Optics, fifth ed. Pergamon, New York.
Bruner, A.G., Gullison, R.E., Rice, R.E., da Fonseca, G.A.B., 2001. Effectiveness of parks in protected tropical biodiversity. Science 291, 125–128.
Cohen, J., 1960. A coefficient of agreement for nominal scale. Educational and Psychological Measurement 20, 37–46. Curran, L., Trigg, S.N., McDonald, A.K., Astiani, D., Hardiono, M.,
Siregar, P., Caniago, I., Kasischke, E., 2004. Lowland forest loss in protected areas of Indonesian Borneo. Science 303, 1000– 1003.
Defries, R., Hansen, A., Newton, A.C., Hansen, M.C., 2005. Increasing isolation of protected areas in tropical forests over the past twenty years. Ecological Applications 15 (1), 19–26. Foody, G.M., 1992. On the compensation for chance agreement in
image classification accuracy assessment. Photogrammetric Engineering and Remote Sensing 58, 1459–1460.
FWI/GFW, 2002. The state of the forest: Indonesia. Forest Watch Indonesia, and Washington DC: Global Forest Watch, Bogor, Indonesia.
Hedges, S., Tyson, M.J., Sitompul, A.F., Kinnaird, M.F., Gunaryadi, D., Aslan, 2005. Distribution, status, and conservation needs of Asian elephants (Elephas maximus) in Lampung Province, Sumatra, Indonesia. Biological Conservation 124, 5–48. Husch, B., Miller, C.I., Beers, T.W., 1993. Forest Mensuration, Third
ed. Krieger Publishing Company, Malabar, FL. Jepson, P., Jarvie, J.K., MacKinnon, K., Monk, K.A., 2001.
Decentralization and illegal logging spell the end for Indonesia’s lowland forests. Science 292, 859–861. King, R.B., 2002. Land cover mapping principles: a return to
fundamentals. International Journal of Remote Sensing 23 (18), 3525–3545.
Kinnaird, M.F., Sanderson, E.W., O’Brien, T.G., Wibisono, H.T., Woolmer, G., 2003. Deforestation trends in a tropical landscape and implications for endangered large mammals. Conservation Biology 17, 245–257.
Koening, W.D., 1999. Spatial autocorrelation of ecological phenomena. Trends in Ecology and Evolution 14, 22–26. Kusworo, A., 2000. Perambah hutan atau kambing hitam? Potret
sengketa kawasan hutan di Lampung. Pustaka Latin, Bogor. Linkie, M., Smith, R.J., Leader-Williams, N., 2004. Mapping and
predicting deforestation patterns in the lowlands of Sumatra. Biodiversity and Conservation 13, 1809–1818.
Liu, J., Linderman, M., Ouyang, Z., An, L., Yang, J., Zhang, H., 2002. Ecological degradation in protected areas: the case of Woolong Nature Reserve for giant pandas. Science 292, 98–101. McGarigal, K., Marks, B.J., 1994. FRAGSTATS, spatial pattern
analysis program for quantifying landscape structure. Forest Science Department, Oregon State University.
Meijer, W., 1975. Report on a fact-finding tour aimed towards a co-ordinated development of forest resources in Indonesia. Thomas Hunt Morgan School of Biological Sciences, University of Kentucky.
Michon, G., de Foresta, H., 1992. Complex agroforestry systems and conservation of biological diversity. Agroforestry in Indonesia: a link between two worlds. In: Kheong Y.S., Win L.S. (Eds), Harmony with Nature: An International Conference on the Conservation of Tropical Biodiversity, The Malayan Nature Journal (golden Jubilee issue), Kuala Lumpur, Malaysia. Naughton-Treves, L., Buck Holland, M., Brandon, K., 2005. The role
of protected areas in conserving biodiversity and sustaining local livelihoods. Annual Review of Environment and Resources 30, 219–252.
Nepstad, D., Schwartzman, S., Bamberger, B., Santilli, M., Ray, D., Schlesinger, P., Lefebvre, P., Alencar, A., Prinz, E., Fiske, G., Rolla, A., 2006. Inhibition of amazon deforestation and fire by parks and indegenous lands. Conservation Biology 20 (1), 65–73. O’Brien, T.G., Kinnaird, M.F., 1996. Birds and mammals of the
Bukit Barisan Selatan National Park, Sumatra. Indonesia. Oryx 30, 207–217.
O’Brien, T.G., Kinnaird, M.F., Wibisono, H.T., 2003. Crouching tigers, hidden prey: Sumatran tiger ad prey population in a tropical landscape. Animal Conservation 6, 131–139.
Rabus, B., Eineder, M., Roth, A., Balmer, R., 2003. The shuttle radar topography mission-a new class of digital elevation models acquired by spaceborne radar. Photogrammetry and Remote Sensing 57, 241–262.
Sanchez-Azofeifa, A., Daily, G.C., Pfaff, A.S.P., Busch, C., 2003. Integrity and isolation of Costa Rica’s national parks and biological reserves: examining the dynamics of land-cover change. Biological Conservation 109, 123–135.
Schowengerdt, R.A., 1997. Models and Methods for Image Processing. Academic Press, London.
Sitati, N.W., Walpole, M.J., Smith, R.J., Leader-Williams, N., 2003. Predicting spatial aspects of human-elephant conflict. Journal of Applied Ecology 40, 667–677.
Steenis, C.G.G.J.van., 1961. An attempt towards an explanation of the effect of mountain mass elevation. Proceedings of the Royal Netherlands Academy of Arts and Sciences C64, 435–442. Thomlinson, J.R., Bolstad, P.V., Cohen, W.B., 1999. Coordinating
methodologies for scaling land-cover classifications from site-specific to global: steps towards validating global map products. Remote Sensing of the Environment 70, 16–28. Widodo, S.R., and Santiapillai, C., 1992. Conservation of Sumatran