INDONESIA EXPERIENCE IN DETERMINING
INDONESIA EXPERIENCE IN DETERMINING
COUNTRY SPESIFIC EMISSION FACTOR IN
AGRICULTURE SECTOR
AGRICULTURE SECTOR
Dr. Prihasto Setyanto Prof. Dr. AK Makarim Prof. Hidayat Pawitan Prof. Iswandi Anas Dr. Le Istiqlal Amien Elza Sumaini
Formula for Estimating Rice CH Emission
Formula for Estimating Rice CH
4
Emission
•
CH
4Emission
rice= A*CF
soil*SF
water regime*EF
rice–
CH
4Emission
rice= annual methane emission from rice cultivation
(Gg CH
4/year)
(
/
)
–
A = seasonal harvested area (ha/year)
–
CF
soil= Correction factor of different soil types
–
SF
water regimewater regime= Scaling factor of different water regime. For
g
g
continuous flooded is equal to 1
Rice Emission Factors
Rice Emission Factors
• Average of
Average of
emission factor
is 169.9
kg/ha/season
80 100kg/ha/season
based on 349
field
experiments
60 q uenc yexperiments
conducted in 10
different soil
types and 3
20 40 Fr e qtypes and 3
different water
management
using 22 rice
0 0 1 00 2 00 3 00 4 00 5 00 6 00 7 00 8 00using 22 rice
varieties (all in
Java)
1 2 3 4 5 6 7 8Process of Determining Rice Area by
soil types and irrigation
Rice growing area based on Satellite assessment MoAg
M f il f M A
CF Map of soil types from MoAg
CFsoil
Map of irrigated rice area from Minist of P blic Wo k
SFwater regime
Map of district boundary Ministry of Public Work
Map of rice growing area by district according to irrigation and soil types (SNC)
and soil types (SNC)
Data of harvesting area by season reported by district to MoAg and reported by district to MoAg and Bureau of Statistic based on irrigation types
Next Step
•
Introducing new scaling factor for variety (SF
v)
and crop management (SF
cm)
•
CH
4Emission
rice= A*CFsoil*SFwr*
SF
v*SF
cm*EF
M f il t f M A
Rice growing area based on Satellite assessment MoAg
Map of irrigated rice area from Ministry of Public Work
Map of soil types from MoAg Ministry of Public Work
Map of district boundary
M f l ti b i ti
Map of planting areas by varieties
Map of planting area by crop management
This approach can assist the sector to evaluate the effectiveness of mitigation technologies intervention by district
Rice cultivation scaling factors
1. Water regimes
2 S il T
2. Soil Types
3. Rice varieties
4 O
i
tt
4. Organic matter
5. Establishment of herbicides
6 C
t bli h
t
6. Crop establishment
E
l
f d t b
f
i
GHG
i
i
Examples of database of various GHG emission
research in Indonesia (1996-2006)
1996 kg CH4/ha /season 538 6.34 Cisadane 440 5.15 Memberamo 246 4 92 IR 64Units CH4 emission Rice cultivar Water regime
Year Yield
(t/ha) References
Organic matter amendment
IAERI annual report 1996/97
246 4.92 IR 64 357 6.46 IR 36 412 3.25 Dodokan 1997 kg CH4/ha /season 461 4.03 Cisadane 215 3.86 Memberamo 194 3.56 IR 64 282 3.11 Dodokan 421 4.63 IR 72 226 5.12 Batang anai 1996 kg CH4/ha
/season 89 3.13 IR 64 no organic amendment 189 6.27 IR 64 animal manure 170 5 51 IR 64 animal manure
IAERI annual report 1996/97
170 5.51 IR 64 animal manure 165 5.90 IR 64 straw 176 4.98 IR 64 straw 156 4.71 IR 64 compost 136 4.76 IR 64 compost 1997 kg CH4/ha
/season 250 3.59 IR 64 no organic amendment 403 6.28 IR 64 animal manure 372 5.69 IR 64 animal manure 344 6.26 IR 64 straw 374 5.99 IR 64 straw 359 5.35 IR 64 compost 295 5.77 IR 64 compost
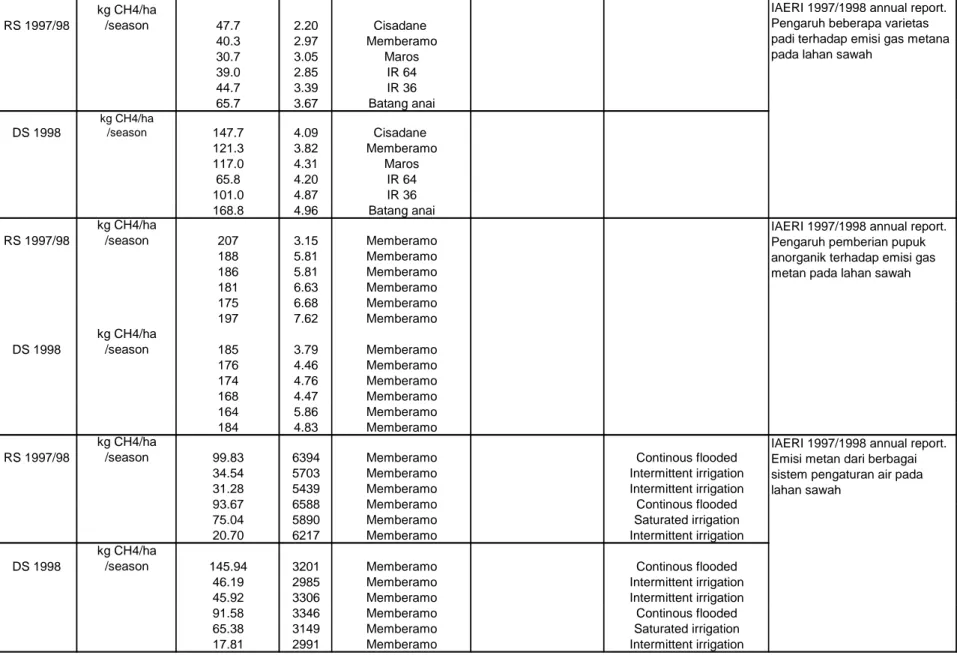
Table continued.. RS 1997/98 kg CH4/ha /season 47.7 2.20 Cisadane 40.3 2.97 Memberamo 30.7 3.05 Maros 39.0 2.85 IR 64 44.7 3.39 IR 36 65 7 3 67 B t i
IAERI 1997/1998 annual report. Pengaruh beberapa varietas padi terhadap emisi gas metana pada lahan sawah
65.7 3.67 Batang anai DS 1998 kg CH4/ha /season 147.7 4.09 Cisadane 121.3 3.82 Memberamo 117.0 4.31 Maros 65.8 4.20 IR 64 101.0 4.87 IR 36 168.8 4.96 Batang anai RS 1997/98 kg CH4/ha /season 207 3.15 Memberamo 188 5.81 Memberamo 186 5.81 Memberamo 181 6.63 Memberamo 175 6 68 Memberamo
IAERI 1997/1998 annual report. Pengaruh pemberian pupuk anorganik terhadap emisi gas metan pada lahan sawah 175 6.68 Memberamo 197 7.62 Memberamo DS 1998 kg CH4/ha /season 185 3.79 Memberamo 176 4.46 Memberamo 174 4.76 Memberamo 168 4.47 Memberamo 164 5.86 Memberamo 184 4.83 Memberamo RS 1997/98 kg CH4/ha
/season 99.83 6394 Memberamo Continous flooded 34.54 5703 Memberamo Intermittent irrigation 31.28 5439 Memberamo Intermittent irrigation 93 67 6588 Memberamo Continous flooded
IAERI 1997/1998 annual report. Emisi metan dari berbagai sistem pengaturan air pada lahan sawah
93.67 6588 Memberamo Continous flooded 75.04 5890 Memberamo Saturated irrigation 20.70 6217 Memberamo Intermittent irrigation
DS 1998
kg CH4/ha
/season 145.94 3201 Memberamo Continous flooded 46.19 2985 Memberamo Intermittent irrigation 45.92 3306 Memberamo Intermittent irrigation 91.58 3346 Memberamo Continous flooded 65.38 3149 Memberamo Saturated irrigation 17.81 2991 Memberamo Intermittent irrigation
Adjusted scaling factor for water regimes and soil
Adjusted SF Adjusted CF
Adjusted scaling factor for water regimes and soil
correction factors
Category Sub-category SF (adapted from IPCC Guidelines 1996) Adjusted SF (based on current studies in Indonesia) Adjusted CF from different soil types of Indonesia Upland None 0Lowland Irrigated Continuously Flooded 1.0 1.00
Intermittently Flooded Single Aeration 0.5 (0.2-0.7) 0.46 (0 38 0 53) (0.38-0.53) Multiple Aeration 0.2 (0.1-0.3) Rainfed Flood Prone 0.8 (0.5-1.0) 0.49 (0.19-0.75) Drought Prone 0 4 (0-0 5) (0.19 0.75) Drought Prone 0.4 (0-0.5) Deep Water Water Depth 50-100 cm 0.8 (0.6-1.0) Water Depth < 50 cm 0.6 (0.5-0.8)
Adjusted CF from different soil types of
Adjusted CF from different soil types of
Indonesia
Inceptisol
1.12
(1.0
‐
1.23)
Oxisol
0 29 (0 1
‐
0 47)
Oxisol
0.29
(0.1 0.47)
Entisol
1.02
(0.94
‐
1.09)
Vertisol
1.02
(0.46
‐
1.99)
Soil Types
(
)
Alfisol
0.84
(0.32
‐
1.59)
Histosol
2.39
(0.92
‐
3.86)
Mollisol
‐
Andisol
1,02**
Ultisol
0.29*
Distribution
of
rice
soils
of
Indonesia
No. Ecosystem / rice soil types
distribution
A Lowland
55%
A Lowland
55%
Aquept, Aquent (Alluvial and Gley soil)
B Highland
g
17%
Udept (Latosols and Regosols)
C Complex (Combination between A and B)
1 Vertisols (Grumusols) (Sub ordo Aquert, udert, and ustert)
7%
2 Ultisols and Oxisols (Red yellowish podsolic)
6%
(Sub ordo: Aquult and Paleudult Aquox and Kandiudox)
(Sub ordo: Aquult and Paleudult, Aquox and Kandiudox)
3 Alfisols (Red yellowish Mediteranean)
4%
Sub ordo udand, ustand, and aquand
,
,
q
4 Newly opened rice field: Ultisols (red yellowish podsolic)
10%
5 Newlye opened rice field: Oxisols
1%
(Latosol, lateritic)
GHG emissions from different province of Indonesia based on
soil CF and adjusted SF water regimes
j
g
Emisi GRK dari lahan sawah
6.00 7.00
Total emisi =39,63 Juta ton Co2e ≈ 1.72 Juta ton CH4
4 00 5.00 o n C o 2 e 3.00 4.00 Ju ta t o 1.00 2.00 0.00 NA D Su m u t S um bar Ri a u Ja m b i S um s e l e ngk ul u B angk a K epr i m pun g B ant en D KI J K T J abar J at en g DI Y Ja tim Bali NT B NT T Su ls e l S ul te n g Su ltr a Su lu t o ront al Su lb a r Ka lb a r Ka ls e l K al te n g K a ltim S S B e B La m B D J S G o K Propinsi
Scaling factors of CH4 emission under different
g
organic amendments based on studies conducted
in Indonesia
Organic matter Mean emission (kg
CH4/ha/musim) SD CV (%) Number of Data SF No OM 65.9 39.23 59.56 13 1.00 FYM1 149.7 93.80 62.66 31 2.27 Straw2 137.1 107.47 78.36 14 2.08 Composts3 236.5 108.03 45.68 4 3.59 Mix 21.74 FYM+straw4 70.5 15.33 4 1.07
Rice Variety average emission
(kg CH4/ha/season) SD CV (%)
Number
of Data SF
Scaling factors under different rice varieties
Gilirang 496.9 1 2.46
Fatmawati 365.9 1 1.81
Aromatic 273.6 138.87 50.8 3 1.35
established in
Indonesian rice field (based on studies at Tukad Unda 244.2 106.54 43.6 2 1.21 IR 72 223.2 133.01 59.6 5 1.10 Cisadane 204.6 133.85 65.4 14 1.01 IR 64* 202 3 165 17 81 7 164 1 00 ( IAERI) IR 64 202.3 165.17 81.7 164 1.00 Margasari 187.2 89.93 48.0 3 0.93 Cisantana 186.7 53.71 28.8 6 0.92 Tukad Petanu 157.8 32.16 20.4 2 0.78 Batang Anai 153.5 81.24 52.9 3 0.76 IR 36 147.5 121.56 82.4 5 0.73 Memberamo 146.2 99.49 68.1 64 0.72 Dodokan 145.6 144.54 99.2 6 0.72 Way Apoburu 145.5 84.21 57.9 36 0.72 Muncul 127.0 26.87 21.2 2 0.63 T kad Balian 115 6 25 87 22 4 2 0 57 Tukad Balian 115.6 25.87 22.4 2 0.57 Cisanggarung 115.2 62.77 54.5 3 0.57 Ciherang 114.8 103.14 89.8 29 0.57 Limboto 99.2 40.80 41.1 6 0.49 Wayrarem 91.6 38.09 41.6 6 0.45 Maros 73.9 61.02 82.6 2 0.37
Scalling factors under different water regimes and
herbicide application
no Application Average emission (kg
CH4/ha/season) SD CV (%)
Number of
Data SF
herbicide application
1 contherbicide flooding + 0 700.7 298.88 42.7 41 1.0 cont flooding + 2 herbicideg 266.7 243.06 91.1 78 0.4 3 intermittentherbicide + 118.2 139.65 118.2 78 0.2 4 saturatedherbicide + 65.3 52.84 81.0 78 0.1
Number
f d t
C F
C rop
t bli h
t
averag e
flux
(k /h /h i)
S D
C V
(% )
Scaling factors of CH4 flux under different crop establishment
T ransplanted
rice*
1.067
0.75
70.0
48
1.00
of
data
es tablis hment
(kg /ha/hari)
( )
Direct
s eeded
Some of the references
IAERI. 1999 annual report. Pengaruh rejim air tanah terhadap besarnya emisi gas metan pada lahan sawah. 1998/1999 annual report
IAERI. 2001. Pengaruh varietas padi terhadap besarnya emisi gas CH4 pada IAERI. 2001. Pengaruh varietas padi terhadap besarnya emisi gas CH4 pada
lahan sawah irigasi vertisol. Laporan tahunan 2001.
IAERI. 2001. Pengaruh dosis dan jenis pupuk N terhadap besarnya emisi CH4 dan N2O pada lahan sawah irigasi Vertisol. Laporan tahunan 2001p g p IAERI 2001. Emisi dan mitigasi gas CH4 dan N2O dari pengolahan tanah,
varietas dan pemberian bahan organik dalam pola tanam padi-palawija pada lahan sawah tadah hujan. Laporan tahunan 2001 IAERI. 2002. Pengaruh takaran azolla pada sistem minapadi terhadap
produktivitas dan emisi GRK di lahan sawah. Laporan tahunan 2002 IAERI. 2002. Pengaruh jenis ikan terhadap produktivitas dan emisi GRK di lahan
sawah pada sistem minapadi. Laporan tahunan 2002
Husin, Y.A. 1994. Methane flux from Indonesia wetland rice: the effects of water management and rice variety.[Disertation]
S t t P 2000 M th i i f th il t l t d ith fl d d Setyanto, P. 2000. Methane emission from three soil types planted with flooded
rice (Thesis)
Setyanto, P. 2004. Methane emission from rice field under different crop establisments and rice c lti ars [Disertation]
Continued
Setyanto, P, Makarim, A, K., Fagi, A, M., Wassmann, R, Buendia, L, V. 2000. Crop management affecting methane emission from irrigated and rainfed rice in central Java. Nutrient Cycling in Agroecosystm 58 : 85-93
S t t P S h ih A Wih dj k A K M k i 1999 P h b i Setyanto, P. Suharsih, A. Wihardjaka, A. K Makarim. 1999. Pengaruh pemberian
pupuk anorganik terhadap emisi gas metan pada lahan sawah. Risalah Seminar hasil penelitian emisi gas rumah kaca dan peningkatan
produktifitas padi di lahan sawah 36 43 produktifitas padi di lahan sawah. 36-43.
Suharsih, P. Setyanto, A.K. Makarim. 2004. Emisi gas metan pada lahan sawah irigasi inceptisol akibat pemupukan nitrogen pada tanaman padi. PP Tanaman Pangan 22 (2) : 43 47
Tanaman Pangan 22 (2) : 43-47
Suryahadi, A.R. Nugraha, R. Boer, A.Bey, 1998. Laju Konversi Metan dan Faktor Emisi pada Kerbau yang Diberi Ragi Tape Saccharomyces cerevisiae. Journal Agromet 4 : 22-30
Journal Agromet 4 : 22 30
Mulyadi, A. Pramono, Poniman dan A. Wihadjaka. 2004. Pengaruh Pupuk
Kandang Terhadap Hasil Padi Gogo Rancah dan Emisi Gas CH4 di Lahan sawah Tadah Hujan. Seminar nasional pengelolaan lingkungan pertanian. sawah Tadah Hujan. Seminar nasional pengelolaan lingkungan pertanian. 479-485.
Setyanto,P. Burhan, H., Jatmiko, S.Y. 2008. Effectiveness of water regime and soil management on methane emission reduction from rice field. Prosiding g g seminar Nasional pencemaran lingkungan pertanian melalui pendekatan pengelolaan daerah aliran sungai (DAS) secara terpadu. 219-233