You can post these at the front of the class and compare results between groups. Rewards: Coffee, juice and cookies will be served at the start of the focus group. The part of the statement presented to the student should be well defined and clear.
All prompt instructions are clear and focused on the task objectives. Did it help support one of the points you wanted to make in your paper?
Determine the Object of Analysis Based on the Questions You Want to Answer: Will you be looking for particular words or phrases, ideas, or themes? This
If the data is recorded electronically, the coding columns can be entered on the data sheet. In addition, if others are to code the transcripts, they should be instructed to use the form and be asked to code several of the same sessions. Review Transcripts and Record Responses: You are finally ready to code the data for actual use and analysis.
If you are able to have others code your data, you do want to check for consistency in using the form. Analyze your data: After all the coding is done, the data needs to be formatted so that some basic analysis can be done. If you coded on paper, the data must now be transferred to an electronic format (usually a spreadsheet).
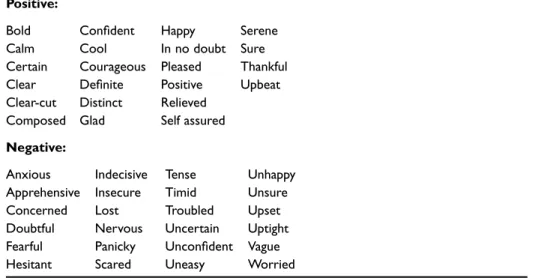
Examining the comments reveals that for the most part students feel they have an idea of how to get started, but know they need help to complete new tasks. The language technologies of SPSS Text Analysis for Surveys automate the coding process, while its manual controls allow you to manage the process and the quality of the results. The methods used will depend on the questions to be answered, the type of data collected and how the data was collected.
With inferential analysis we can make statements about the larger population based on the data collected from the sample. Although many individuals mistakenly use inferential methods, often because they want to provide some indication of the "significance" of their results, much of the data we collect when assessing information literacy should be reported only with descriptive statistics. Our focus here is on descriptive methods of data analysis, which require less planning and effort on the part of the librarian.
We define a five-step process for working with the data you've collected through surveys or objective knowledge tests.
Get Organized
At this point, you will also need to organize the rest of the data analysis process. If you have collected data from a large sample of students using tests or paper surveys, you may want to have a student assistant do the data entry. This raises the issue of protecting the identity of the students who participated in your testing or survey.
If you are interested in how the classes as a whole did on a knowledge test, there is also no need to identify the student for that type of tool. Data are often classified according to the scale of measurement: nominal, ordinal, interval or ratio. The importance of the measurement scale is that it determines which statistical techniques can be legally used. Equal differences in the numbers on an interval scale correspond to equal differences in the quantities of the measured attribute.
The units of measurement are fixed, but the zero point is arbitrary - it does not mean the total absence of the property being measured. Ratio-level measures have all the properties of an interval scale except for a real zero point, which indicates the absence of whatever is being measured. However, if you are evaluating individual performance on a test, you will need to maintain a link between a particular test and a specific student.
Keep the list of student number and names separate for your reference when identifying the students and their answers or performance. Ultimately, you'll need to decide the level of content you're going to analyze. In the example above of giving our knowledge test to four classes, you will need to decide how much of the test you want to analyze.
Are you only interested in how the classes or individual students performed on the test as a whole, on each part of the test, or on each part of the test.
Format the Data
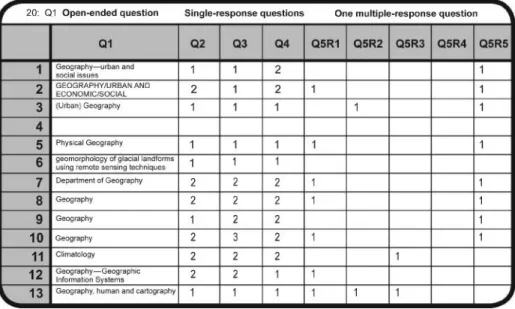
This decision will affect the way your data will need to be formatted. Once you have decided how to organize your data, you will need to code the variables so they can be tabulated and analyzed in the statistical software package you will be using. If you ask a question in a survey and offer five different answers, each one must be coded accordingly (1 for the first answer, 2 for the second, and so on).
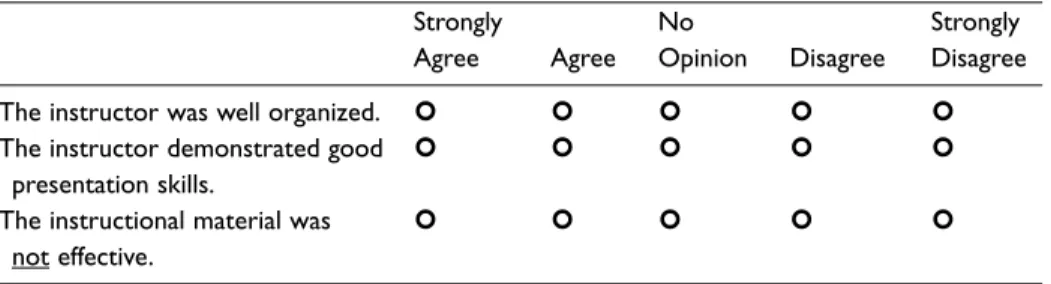
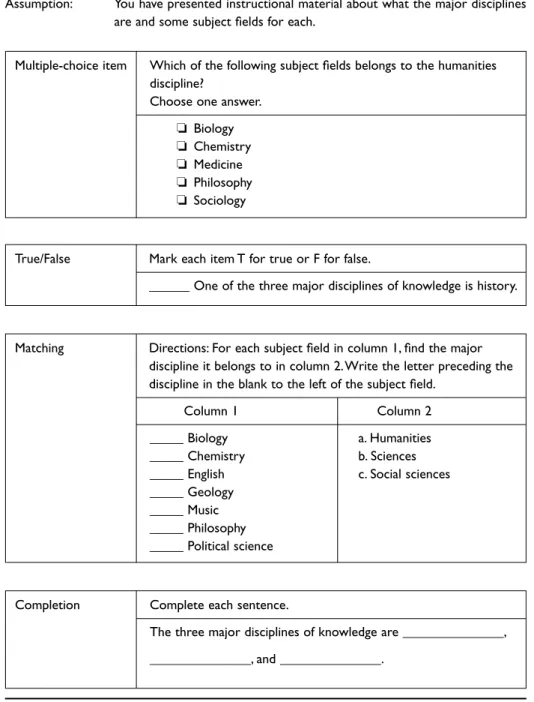
See Figure 13.7 for an example of each type of survey question and how it would be coded in your data file. Therefore, the data in each of these columns is filled in if the respondent selected that option and blank if they did not. Data verification means making sure that the recorded data you have is correct.
Regardless of who formats and enters your data, the data must be verified beforehand. To verify your quantitative data, start by scanning the data file to make sure it meets expectations. Match the number of lines (cases) in the data file to the number of students in your sample.
If the only valid options for a column are 0 and 1 and you find a pair of 4's scattered throughout the column, you should carefully check the data entry not only for that column, but for the rest of the file containing the data that you have on paper. An error while entering data in one column can easily cause problems in the rest of the columns. During the data formatting phase, the paper instruments should be kept in the order they were entered into the data file, making this comparison easier.
The Interuniversity Consortium for Political and Social Research (ICPSR) (2005) recommends comparing paper data to the data file carefully about five to ten percent of your cases as a best practice.
Selecting the Right Analysis for Your Questions
What is the average number of citations in the papers of this group of students. Central tendency and variability provide information about where the central point of a data distribution is located and how scattered the data points are. Measures of central tendency and variability can be used with data at all four levels (see Figure 13-5), but which measures are appropriate for which levels must be determined.
The mean is the calculated arithmetic mean, and so it makes more sense to use it to report on interval and ratio level data, which are numerical values. The mean takes into account all the points in the distribution, so it is the most representative measure of central tendency. However, because the mean is more sensitive to outlying data points, it should not be used to describe highly anchored data distributions.
Those outlying responses indicate that the distribution of data is skewed and that using the mean as a measure of central tendency is not appropriate. The measure of variability reported with the mean is the standard deviation, which provides the average distance of all points from the mean and thus gives you a sense of how similar or varied the responses are. The median is the physical center of a distribution, and is the preferred measure of central tendency for skewed distributions (most commonly seen when reporting monetary measures, such as income, salaries, and housing costs).
Since the data point is the one that falls in the middle of the distribution, extreme arithmetic values have less effect on the median. Median can be used for ordinal, interval, and ratio data; is more suitable than average for regular grades. The mode, the simplest measure of central tendency, is the score or value that occurs most often in your data set.
What is the strength of the relationship between class rank and knowledge of library resources.
Interpret the Results
All of the descriptive statistical analyzes described above can be run in most common statistical software packages. If you only need results at the beginning of the next academic semester, you may want to spend more time doing additional analysis. One of the reasons that we assess in the first place is to meet the ever-increasing demands for accountability.
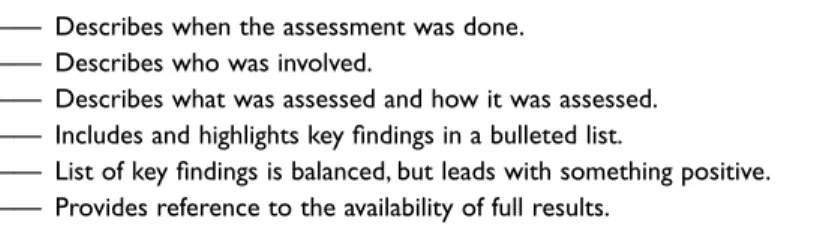
Regardless of the venue, it is necessary to at least provide a written report of your evaluation activities and findings. Unfortunately, it is also the only part of the report that many stakeholders will read. You can follow the bulleted list of key findings by referring to the availability of a more complete discussion of the findings in the Results section of the full report.
For example, there is no need for a literature review or a long introduction. If you used a tool to collect assessment data, you can organize your report around the organization of the tool. Since the executive summary has already highlighted your main findings, the full report should follow one of the organizational techniques described above and not push your main findings to the beginning of the report.
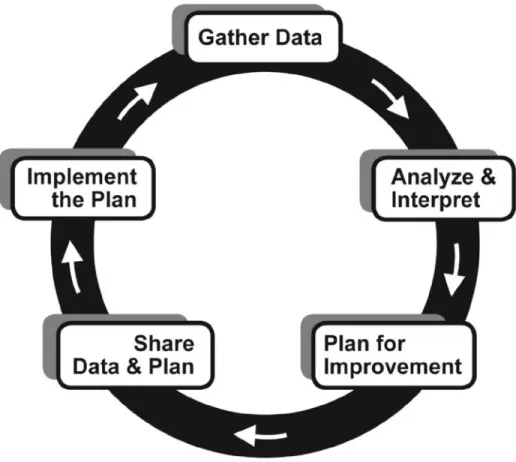
A good option with using presentation software is that you can distribute a printout of the slides as a handout. The presentation can also be shared on the library website as a more audience-specific summary of the information in your report. Plan to implement a change for the next semester and return to the evaluation phase of the cycle.
Even if you are satisfied with the quality of the data collected by your methods, you may not have used the best tool or instrument the first time.
Index
Software for collecting interview data, 68 Software for concept mapping, 111 Software for content analysis, 151–52 Software for knowledge tests, 98 Software for rubrics, 128.
About the Authors