96
Analysis of Increasing Regional Economic Competitiveness in the Agricultural Sector in Increasing Regional Economic Growth
Ilham1, Hardianti Yusuf2, Hamdani3, Nurul Hamida4
1234Institut Agama Islam Negeri Palopo
[email protected], [email protected], [email protected], [email protected].
ABSTRACT
The rate of economic growth continues to decline As a result of the declining rate of growth of gross domestic product, the number of poor people increases. Various steps have been taken by the government to increase economic growth by utilizing local resources in each region.
This study aims to explain the role of the agricultural sector in efforts to increase regional economic growth in East Luwu Regency and the competitiveness of the agricultural sector. This research uses quantitative methods with data analysis using Location Quotient (LQ), Shift Share (SS), Klassen Typology and Market Structure Analysis . The results of this study show that the LQ analysis and Klassen typology analysis show that the agricultural sector is a potential sector and can still grow. The implication of the article is that local governments must encourage agricultural productivity, transform towards agro-industry and increase market share as well as provide agricultural product processing facilities to increase product selling value,
Keyword : Economic Growth, Competitiveness, Agricultural Sector
INTRODUCTION
Regional economic development is a process of regional government and all aspects of society in managing available resources so that a pattern of cooperation is formed in realizing the birth of new jobs and stimulating the development of economic activity in that area. High economic growth is a reference for measuring the success of development in an area, as well as economic structure and reduced income inequality between communities, regions and various sectors. The majority of Indonesia's population themselves work as farmers, but there is a fact that the level of agricultural productivity itself has not reached expectations because today the quality of Human Resources (HR) that we have is still lacking and the knowledge that people have about managing agricultural land is still lacking.
According to Safitri in a research journal conducted by Ristanti and Handoyo (2017) said the implementation of regional autonomy has reached a new era after the government and the People's Representative Council (DPR) agreed to pass Law (UU) No. 32 of 2004 concerning regional government and Law No. 32 of 2004 concerning financial balance between the central and regional governments which states that regional governments are given wide-ranging authority to regulate and manage all government affairs based on regional autonomy in improving people's welfare and increasing regional competitiveness .
South Sulawesi Province itself consists of 24 Regencies/Cities where the majority of the people work in the agricultural sector. To this day, the agricultural contribution is still a leading sector that makes a major contribution to the regions in supporting the district/city economy. In South Sulawesi
97 Province, East Luwu Regency is the area that is in second position in North Luwu Regency through expansion by dividing which led to the formation of East Luwu Regency which was later formalized in Law no. 7 in 2003 to be precise on February 25 2003. It is one of the areas where regional autonomy has been implemented, in order to advance the region the East Luwu Regency government has the authority to develop and realize its own strategies that will be implemented later. The economic design of East Luwu Regency relies on two sectors, namely the agricultural sector and the mining sector.
A number of studies have shown that the agricultural sector has such an important and significant role in efforts to increase economic growth. Maranata, Erfit and Candra Mustika (2019), the results of their research explained that the agricultural sector was able to provide a large role for the economy in Muaro Jambi Regency and became the base or leading sector during the 2001-2015 period with an average LQ value of 1.17. Ni Komang Ayu Fitri Adi Cahyani, Dewi Putra Darmawan, Gede Mekse Korri Arisena (2021) whose research results explain that the agricultural sector is not only able to meet the needs of Tabanan Regency but is also able to meet the needs of other regions. The results of the shift share analysis of the agricultural sector in Tabanan Regency fall into the category of slow regional growth and fast competitiveness as indicated by negative proportional shift values and positive differential shifts.
Likewise (Arifin, 2021) shows that the agricultural sector is one of the mainstay sectors of Mempawah Regency in increasing economic growth. Unlike the research conducted by Francisca Wenny Astriani Widya Sari and Rita Herawaty Br Bangun (2019), the results of her research show that the development of the agricultural sector's contribution to the gross regional domestic product of Deli Serdang Regency in 2013-2017 has a tendency to decrease from year to year due to the transformation structural.
Based on data from the Central Statistics Agency (2022) the 2021 gross regional domestic product growth rate at constant 2010 prices South Sulawesi Province experienced an increase of 4.65%, this value is not comparable to the economic growth rate of East Luwu Regency which experienced a contraction of -1.39 %. As a result of the declining rate of growth of gross domestic product, the number of poor people in East Luwu Regency in 2021 will reach 20.99 thousand people. This figure also increased compared to the previous year. Compared to the percentage of poor people in other districts/cities, East Luwu Regency is ranked 7th with the lowest percentage of poor people in South Sulawesi Province.
Therefore, this study intends to examine the problems of economic growth in East Luwu which has experienced a decline in the regional economic growth rate for a decade, especially in 2016-2020 plus in 2021 it will reach -1.39%, while at the national level and the province's growth rate has started to improve. The purpose of this study was to determine the role of the agricultural sector in efforts to increase regional economic growth in East Luwu Regency and the competitiveness of the agricultural sector in East Luwu Regency with several regions in South Sulawesi.
LITERATURE REVIEW Economic Growth
According to Rapanna in the research journal Jeni Palindangan Abu Bakar (2021) economic growth is the process of increasing the production capacity of an economy which is manifested in the form of increasing national income. For a country, economic growth is one of the focuses that must be achieved every year. The economic growth rate in a country will be a measure of success (Salim & Fadilla, 2021).
98 Boediono in the research journal Afandi (2021) states that economic growth is the level of increase in national income. Thus, economic growth is a process of increasing per capita output in the long run and is a measure of development success. The implementation of economic growth is generally measured using the Gross Regional Domestic Product (GRDP).
GRDP is one of the important indicators to determine the economic conditions in a region in a certain period, either at current prices or at constant prices. GRDP is basically the total added value generated by all business units in a certain area, or is the total value of final goods and services produced by all economic units in an area (Prasetyo, 2016).
Competitiveness
According to Laili (2021) Competitiveness is a concept used in assessing the ability of a region or country to produce goods or products that are superior to those of other regions or countries. Cahyo in his research journal Bomantara 2020) said that competitiveness is very important for every country. The high competitiveness of a country will have implications for increasing economic growth and welfare.
Agriculture Sector Agriculture
is a type of production activity that is based on the growth process of plants and animals (Nadziroh, 2020). Khatimah and Mudmainah (2022) also describe that agriculture in the narrow sense is called smallholder agriculture, while in the broad sense it includes agriculture in the narrow sense, food crops, forestry, animal husbandry, plantations, and fisheries.
The relationship between the agricultural sector and the Gross Regional Domestic Product (GDP), the agricultural sub-sector is a sector that has links to the figures obtained in GRDP, the agricultural sector also has links and contributes to other sectors, for example equal distribution of labor (Nadziroh, 2020). One of the reasons why the agricultural sector has links with other sectors is because most of the industrial raw materials come from the agricultural sector. Rice commodity is one type of plant needed by the industrial sector for food.
METHODE
This research uses a descriptive research type using a quantitative research approach, in which quantitative research is systematic research conducted on phenomena to collect data that can be measured using statistics, mathematics, and computation.
This study uses GRDP data in East Luwu Regency and GRDP for South Sulawesi Province (2012-2021). The data sources used are secondary data, namely from the official website of the Central Statistics Agency for East Luwu Regency and the Central Statistics Agency for South Sulawesi Province for 2012-2021. While collecting data using documentation and literature study techniques.
99 This study uses documentation as an instrument. Documentation is a data collection technique by relying on documents which are then used as research data sources. The documents used can be in the form of film sources, photos or drawings, and writing. In the research, the documents used as data sources are GRDP data for East Luwu Regency for 2012- 2021, as well as a Literature Study taken directly from the official website of the Central Bureau of Statistics for East Luwu Regency, South Sulawesi Province, and also the official website of the Regional Government Service according to the title study. While the data analysis uses;
1. Location Quotient (LQ),
Analysis Location Quotient is a basic economic theory that has a reference point or core in the base sector that produces products that can meet the needs of their own regions or are sold outside the region, with sales outside the region, later able to provide additional income for the area.
Where:
GRDP s,I is sector i GRDP in Kab. East Luwu certain year;
∑PDRB, i is the total GRDP of sector I in Kab. East Luwu in a certain year;
GRDP ss,i is sector i GRDP in South Sulawesi Province in a certain year;
∑PDRB s
s, i is the total GRDP of sector i in South Sulawesi Province in a given year.
Based on the results of the Location Quotient or LQ calculation, it can be interpreted:
LQ> 1 means that the commodity is a superior commodity; LQ<1 means that the commodity is not a superior commodity; LQ=1 means that this commodity can only meet the needs of East Luwu Regency.
2. Shift Share (SS),
Analysis Shift Share is an analysis used to determine the performance and productivity of regional economic work by comparing it with other larger regions (regional or national).
According to Prasetyo Soepomo in Novita the general form of the shift share and its components are:
Diij = Nij + Mij Nij =Yij . rn Mij =Yij (rin - rn) Cij = Yij (rij – rin)
Where:
100 i : are the economic sectors studied;
j : is the area variable studied in East Luwu Regency;
Dij : is the change in sector I in area j (East Luwu Regency);
Nij : is the national growth in sector i area j (East Luwu Regency);
Mij : is the industrial mix of sector i in area j (East Luwu Regency);
Cij : is the competitive advantage of sector i in area j (East Luwu Regency);
Eij : is the GRDP of sector i in area j (East Luwu Regency);
Rij : is the average growth rate of sector i in area j of East Luwu Regency;
Rin : is the growth rate of sector i in region n (South Sulawesi Province); and Rn : is the GRDP growth rate in region n (South Sulawesi Province).
3. Klassen Typology,
Typology Analysis is an analytical tool used to see an overview of the pattern and structure of economic growth in each region. Basically, the Klassen Typology describes regions based on categories, namely regional economic growth and regional income: (1) developed and rapidly growing regions, (2) developed but depressed regions, (3) potential/still capable of developing regions, (4) relatively left behind.
4. Market Structure Analysis. Market
structure analysis is divided into 4, namely: 1) Perfect Competition Market, 2) Monopoly Market, 3) Monopolistic Competition Market, 4) Oligopoly Market. Several methods are used to see the level of market concentration, namely:
a) (Market Concentration Ratio (CR4) Where:
<40% : is a low concentration, tends to be perfect competition;
41% - 70% : is a moderate concentration, tends to be oligopoly;
>70% : is a high concentration, the oligopoly market tends to be monolopy.
b) Herfindahl-Hierschmann Index (IHH), where:
0-1500 : is a competitive market, tends to be perfect competition;
1500-2500 : is a moderately concentrated market, oligopoly;
2500-10000 : is a highly concentrated market, oligopoly leads to monopoly.
RESULTS
East Luwu Regency's Economic Growth Rate
101 Based on the results released by the East Luwu Central Statistics Agency for 2021, East Luwu's economic growth is at -1.39%.
Figure 1: Economic Growth Rate of East Luwu Regency and South Sulawesi Province (%) 2012-2021
Source: (East Luwu Central Bureau of Statistics, 2022)
Based on Table 4.4 it can be seen that in the last 6 years, the East Luwu Regency economy has fluctuated which is always grow under the graph of economic growth in South Sulawesi Province. East Luwu's economic growth for the last 6 years has always been at 3.5- 5% and has never exceeded this value. Seen in Figure 1, East Luwu Regency has never competed with the economic growth of South Sulawesi Province. Thus showing that the performance of poor economic performance.
GRDP growth rate at constant prices in 2010 East Luwu Regency Agriculture and Mining Sector in 2012-2021 saw fluctuations starting from 2012 which was 5.62%, continued to increase to 6.3% and continued to rise until it was able to reach 8.1% that surpasses the economy of South Sulawesi Province. Whereas in 2015 it actually decreased until it fell very far in 2016, namely 1.58, which continued to decrease until in 2021 it reached a minus figure of 11.39%.
1.06 1.66
0 . 3 9
- 0.
1 6
- 0.
2 5
20 12
20 13
20 14
20 15
2 0 1 6
2 0 1 7
2 0 1 8
2 0 1 9
2 0 2 0
2 0 2 1
- 2,
2 3
- 2 . 6 9
102 Figure 2: GRDP Growth Rate at Constant Prices 2010 East Luwu Regency Agriculture and Mining Sector (%) 2012-2021
GRDP growth rate fluctuations occur as a result of being influenced by fluctuations in nickel prices on the world market and nickel production at PT. Vale Indonesia Tbk, which is a nickel mining company operating in East Luwu. Likewise with the production of the agricultural sector which is the second largest sector which has a large contribution, the amount of production fluctuates every year.
Location Quotient Analysis (LQ)
In this analysis the data used is GRDP data at constant 2010 prices according to business fields of East Luwu Regency and South Sulawesi Province using the formula:
The criterion for the results of this calculation is that if LQ> 1 it means that the sector is classified as a base sector or a growth source sector. But on the contrary, if the LQ value <1 means that the sector is non-basic or the sector is only able to meet its own needs. From the results of the calculation of LQ of East Luwu Regency using data from GRDP according to constant prices in 2010, they are as follows:
Table 1. Results of Location Quotient
of Business Fields
201 2
201 3
201 4
201 5
201 6
201 7
201 8
201 9
202 0
202 1
LQ
Agriculture 0.7 9
0.7 9
0, 78
0.8 1
0.9 0
0.9 0
0.95 0.99 0.97 1.0 1
0.8 9
Mining and Quarrying
9.8 7
9.9 6
9.7 0
9.5 7
8.9 0
9.8 4
10.
09
10 .11
10.0 0
9.8 4
9.7 9
Processing Industry
0.1 7
0.1 8
0.1 8
0.1 8
0.2 2
0.2 0
0.2 2
0.2 4
0.24 0.2 6
0.2 1 Electricity and
Gas
Procurement
0.5 1
0.5 3
0.5 1
0.5 5
0.6 8
0.6 3
0.6 4
0.6 7
0.67 0.6 8
0.6 1
Water Supply, Waste Managemen t, Waste
0.0
5
0.0 5
0.0
5
0.0 5
0.0
7
0.0 6
0.0
6
0.0 7
0.07
0.0 8
0.0
6
103 and
Recycling
Construction 0.6 1
0.6 2
0.5 9
0.6 0
0.7 5
0.6 4
0.6 6
0.7 0
0.70 0.7 7
0.6 6 Wholesale
and Retail Trade, Car and Motorcycle
0.2
3
0.2 4
0.2
3
0.2 3
0.2
9
0.2 5
0.2
5
0.2 7
0.27
0.2 9
0.2
5
Transportation and
Warehousing
0.1 4
0.1 4
0.1 5
0.1 5
0.1 6
0.1 6
0.1 7
0.1 9
0.21 0.2 2
0.1 7
Provision of accommodat ion and food and drink
0.0
9
0.1 0
0.1
0
0.1 0
0.1
1
0.1 1
0.1
1
0.1 2
0.12
0.1 2
0.1
1
Information and
Communication 0.2
1
0.2 1
0.2 1
0.2 2
0.3 2
0.2 4
0.2 5
0.2 6
0.26 0.2 7
0.2 5
Financial Services and Insurance
0.2 1
0.2 2
0 .23
0.2 3
0.2 5
0.2 3
0.2 4
0.2 6
0.26 0.2 9
0.2 4
Real Estate 0.4 0
0.4 1
0.4 2
0.4 2
0.5 3
0.4 8
0.5 0
0 .48
0.54 0.5 9
0.4 8 Company
Services
0.0 9
0.0 9
0.0 9
0.0 9
0.1 0
0.1 0
0.1 0
0.1 1
0.11 0.1 1
0.1 0 Government
Administrati on, Defense , And
0.4
0
0.4 1
0.4
0
0.4 1
0.5
1
0.4 9
0.4
9
0.5 0
0.48
0.5 3
0.4
6
104 Compulsory
Social
Education Services
0.2 9
0.3 2
0.3 1
0.3 1
0.3 9
0.3 3
0.3 4
0.3 6
0.35 0.3 8
0.3 4
Health Services and
Social
0.5 7
0.5 8
0 .56
0.5 6
0.7 7
0.6 1
0.6 3
0.6 7
0.67 0.7 2
0.6 4
Other services 0.0 7
0.0 7
0.0 7
0.0 7
0.0 8
0.0 8
0.0 8
0 .08
0.08 0.0 8
0.0 7
Based on the table, the results of calculating the LQ analysis of East Luwu Regency in the economic sector by business field are:
1. The agriculture, forestry and fisheries sectors have an average value of 0.89 <1. This means that the agricultural sector is a non-basic sector because the value of LQ<1 even though it increases every year;
2. The mining and quarrying sector has an average value of 9.79>1. This means that the mining and quarrying sector is included in the base sector because the value of LQ>1;
3. The processing industry sector has an average value of 0.21 <1. This means that the manufacturing industry sector is included in the non-basic sector because the LQ value <1;
4. The electricity and gas procurement sector has an average value of 0.61<1. This means that the electricity and gas procurement sector is included in the non-base sector because the LQ value <1;
5. The water supply, waste management, waste and recycling sectors have an average score of 0.06<1. This means that the water supply, waste management, waste and recycling sectors are included in the non-basic sector because the value of LQ<1;
6. The construction sector has an average value of 0.66<1. This means that the construction sector is included in the non-basic sector because the LQ value <1;
105 7. The wholesale and retail trade, car and motorcycle repair sectors have an average value of 0.25<1. This means that the wholesale and retail trade sector is included in the non-basic sector because the LQ value <1;
8. The transportation and warehousing sector has an average value of 0.17<1. This means that the sector is included in the non-basic sector because the value of LQ<1;
9. The accommodation and food and drink provision sector has an average value of 0.11<1. This means that the accommodation and food supply sector is included in the non-basic sector because the LQ value is <1.
10. The information and communication sector has an average value of 0.25<1. This means that the information and communication sector is included in the non-basic sector because the value of LQ<1;
11. The financial services and insurance sector has an average value of 0.24<1. This means that the financial services and insurance sector is included in the non-basic sector because the LQ value <1;
12. Real estate sector has an average value of 0.48<1. This means that the real estate sector is included in the non-basic sector because the value of LQ<1;
13. The company's service sector has an average value of 0.10<1. This means that the company's service sector is included in the non-basic sector because the value of LQ<1;
14. The government administration, defense and social security sectors are required to have an average value of 0.46<1. This means that the government administration, defense and social security sectors must be included in the non-basic sector because the LQ value <1;
15. The education services sector has an average value of 0.34<1. This means that the education services sector is included in the non-basic sector because the value of LQ<1;
16. The health services sector and social activities have an average value of 0.64<1. This means that the health services sector and social activities are included in the non- basic sector because the LQ value <1;
17. The other service sector has an average value of 0.07<1. This means that other service sectors are included in the non-basic sector because the LQ value <1.
Based on the LQ analysis of East Luwu Regency in Table 4.2, it has an LQ value <1, that is, almost all sectors in GRDP except the mining sector. The mining and quarrying sector dominates in East Luwu Regency with an LQ>1 value of 9.79. Thus this shows that the mining
106 and quarrying sector makes a major contribution to the formation of the East Luwu economy, besides being able to meet regional needs it is also capable of exporting. However, in recent years there has been a decline in total production reaching -7.81 in 2021. This is what then causes East Luwu's economic rate to fluctuate because most of East Luwu's GRDP is dominated by mining products.
The agricultural sector (A) became the second highest sector after the mining sector which made a large contribution compared to other sectors which continued to grow positively by 4.19%. But unfortunately it is still classified as a non-basic sector because the LQ value <1 is 0.89 meaning that the sector is only able to produce to meet its own needs, so it is necessary to import from areas outside East Luwu at 0.11%. In addition to the agricultural sector, the non-basic sector is also growing, namely the manufacturing sector (C) 6.58%, the water and waste procurement sector (E) 11.76%, the construction sector (F) 7.65%. The remaining 12 other non-base sectors did not experience significant growth.
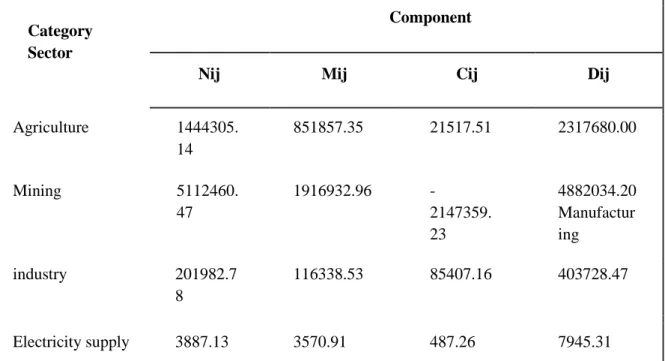
Shift Share (SS)
Analysis Based on the results of the Shift Share that has been carried out, it has been shown that within a period of 10 years, namely 2012-2021, the sectoral GRDP value owned by East Luwu Regency has witnessed a development or change. The GRDP figure grew to reach 10,613,118.90 million. This is inseparable from the interference of the components of national growth (Nij), industry mix (Mij), and competitive advantage (Cij). It can be seen in table 3 the results of the calculation of the Shift Share East Luwu Regency
Table 2. Calculation results of East Luwu Regency Shift Share Value 2012-2021 (Million Rupiah)
Category Sector
Component
Nij Mij Cij Dij
Agriculture 1444305.
14
851857.35 21517.51 2317680.00
Mining 5112460.
47
1916932.96 -
2147359.
23
4882034.20 Manufactur ing
industry 201982.7
8
116338.53 85407.16 403728.47
Electricity supply 3887.13 3570.91 487.26 7945.31
107
Water 583.42 270.84 251.14 1105.40
Construction 59013 supply1087
044.75
.96 - 6157.60
Trade
269031.91 237742.5
5
-18454.58 488319.88 Transportati on
45124.37 11064.28 23493.26 79681.91 Provision
of
accommodation
10326.66 5952.76 1493.71 1493.71
Information 102841.8
3
131668.47 17434.39 251944.70
Financial services 61791.84 40440.44 8435.65 110667.93
Real 119239.0
0
77428.98 9829.32 -Company
services 3278.74 246497.30 estate292.9
6
5095.42
administration Government
163817.7 9
79572.78 18030.94 261421.50
Educational services
132894.9 1
109471.44 9556.43 251922.78
Health services 86913.24 99233.06 2110.06 1883.06
Other services 7242.57 5617.12 -7 89.09 12,070.61
Total 8,355,860
.18
4,192,335.9 2
-
1,935,007.
21
10,613,188.
90
Statistics for East Luwu, 2022) Data is processed
108 ofthe sub-sector has a positive value, this explains that all GRDP sub-sectors of East Luwu Regency are growing faster than the average growth of South Sulawesi Province.
Likewise, in the Mij column all sub-sectors are positive, this means that the GRDP sub-sector of Kab. East Luwu is growing faster than the overall growth.
In the Cij Column there are 12 sub-sectors with positive values, namely (1) Agriculture, Livestock, Forestry and Fishery, (2) Processing Industry (3) Electricity, Gas and Clean Water, (4) Water Procurement; Garbage, Waste and Recycling Management, (5) Transportation and Warehousing, (6) Provision of Accommodation and Food and Drink, (7) Information and Communication, (8) Financial Services, (9) Real Estate (10) Government Administration, Defense , and Compulsory Social Security, (11) Education Services (12) Health Services and Social Activities. This means that the twelve GRDP sub-sectors of Kab. East Luwu has good competitiveness compared to other GRDP sectors in Kab. East Luwu
The remaining 5 sub-sectors are negative, namely (1) Mining and Quarrying, (2) Processing Industry (3) Construction, (4) Trade, Hotels and Restaurants, (4) Corporate Services, (5) Other Services. Sothat this sector does not have competitiveness in GRDP. Regency. East Luwu.
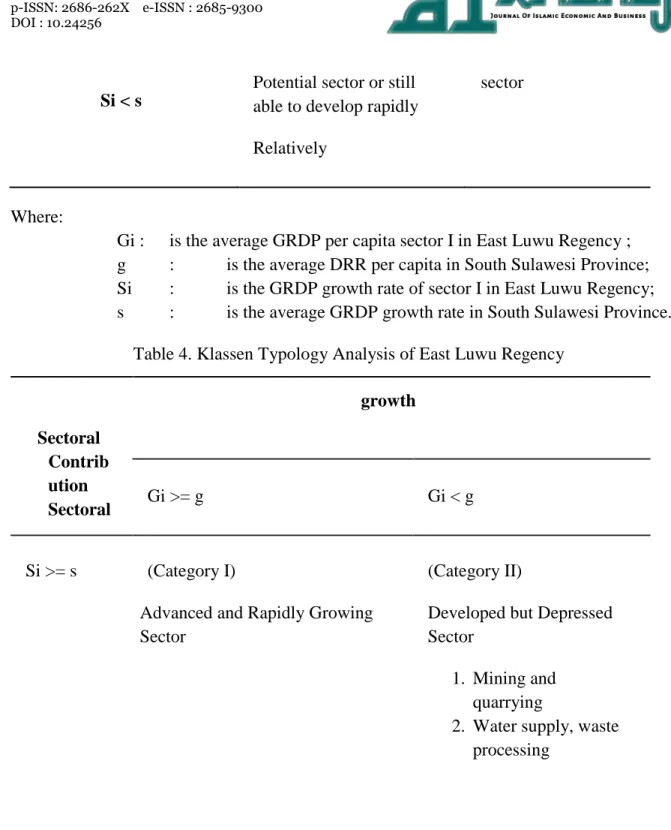
Klassen Typology
To find out the image of the pattern and structure of regional economic growth and regional per capita income which is divided into four economic groups from each sector in East Luwu Regency, this research uses a Klassen typology analysis. The Klassen typology basically divides the area based on two main indicators, namely, the economic growth of East Luwu Regency and the per capita income of South Sulawesi Province as the vertical axis and the average per capita income as the horizontal axis.
Table 3. Typological Classification of
GRDP Per Capita
Growth rate
Gi > g Gi < g
Si > s Advanced sector and growing
rapidly Advanced
sector but depressed
109 Si < s
Potential sector or still able to develop rapidly Relatively
sector
Where:
Gi : is the average GRDP per capita sector I in East Luwu Regency ; g : is the average DRR per capita in South Sulawesi Province;
Si : is the GRDP growth rate of sector I in East Luwu Regency;
s : is the average GRDP growth rate in South Sulawesi Province.
Table 4. Klassen Typology Analysis of East Luwu Regency
Sectoral Contrib ution Sectoral
growth
Gi >= g Gi < g
Si >= s (Category I)
Advanced and Rapidly Growing Sector
(Category II)
Developed but Depressed Sector
1. Mining and quarrying
2. Water supply, waste processing
110 Si < s (Category III )
Potential Sectors Or Still Developing
1. Agriculture
2. Processing industry
3. Procurement of electricity
and gas
4. Construction
5. Transportation
and
warehousing
6. Provision of
accommodation
7. Information and
communication
8. Financial services
9. Real estate
10. Administration 11. Educational services
(Category IV)
Relatively Underdeveloped Sector
1. Trade
2. Corporate services 3. Health
services and social activities 4. Other services
The results obtained show that of the 17 GRDP sub-sectors of Kab. East Luwu has 2 sub-sectors located in Quadrant II which are categorized as Advanced but Depressed Sectors, namely the Mining and Water Procurement sub-sector. 11 Sub-sectors located in Quadrant III which are categorized as potential sectors, namely 1) Agriculture 2) Manufacturing industry, 3) Electricity and gas procurement, 4) Construction, 5) Transportation and warehousing, 6) Provision of accommodation, 7) Information and communication , 8) Financial services, 9) Real estate, 10) Administration 11) Educational services. 4 Sub-sectors located in Quadrant IV which are categorized as Relatively Disadvantaged sectors, namely 1) Trade, 2) Corporate services, 3) Health services and social activities, 4) Other services
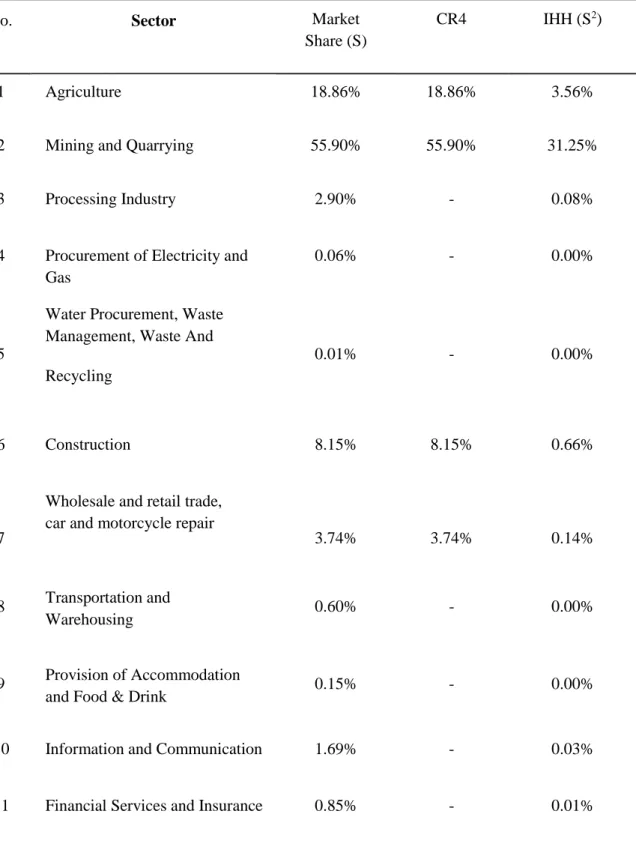
111 Market Structure
Analysis Market Structure Analysis for East Luwu Regency in 2012-2021 can seen in the following table:
Table 5. Market Structure Analysis for East Luwu Regency in 2012-2021
No. Sector Market
Share (S)
CR4 IHH (S2)
1 Agriculture 18.86% 18.86% 3.56%
2 Mining and Quarrying 55.90% 55.90% 31.25%
3 Processing Industry 2.90% - 0.08%
4 Procurement of Electricity and Gas
0.06% - 0.00%
5
Water Procurement, Waste Management, Waste And Recycling
0.01%
-
0.00%
6 Construction 8.15% 8.15% 0.66%
7
Wholesale and retail trade, car and motorcycle repair
3.74%
3.74%
0.14%
8 Transportation and
Warehousing 0.60% - 0.00%
9 Provision of Accommodation
and Food & Drink 0.15% - 0.00%
10 Information and Communication 1.69% - 0.03%
11 Financial Services and Insurance 0.85% - 0.01%
112
12 Real Estate 1.72% - 0.03%
13 Corporate Services 0.04% - 0.00%
14
Government Administration, Defence, and Compulsory Social Security
2.04%
-
0.04%
15 Education Services 1.88% - 0.04%
16 Health Services and Social
Activities 1.30% - 0.02%
17 Other Services 0.10% - 0.00%
18 Total 100% 86.65 % 3586
In Table 5 we can see that the market shareof17 sectors in East Luwu Regency is 55.90% controlled by the mining and quarrying sector while the agricultural sector only controls 18.86%. Other sectors only control 0-3% market share. Furthermore, in the concentration ratio table (Concentration Ratio/ CR) there are four sectors that have the largest market share, namely the agricultural sector 18.86%, the mining sector 55.90%, the construction sector 8.15%, and the wholesale and retail trade sector 3.74 %. Of the four sectors, the results of CR4> 70%, namely 86.65%, which means high concentration, oligopoly market leads to monopoly.
DISCUSSION
The Role of the Agricultural Sector in Efforts to Increase Regional Economic Growth in East Luwu Regency
Based on the Location Quotient (LQ) analysis in Table 4, it can be seen that of the seventeen sectors in the PDRB of East Luwu Regency the mining and quarrying sector is the only sector basis with an LQ indicator value > 1 which is equal to 9.79. While the agricultural sector has an LQ indicator value of <1, namely 0.89, this means that the agricultural sector is a non-basic sector. From the explanation above, it can be concluded that the economic growth of East Luwu Regency is dominated by the mining sector. If the mining sector at the global level decreases, it will also have an impact on the regions. This happened because East Luwu depended too much on the production of the mining sector for the economy, so that the sector
113 that played a major role in the economic growth of East Luwu Regency was the mining sector.
PT Vale is a privately owned mine that has been operating in East Luwu for a long time and has become a magnet for investors to enter East Luwu and invest heavily in the sector.
This research is in line with the research conducted by M. Syahrur Rohman with the research title "The Role of the Agricultural Sector in Regional Development of East Oku Regency"
where this research both examines the role of the agricultural sector in the regional economy.
In the research conducted by M. Syahrur Rohman the agricultural sector in East Oku Regency is a leading sector so that it has a very important role in the formation of GRDP. This looks at the extent of agricultural land and commodity products produced which are competitive but whose growth is still slow and explains which sub-sectors later become the leading sub-sectors in supporting the economic growth of East Oku Regency. The difference with this study is that the agricultural sector is a non-basic sector but is experiencing rapid growth compared to other sectors. Even though there are several commodities that have competitiveness, the products produced are sold in the form of raw products so that they have a low selling value and the production costs incurred are still very high which results in a small profit.
This research is in line with the Comparative Advantage theory put forward by JJ Mill Ricardo which says the price and value of a product is determined by the amount of processing time required and the number of workers owned to produce it. So Ricardo assessed that the level of efficiency and productivity of workers influences the creation of excellence in a country or region in producing goods so that they have competitiveness. Even though these three commodities are competitive commodities, the price and value of the products they produce are still low, because so far these commodity products have been sold in raw conditions, thereby reducing the value added to the products. This is due to the lack of processing facilities for these commodities, for example the pepper/pepper that is sold is still in the form of granules so that it does not have added value if it is sold in the form of powder or other processed pepper, of course the selling value will be higher. Likewise with rice and palm oil, even though there are three palm oil processing factories in East Luwu Regency, they are not yet efficient in increasing income/profit. Because the production costs used in producing goods/services are still very high. This is because the operating factories still use a workforce of experts in certain fields so that the production costs used are still high. This is influenced by the low quality of human resources owned.
Although currently there are a number of private companies established in East Luwu Regency, namely palm oil factories, the expert workforce they have is still taken from outside because the human resources we have are still lacking, this is what causes the required production costs to be still high so that the income earned is still low. low. Even though the amount of agricultural land owned by East Luwu Regency is wide and several commodities dominate the agricultural products produced, the profits derived from this agricultural sector are still low because of the high production costs, this causes the sector to still be included in the non-basic sector with a small GRDP contribution. low, so that it has not been able to significantly help increase the economic growth of East Luwu Regency, in contrast to the mining sector which is
114 a base sector which is able to make a large contribution to GRDP and is able to export the products it produces.
The Competitiveness of the Agricultural Sector Against Other Sectors
In the East Luwu Regency GRDP table for the last 10 years, the agricultural sector has become the second sector that supports the formation of GRDP after the mining and quarrying sector.
However, in the Location Quotient analysis it turns out that the agricultural sector is a non- basic sector with an LQ<1 indicator value of 0.89. Even though it is included in the non-base sector, in Shift Share analysis the agricultural sector has experienced a rapid growth rate compared to other sectors and has a positive competitive advantage. That is, if a region gains progress in accordance with its position in the national economy, it means that there will be a shift in the results of regional economic development. In the industry mix value column (Mij) all sectors including the agricultural sector also have a positive value, meaning that sector growth in East Luwu GRDP leads to relatively good economic growth.
Even though the mining sector has the first largest contribution to East Luwu's GRDP, its competitive advantage is still weak compared to the value of the Mij indicator (-) with the same sector at the provincial level. However, the good news is that the agricultural sector has a positive or good competitive advantage compared to the same sector at the regional and provincial levels. In the Klassen Typology analysis in Table 5 it can be seen that the agricultural sector is included in category III, which is a potential sector or can still develop. The agricultural sector in East Luwu Regency itself is a sector that has high potential to be developed, how can it not be, with large agricultural land the majority of the people work as farmers, the commodities produced are quite diverse, this will certainly become a valuable asset in the future if it is managed better. For this reason, the convenience of financial institution products to support the farmer's economy is also very much needed to increase the potential of the agricultural sector in East Luwu Regency in the future. The need for encouragement for agricultural products and productivity requires the Regional Government of East Luwu Regency to pay more attention to the agricultural sector so that it does not depend continuously on the mining sector. Attention and work assistance, provision of agricultural product processing facilities to increase the selling value of the product.
CONCLUSION
The agricultural sector in East Luwu Regency's GRDP does provide the second largest contribution after the mining sector but after LQ analysis the LQ indicator value <1 is 0.89 and is a non-basic sector. This sector can become a leading sector, but based on the analysis of the CR4 ratio and the IHH index both indicate an oligopoly market with a very high market concentration size leading to monopoly. This is caused by the East Luwu government which only focuses its development on one sector, namely the leading sector. The agricultural sector is a promising sector if managed properly in the Klassen Typology analysis the agricultural sector is a potential sector and can still grow.
115 The practical implication of this research is that the local government must encourage agricultural production and productivity, transform towards agro-industry and increase the mask share as well. And there is also a need for BUMN companies to be built to minimize high production costs. As well as the need to increase the focus of attention and work assistance, provision of agricultural product processing facilities to increase the selling value of products, agricultural equipment technology assistance, formation of farmer groups, provision of subsidized seeds and fertilizers, ease of financial institution products to support the farmers' economy, is also urgently needed. For further research development, it has contributed to increasing the rate of economic growth caused by the agricultural sector.
REFERENCE
Affandi, Hamzah, A., & Risma, O. R. (2021). Analisis Pertumbuhan Ekonomi Indonesia Tahun 1994-2020. Jurnal Bisnis Dan Kajian Strategi Manajemen, 5(1), 49–56.
Arifin, A. (2021). Analisis Daya Saing dalam strategi Pengembangan Kompetensi Daerah : Studi Kasus di Kabupaten Mempawah Kalimantan Barat. Intelektiva: Jurnal Ekonomi,
Sosial & Humaniora, 2(06), 29–38.
https://www.jurnalintelektiva.com/index.php/jurnal/article/view/394/272,
Badan Pusat Statistik Luwu Timur. (2022). Kabupaten Luwu Timur Dalam Angka 2022. In Bps Kabupaten Luwu Timur.
Bomantara M.E. Wowor, Paulus Kindangen, J. P. (2020). Analisis Daya Saing Produk Pada Usaha Kecil Menengah The Mango Manado. Jurnal EMBA: Jurnal Riset Ekonomi, Manajemen, Bisnis Dan Akuntansi, 8(4), 538–548.
Francisca Wenny Astriani Widya Sari, R. H. B. B. (2019). Analisis peranan sektor pertanian, kehutanan dan perikanan pada perekonomian kabupaten deli serdang. Jurnal Agroland, 26(3), 198–211.
Khatimah, K., & Mudmainnah, S. (2022). Kontribusi Sektor Pertanian Terhadap Perekonomian Kabupaten Brebes. Inovasi Peenlitian (JIP), 2(10), 3287–3296.
Komang, N., Fitri, A., Cahyani, A., Dwi, ), Darmawan, P., Mekse, G., & Arisena, K. (2021).
Analisis Potensi dan Daya Saing Sektor Pertanian di Kabupaten Tabanan Analysis of Superior Potential and Competitiveness of the Agricultural Sector in Tabanan Regency. Jurnal Manajemen Agribisnis, 9(2), 357–365.
Laili, N. (2021). Analisis Daya Saing Dan Faktor-Faktor Yang Mempengaruhi Ekspor Produk Alas Kaki Indonesia Ke Amerika Serikat Ditinjau Dalam Perspektif Ekonomi Islam.
Jurnal Ilmiah Ekonomi Islam, 7(2), 1019–1029.
https://doi.org/10.29040/jiei.v7i2.2385
116 Maranata, M., Erfit, E., & Mustika, C. (2019). Analisis peranan dan daya saing sector pertanian serta pengaruhnya terhadap pertumbuhan ekonomi Kabupaten Muaro Jambi. E-Jurnal Perspektif Ekonomi Dan Pembangunan Daerah, 8(1), 43–52.
https://doi.org/10.22437/pdpd.v8i1.5851
Nadziroh, M. N. (2020). Peran Sektor Pertanian Dalam Pertumbuhan Ekonomi Di Kabupaten Magetan. Jurnal Agristan, 2(1), 52–60. https://doi.org/10.37058/ja.v2i1.2348
Palindangan, J., & Bakar, A. (2021). Analisis Pengaruh Tingkat Pertumbuhan Ekonomi Dan Indeks Pembangunan Manusia (IPM) Terhadap Tingkat Pengangguran Di Kabupaten Mimika. JURNAL KRITIS (Kebijakan, Riset, Dan Inovasi), 5(1), 65–80.
Prasetyo, A. (2016). Kajian Pengaruh Pertumbuhan Ekonomi Terhadap Peningkatan Kemacetan Lalu Lintas Di Perkotaan. Jurnal Penelitian Transportasi Darat, 18(4), 231–242.
Ristanti, Y. D., & Handoyo, E. (2017). Undang-Undang Otonomi Daerah Dan Pembangunan Ekonomi Daerah. Jurnal Riset Akutansi Keuangan, 2(2), 115–122.
Salim, A., & Fadilla. (2021). Pengaruh Inflasi Terhadap Pertumbuhan Ekonomi Indonesia Anggun Purnamasari. Ekonomica Sharia: Jurnal Pemikiran Dan Pengembangan Ekonomi Syariah, 7(1), 17–28. www.bps.go.id