Some historians have even credited coffee as the fuel for the Industrial Revolution.3 The consumption of coffee as a beverage dates back to the 15th century. Arabica coffee makes up the majority of the world's coffee, but can be much more expensive than Robusta. In the grinding/polishing process, the skins of the cherries are removed and the cherries are now referred to as beans.7 The beans are sorted by weight and size and then.
Doing this extracts the soluble parts of the bean into the water to brew the coffee.8 When it comes to coffee, brewing is essentially synonymous with. This increases the surface area of the beans, allowing for faster extraction of the soluble chemicals in the beans. By increasing the surface area of the beans, the brewing time is significantly reduced.
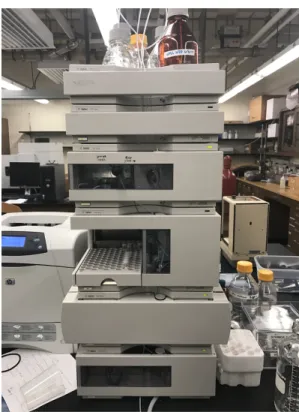
High-Performance Liquid Chromatography (HPLC) is one of the most effective and widely used chromatography techniques. Components of the sample then interact with the stationary phase for varying periods of time until they are eluted by the mobile phase. Here, and most often, these interactions arise from the polarity of the molecules and the mobile and stationary phases.12.
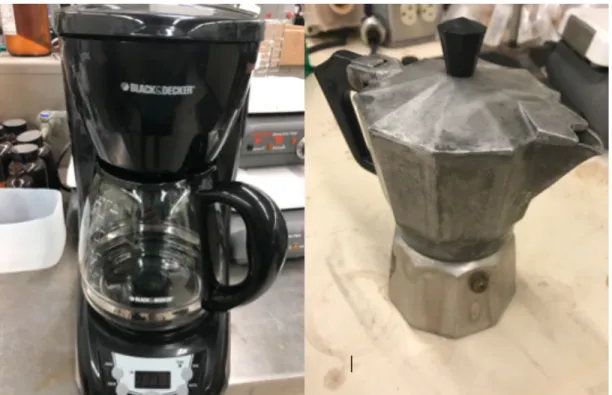
To do this, 25.00 ml of 0.80 mg/ml stock solution was placed in a 50.00 ml volumetric flask using a volumetric pipette and the flask was then filled to the mark with distilled water. Then 12.50 ml of the 0.40 mg/ml solution was placed in a 25.00 ml volumetric flask using a volumetric pipette and then diluted to the mark using distilled water. The coffee maker itself was a BLACK & DECKER 12-Cup Black Programmable Coffee Maker, Product # DLX1050B (Figure 2).19 Two CVS Pharmacy coffee filters were placed on top of the coffee maker.
Then we measured 150.00 ml of distilled water into the measuring cylinder and poured it into the back of the coffee machine. Then, using a 3ml BD syringe and a Fischerbrand PTFE 0.45µm ~ 2.00ml syringe filter tip, 2.00ml of sample was placed into a labeled HPLC vial and placed in the vial holder. A depression was made in the middle of the coffee to ensure an even pouring of water.
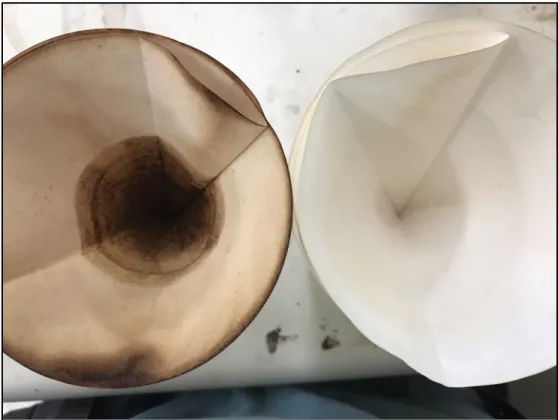
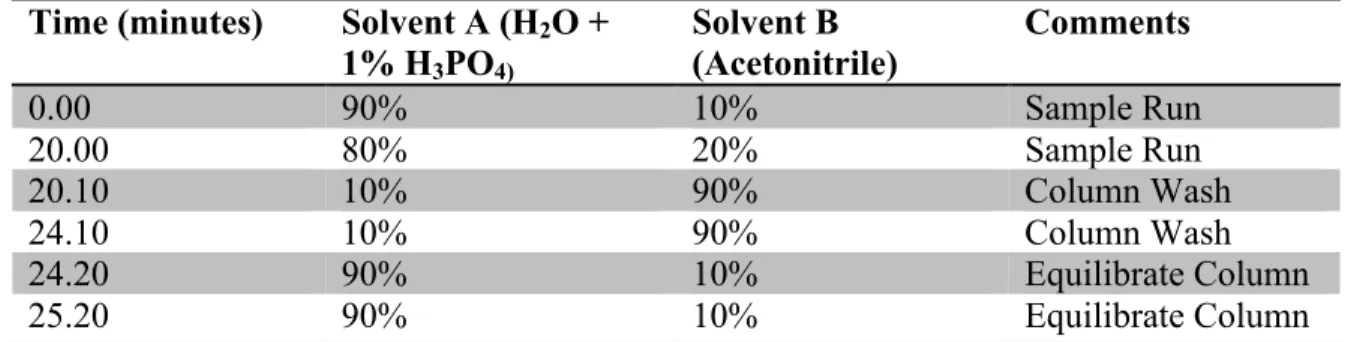
We made sure that the water level in the funnel never reached the top of the filter paper. The coffee was still Dark Brazilian Santos, but this time it was coarsely ground to prevent the espresso filter from clogging.20 Water was poured into the bottom of the pot, and the coffee was placed over the metal filter. The instructions on the back of the container were carefully followed in the preparation of this brew in order to have a standard that would be prepared in the laboratory exactly as it would be.
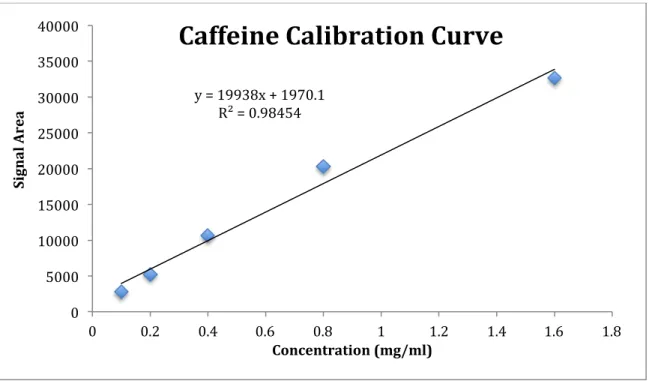
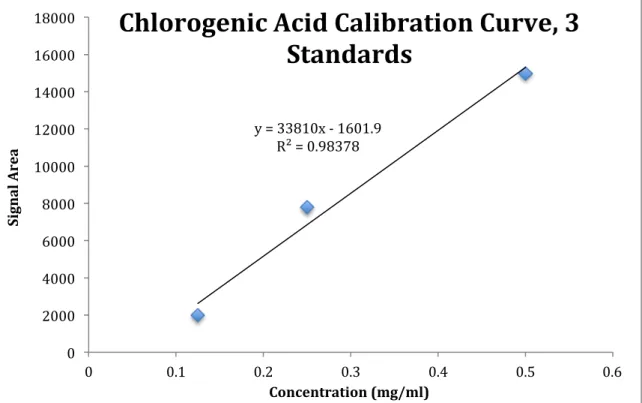
Using Excel and the data, a standard curve was created showing the area of each peak as a function of the concentration.
Caffeine Calibration Curve
The retention time was also recorded for each peak so that the correct peak could be determined from a coffee sample. Using the concentration curve (figure 4), the amount of caffeine in each sample could be calculated, and the differences could then be analyzed. Chlorogenic acid determination: The test for chlorogenic acids was very similar to the one used for caffeine and was adapted from the DIN 107672, another of many quality control tests for coffee products.
The analyte was detected using an absorbance detector at 324 nm with a bandwidth of 8 nm and no reference was used. Analysis of instant coffee: After completing the above work, the sample of instant coffee was also analyzed, according to the same methods mentioned above.
Chlorogenic Acid Calibration Curve, 3 Standards
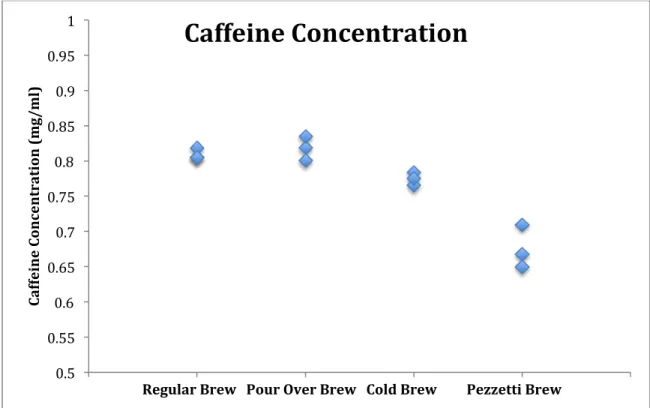
This table shows the means and standard deviations from the mean for the concentration of caffeine and chlorogenic acids in each brew. The analysis of the caffeine content showed that the regular and pour-over brews contained relatively the same amount of caffeine. While the pour-over brew may have contained a little more, the amounts were very close.
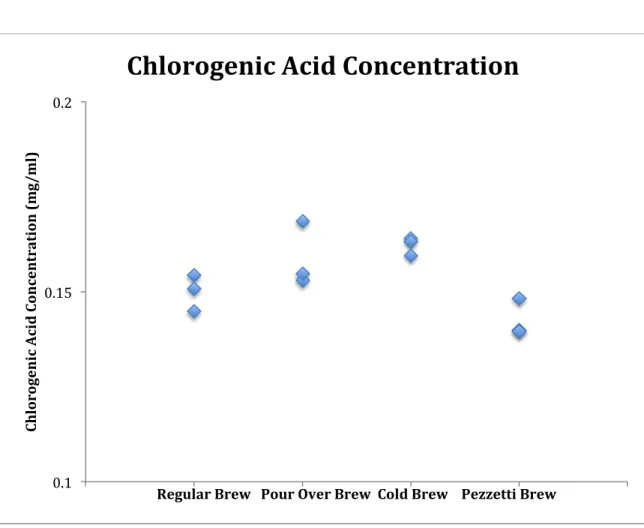
The large standard deviation associated with the caffeine concentration in the pour-over brew shows that this result may be less accurate than the mean value predicts, and may in fact be much closer to the value obtained for the concentration found in a regular , drip brew is found. . The fact that the Pezzetti espresso brew produced the least amount of caffeine was of particular interest, and will be addressed momentarily. In the analysis of chlorogenic acid content found in the four coffee brews, it was found that the cold brew method had the highest concentration of CGAs, followed by the pour-over and regular brews, with the Pezzetti espresso brew again having the lowest concentration.
One of the concentration values drives the average up for pour over brew, but looking at figure 7 it's clear.
Caffeine Concentration
This figure shows the results of the analysis of the chlorogenic acid content of each brew. The fact that the Pezzetti espresso brew has the lowest concentration of both caffeine and chlorogenic acids is strange. This seems to contradict much of what is believed about coffee brewed in the espresso form.
In fact, this strength, like the strength of all coffee drinks, is usually derived from the concentration of soluble coffee compounds found in the solution.8 In a regular drink, the ratio of water to soluble compounds is approx.
Chlorogenic Acid Concentration
When brewing espresso, the ratio is more like 98% water and 2% solubles.8 Additionally, espresso coffee is estimated to contain about 2.5× more caffeine per ounce of water than drip coffee.21 The reason the Pezzetti espresso brew has the least amount of caffeine and chlorogenic acids may be the result of the additional filtering performed in the preparation of that brew. It seems that the most important aspect that determines the strength of the brew is actually the size of the grind. As mentioned above, increasing the surface area of the coffee grind by using a finer grind allows for a more thorough extraction.
Finely ground espresso has been found to have almost twice as much caffeine as. Thus, the size of the grind, and thus the amount of extraction, appears to determine the amount of caffeine and other ingredients in the solution. Here, the instant coffee was prepared as shown on the back of the container, as you would prepare it at home.
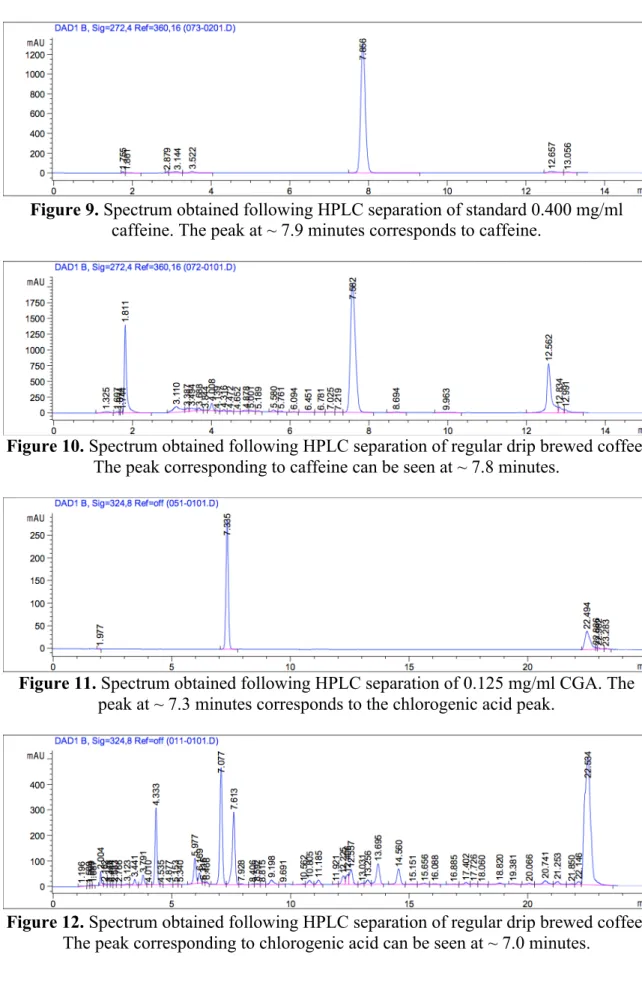
Photographs of the chromatograms obtained for one of the standards for each molecule have been added, as well as the spectrum for the common brew in each analysis and finally the spectra obtained from the instant coffee analysis. One of the first things to notice is that the peaks do not exactly match in time between the standards and the samples. This does not seem to affect the interpretation of the results, as the peak can still be determined in the sample spectrum.
Striking in the spectrum obtained from the chlorogenic acid analysis of the drip coffee are the two large peaks, one in front and one in front. If no clear distinction is made in the DIN method for the determination of chlorogenic acid, it would be easy to confuse one of these peaks with the peak corresponding to chlorogenic acid. Instead, these are different forms of the acid, neo-chlorogenic acid and crypto-chlorogenic acid, respectively.2.
It is important to understand the chemistry behind coffee because of the huge amount of coffee consumed. Here, the caffeine content and chlorogenic acid content of four different coffee brews were analyzed. It was found that the cold brew produced less caffeine but had a higher concentration of chlorogenic acid.
Because both molecules contribute a bitter taste to the final brew and act in opposition to each other, it is difficult to comment on the effect of these different concentrations on the final taste of the brewed product. The importance of this drink in modern society makes it all the more important that we understand everything possible about what we so heavily consume.