Introduction
Phase transitions and Landau-Ginzburg-Wilson (LGW) theory
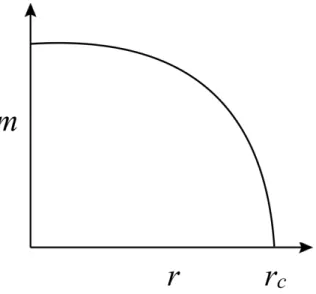
By varying the control parameter r, such as temperature, pressure, chemical doping, field, etc., the order parameter is adjusted from zero to zero at the critical point r =rc. The reason that Landau theory fails to predict critical behavior in real materials has been shown to be inadequate consideration of oscillation effects.
Quantum phase transitions (QPTs)
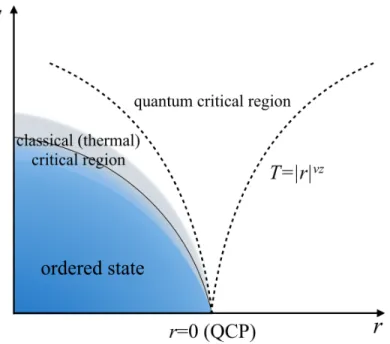
The critical exponents defined in equation (1.4), i.e., (ν, η,z), uniquely characterize the critical behavior of a physical system and define a class of universality. The fundamental difference between Eq. 1.7) and (1.8) is the uncertainty relation between momentum and space, distinguishing quantum and classical statistics.
Antiferromagnetic QPTs and competing ground states
Due to the requirement of the Pauli principle, the overall wave function of Cooper paris must be antisymmetric. The richness of the spin configurations also provides tunability to reveal the microscopic pairing mechanism.
![Figure 1.4: P − T phase diagram of CePd 2 Si 2 [21]. T N , the antiferromagnetic transition temperature, is suppressed by pressure](https://thumb-ap.123doks.com/thumbv2/123dok/10418994.0/27.918.263.650.114.593/figure-phase-diagram-antiferromagnetic-transition-temperature-suppressed-pressure.webp)
Structure of this thesis
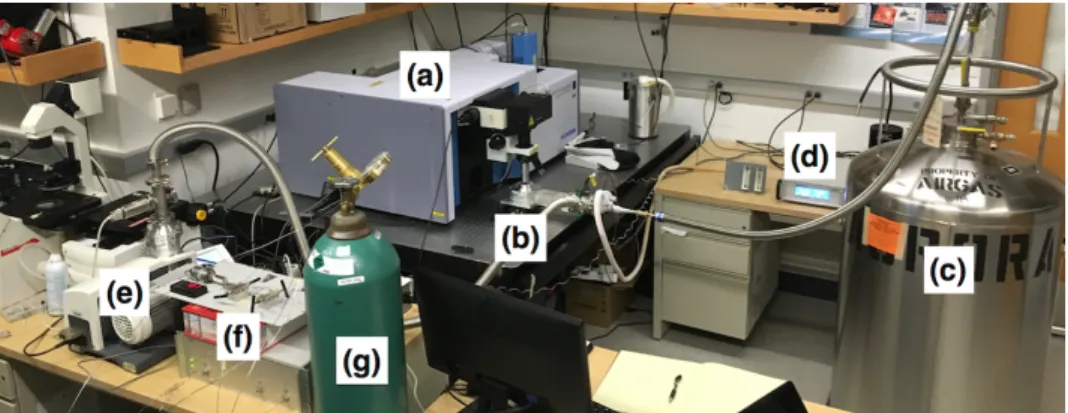
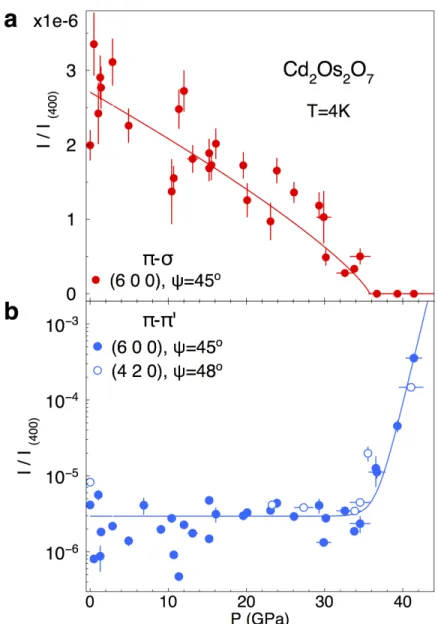
In the π−σ channel, the intensity of the (4, 2, 0) order mainly represents the ATS signal, while the intensity of the (6, 0, 0) order represents the pure magnetic signal. Images of the pressure chamber at the lowest (left) and highest (right) pressures are shown in the inset.
Experimental Methods
High pressure sample environment
However, the equation of state of the pressure medium only dominates when the packing material is strong enough. This redistribution of the pressure medium through plastic deformation and rheology within a shape-changing chamber is a main feature of diamond anvil cells.
![Figure 2.2: Design of the compact bellows-controlled diamond anvil cell compatible with PPMS [42]](https://thumb-ap.123doks.com/thumbv2/123dok/10418994.0/35.918.170.748.115.459/figure-design-compact-bellows-controlled-diamond-anvil-compatible.webp)
X-ray magnetic diffraction
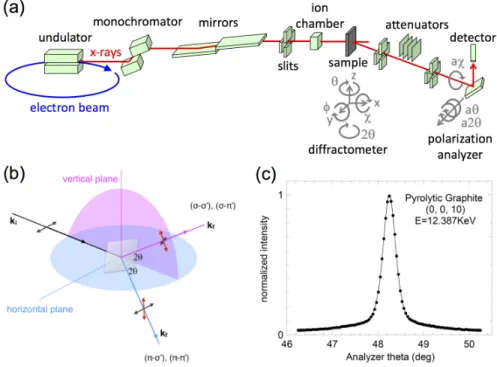
The first term in Eq. 2.1) gives the usual Thomson cross section for Bragg scattering and depends on the Fourier transform of the charge density. Non-resonant diffraction without a polarization study mainly receives signals from the σ− σ channel, which is sensitive only to the spin density out of the diffraction plane, as shown in equation (2.10). The tensor ˆχ(r) is symmetric: χik(r)= χki(r);i,k = 1,2,3 and must be invariant under the space group of the crystal.
By introducing the amplitude FˆH of the tensor structure, which is proportional to the Fourier component ˆχH of the tensor. Note that the additional degree of rotational freedom φ of the sample determines its azimuthal state.
Optical Raman spectroscopy under high pressure
At the same time, the phonon-mediated superconductivity is suppressed due to the local ferromagnetic spin configuration [117] in the low-frequency helical fluctuation modes. The magnetic phase boundary is most precisely determined by the evolution of the grid pressure. This indicates that the (6, 0, 0) order becomes forbidden at high pressure due to the variation in lattice symmetry.
Phase-sensitive tests of pair-state symmetry in high-temperature superconductors – Proof fordx2−y2 symmetry”. Tetrahedral magnetic order and the metal-insulator transition in the pyrochlore lattice of Cd2Os2O7”.Phys.
Introduction
In Mo3Sb7 itself, superconductivity occurs below a structural phase transition with claims of accompanying magnetic order and spin dimerization [78–80], which may place it in the growing cohort of exotic superconductors with unconventional coupling mechanisms [30–33]. Mo3Sb7 becomes superconducting at Tc = 2.35 K, with a structural phase transition from high-temperature cubic symmetry to low-temperature tetragonal symmetry at TS = 53 K [78–80]. Whether this structural transition is magnetically driven is still an open question [78–81] , although no long-range spin order has been observed.
Magnetic susceptibility measurements give oneS= 1/2 local moment per Mo site from fits to a Curie-Weiss law at high temperature [78-80], with spin-gap behavior at low temperature suggesting a spin-Peierls transition at TS [79, 80]. The superconductivity at ambient pressure is claimed to be best-wave [82–84], but the possibility of unusual magnetic phases at low temperature [78–81] raised the question of the role of spin coupling.
![Figure 3.1: P − T phase diagram of Mo 3 Sb 7 . Red squares mark the phase boundary between tetragonal and cubic structures at T S ( P ) , as determined from electrical resis-tivity [85]](https://thumb-ap.123doks.com/thumbv2/123dok/10418994.0/50.918.227.695.398.793/figure-diagram-squares-boundary-tetragonal-structures-determined-electrical.webp)
Experimental methods
Results
The link of Tcto structure suggests that spin fluctuations are not a dominant coupling mechanism in this system, while the abrupt variation in Tc indicates a symmetry-related difference in the phonon density-of-states. Given the continuous evolution of the ambient pressure paramagnet above TS= 53 K to high pressure and low temperature, we can expect the spins in the high pressure cubic phase of Mo3Sb7 to remain disordered. Spin fluctuations in Mo3Sb7 have been discussed in the literature based on the assumption of oneS= 1/2 local moment per Mo site [79, 80].
Since Mo3Sb7 is cubic in the paramagnetic phase, no strong anisotropy of M(H) along the principal crystal axes is expected. Indeed, the shortest Mo-Mo distance in Mo3Sb7 is 2.98 Å[80], a distance similar to the value of Å in the elemental and ferromagnetic Mo GaMo4S8 and GaMo4Se8[92], where the overlap of 4 orbitals results in electrons of are considered as itinerant [92 -94].

Discussion and conclusion
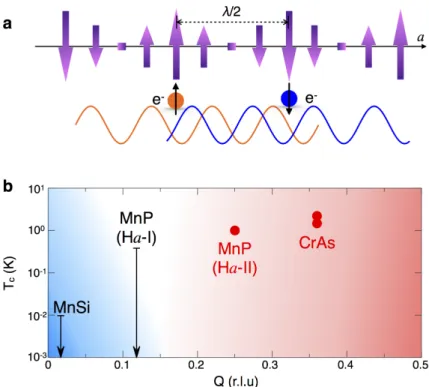
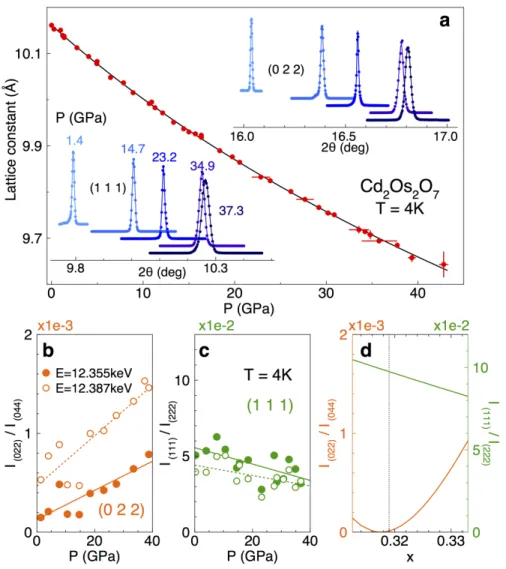
The height of helical order represents a possible tuning method between ferromagnetic (blue region) and antiferromagnetic (red region) mediated superconductivity. No lattice constant discontinuity has been detected through the magnetic transition at TN = 227 K [63, 148]. The continuous nature of this quantum phase transition is manifested by the smooth evolution of the lattice constant (Fig. 5.5).
Low energy excitations and ground state selection in the quantum breathing pyrochlore antiferromagnet Ba3Yb2Zn5O11”.Phys. Phonons and crystal structures of β-pyrochlorine superconductors KOs2O6 and RbOs2O6 from microraman spectroscopy”.Phys.
Spiral magnetic order and superconductivity in MnP
Introduction
The equally venerable field of superconductivity serves as the prime example of emergent collective behavior in nature, with hopes for technological import raised by the discovery of exotic superconducting order in cupates. Magnetism and superconductivity often compete for supremacy as the ground state of the material, but under the right circumstances fluctuating residual magnetic order can induce superconducting coupling. The recent discovery of a superconducting phase in the transition metal compound MnP [100] opens the possibility of investigating this scenario.
The spin structure in the high-pressure magnetic phase remains uncertain, and is actively investigated by both x-ray and neutron [102] magnetic diffraction techniques. The existing data correlating magnetic pitch length and superconductivity are sparse but suggestive in the (V/Cr/Mn/Fe/Co/Ni)(P/As/Sb) family.
![Figure 4.1: P − T phase diagram of MnP from Ref. [100]. Pressure dependence of the magnetic transition temperatures, T C , T m , T ∗ , T S , and the superconducting transition temperature T SC ; T SC has been scaled by a factor of 20 for clarity.](https://thumb-ap.123doks.com/thumbv2/123dok/10418994.0/59.918.232.680.407.743/pressure-dependence-magnetic-transition-temperatures-superconducting-transition-temperature.webp)
Experimental methods
116] and, as discussed in detail below, we propose this family of spiral magnets as a new venue for tunable, spin-fluctuation-mediated superconductivity. Here we point out that for a helical arrangement of localized spins, a variable spiral period can provide a unique tuning process from ferromagnetic to anti-ferromagnetic ground state in the long and short wavelength limits. Such chemically or pressure tunable helical order naturally offers the possibility for continuous tuning between ferromagnetically and antiferromagnetically mediated superconductivity.
Results
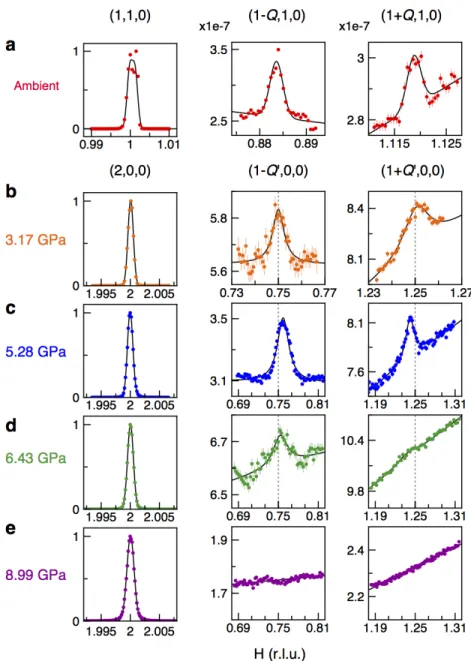
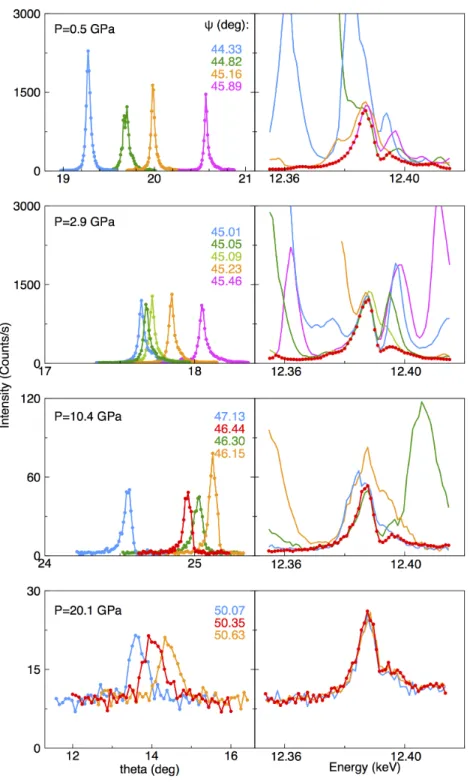
The single crystal nature of the magnetic order is confirmed by independent raw scans in the entire 3D reciprocal space for both (1-Q', 0, 0) and (1+Q', 0, 0) orders. The peak intensities lie in the range 1 - 4 10−8 relative to the lattice intensity (2, 0, 0), which are comparable to the estimation of the intensities of the non-resonant magnetic diffraction and the observed diffraction signal of the coil with low pressure. . Single crystal refinement of five to six Bragg orders of MnP at each pressure shows that the lattice structure remains in the orthorhombic phase up to 10.4 GPa.
Spins in MnP are deep in the local limit at ambient pressure given a Rhodes–Wohlfarth ratio of 2.2 (Fig. 4.7). Interpretation of its behavior for P>Pc[134] is obscured by a strong first-order phase transition and a highly strained sample state (several percent lattice mismatch) in the phase coexistence region.
Discussion
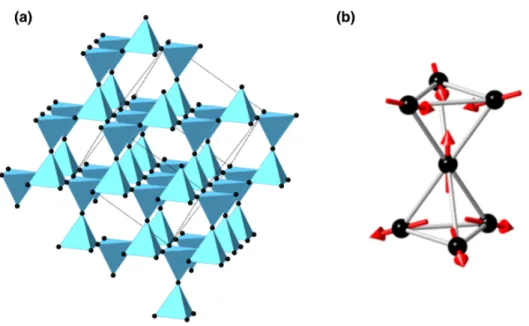
It is therefore crucial to develop a microscopic probe of the interwoven electron, spin, orbital and lattice degrees of freedom at the quantum critical point. A direct measurement of the AIAO order can be performed by either neutron or x-ray magnetic scattering. 2 orbit to empty orbitals of the t2g band as the intermediate state, and they exhibit a similar energy dependence in the resonance profile (Fig.
At the phase boundary (36.7 GPa), the magnetic resonance has disappeared and the energy dependence is that of the Os L2 fluorescence background. In Cd2Os2O7, the metal-insulator transition remains a missing piece of the puzzle as the magnetic order and lattice symmetry have been directly probed by x-rays.
Introduction
Taking all these factors into account, resonant X-ray magnetic diffraction is the most suitable technique under high pressure to directly probe QPTs of AIAO order. The experimental methods of magnetic resonant X-ray scattering have been discussed in detail in Chapter 2. Using the combined experimental tools of resonant X-ray magnetic diffraction and optical Raman scattering, we have explored the potential quantum critical state in a system with antiferromagnetic AIAO order.
At ambient pressure, Cd2Os2O7 undergoes a metal-insulator transition at TMIT= 227 K simultaneously with the formation of the AIAO magnetic order. The AIAO magnetic order was directly illustrated by resonant x-ray magnetic diffraction at the Os L3 edge [ 63 ], and the lattice symmetry was characterized in detail by optical Raman scattering [ 63 ].
Spin and orbital resonance
Left) Mosaic scans of (6, 0, 0) order at different azimuthal angles with the values specified in the panel. In the π −π' channel, both magnetic and ATS scattering are weak, and intensities of forbidden orders (6, 0, 0) and (4, 2, 0) will be sensitive to the regular Bragg diffraction of the grating, and reflects the change of the space group. The low intensity signal of the magnetic resonance can be contaminated by multiple scattering which appears in both the mosaic curves and the energy spectra (Figure and is sensitive to small changes in the sample azimuthal angle.
The resonance extends beyond the magnetic phase boundary at Pc = 35.8 GPa, although the resonance profile at 41 GPa shows a sum of ATS resonance in the channel and a projection of 2.5%. Resonant scattering at the (4, 2, 0) order, with an azimuthal angle of about 50◦ in our sample geometry, manifests a significant ATS diffraction signal in theπ−σ channel (Fig. 5.4).
Lattice structure and symmetry
These two orders are sensitive to O 48f sites in the unit cell, and evolve in opposite ways up to 40 GPa. While magnetic resonance in theπ−σchannel is suppressed at (6, 0, 0) (Fig. 5.4, text), theπ−π' charge diffraction intensities rise dramatically for both (6, 0, 0) and (4, 2, 0) orders, with a small leakage in the π − σ channel becoming visible by the polarization analyzer. The remaining five modes are all attributed to the motion of oxygen atoms O occupying 48f sites, which are Cd-O stretching, O-Cd-O bending, O-O stretching, O-Os-O bending and Os-O stretching in the increasing frequency represents sequence [177].
These two data sets close the most important boundary of the phase space we have explored (individual P−T points are marked with gray crosses in the phase diagram in Fig. 5.11). The strongest pressure dependence of Eindicates a strong anharmonic component in the O(1) vibration, a conclusion which is also supported by the strong temperature dependence of T2g(4) (Fig. 5.9).
Discussion
Structural and magnetic phase diagram of CrAs and its relationship to pressure-induced superconductivity”. Continuous transition between antiferromagnetic insulator and paramagnetic metal in the pyrochlore iridate Eu2Ir2O7”.Phys. Novel Phase Transitions in the Breathing Pyrochlore Lattice: 7Li-NMR on LiInCr4O8and LiGaCr4O8". Phys.
Low-temperature and high-pressure Raman and X-ray studies of pyrochlore Tb2Ti2O7: Phonon anomalies and possible phase transition”.Phys. Odd-parity superconductivity near inversion symmetry breaking in spin-orbit coupled systems”.Phys.
Conclusions and outlook
![Figure 1.5: Phase diagram and Brillouin zone schematic for magnetism in chromium [23]](https://thumb-ap.123doks.com/thumbv2/123dok/10418994.0/28.918.242.681.120.455/figure-phase-diagram-brillouin-zone-schematic-magnetism-chromium.webp)

