Published by McGraw-Hill, a business unit of The McGraw-Hill Companies, Inc., 1221 Avenue of the Americas, New York, NY 10020. A variety of examples, tabular solutions, end-of-chapter problems, and test review Exam Questions / FE are included in each chapter.
FEATURES
TOPICAL COVERAGE AND OPTIONAL MATERIAL FOR FLEXIBLE USAGE
ACKNOWLEDGEMENTS
WHAT IS ENGINEERING ECONOMY?
In simpler terms, engineering economics is a collection of techniques that facilitate comparisons of alternatives on an economic basis. In defining what engineering economics is, it may also be useful to define what it is not.
PERFORMING AN ENGINEERING ECONOMY STUDY
- Alternatives
- Cash Flows
- Alternative Selection
- Evaluation Criteria
- Intangible Factors
- Time Value of Money
Although economics will be the only criterion for choosing the best alternatives in this book, real decisions usually include many other factors in the decision-making process. The inclusion of other factors (besides economics) in the decision-making process is called multiple attribute analysis.
INTEREST RATE, RATE OF RETURN, AND MARR
Technical alternatives are assessed based on the forecast that a reasonable return (ROR) can be realized. The reasonable rate, called the minimum attractive rate of return (MARR), must be higher than the cost of money used to finance the alternative, as well as higher than the rate that would be expected from a bank or safe (minimal risk) investment.
EQUIVALENCE
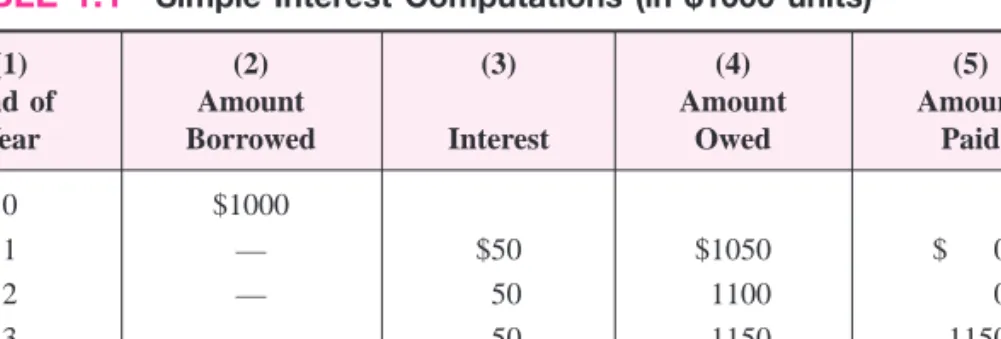
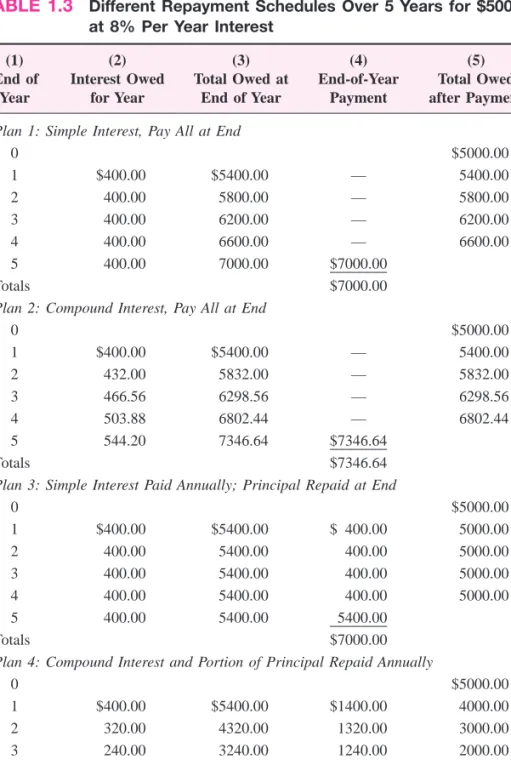
SIMPLE AND COMPOUND INTEREST
The outstanding loan balance decreases each year, so the interest rate for each year decreases. Equal payments are made each year, with a portion going towards repayment of the principal and the rest covering the accrued interest.
Plan 2
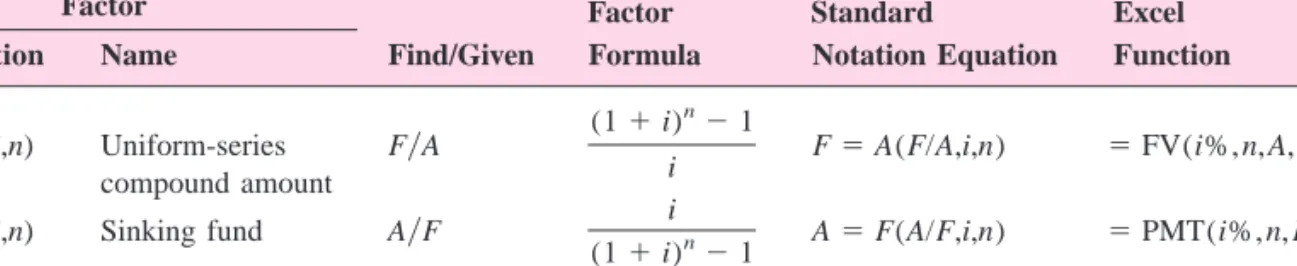
- TERMINOLOGY AND SYMBOLS
- CASH FLOWS: THEIR ESTIMATION AND DIAGRAMMING
- THE RULE OF 72
- INTRODUCTION TO USING SPREADSHEET FUNCTIONS
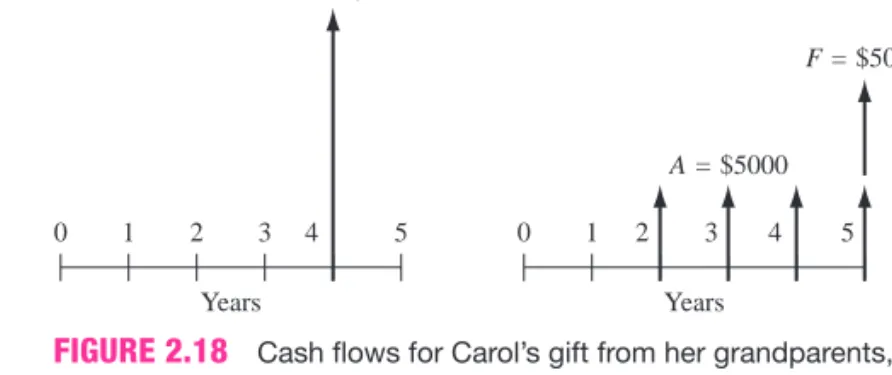
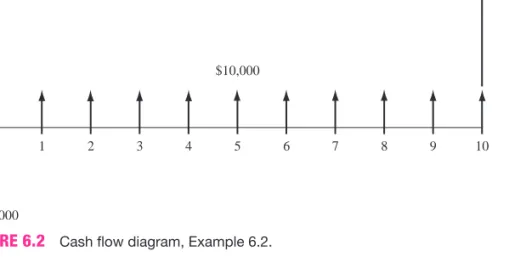
It is important to note that the symbol A always represents a uniform amount (i.e. the same amount every period) spanning successive interest periods. In example 1.9, the deposit occurred on July 1, 2008, and withdrawals will occur on July 1 of each subsequent year for 10 years.
SUMMARY
PROBLEMS
The company can finance a $150,000 system at 5% per year compound interest or 5.5% per year simple interest. Now the company plans to invest the total amount earned in another certificate that pays 9% per annum compound interest.
PROBLEMS FOR TEST REVIEW AND FE EXAM PRACTICE
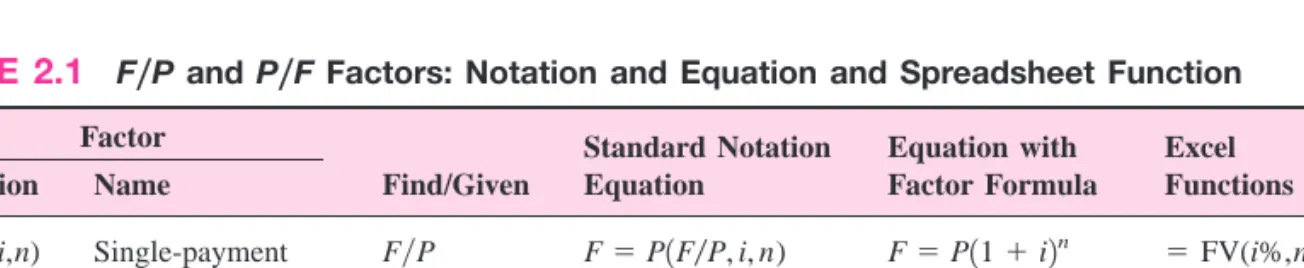
SINGLE-PAYMENT FORMULAS (F/P AND P/F )
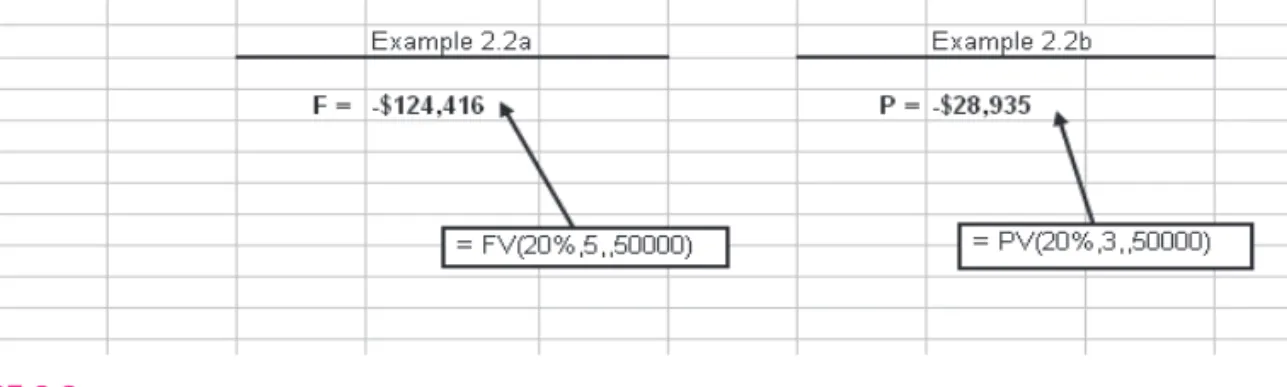
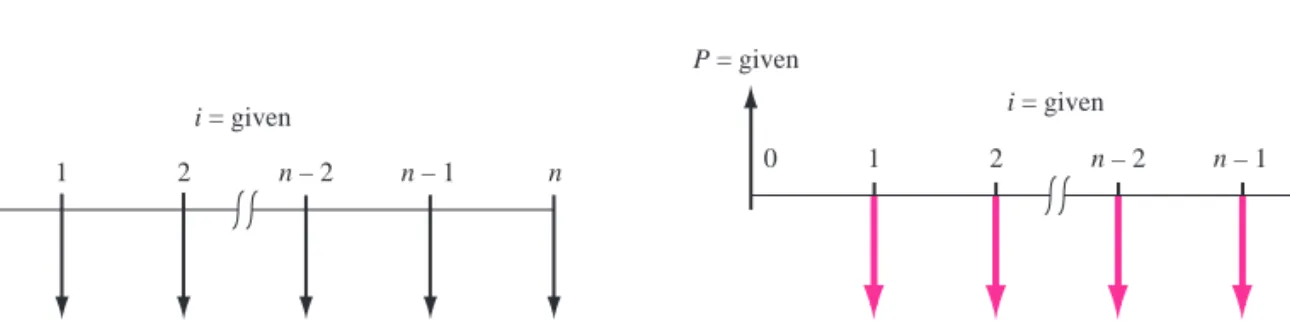
The cash flow diagram appears as in Figure 2.1b with F set at time and P value set 3 years ago at The symbols and their values are. The cash flow diagram (Figure 2.8) shows the annual payments beginning at the end of year 1 and ending in the year the future value is desired.

GRADIENT FORMULAS
Thus, the general equation for finding the present value of an arithmetic gradient cash flow series is The cash flow includes an increasing gradient of G$500 and a base amount of $5000 starting in year 1.
CALCULATIONS FOR CASH FLOWS THAT ARE SHIFTED
Find the present value or future value of each series on the cash flow diagram. The P兾G factor values and placement of the gradient range present at the value of PG for the shifted arithmetic gradients in Figure 2.16 are indicated.
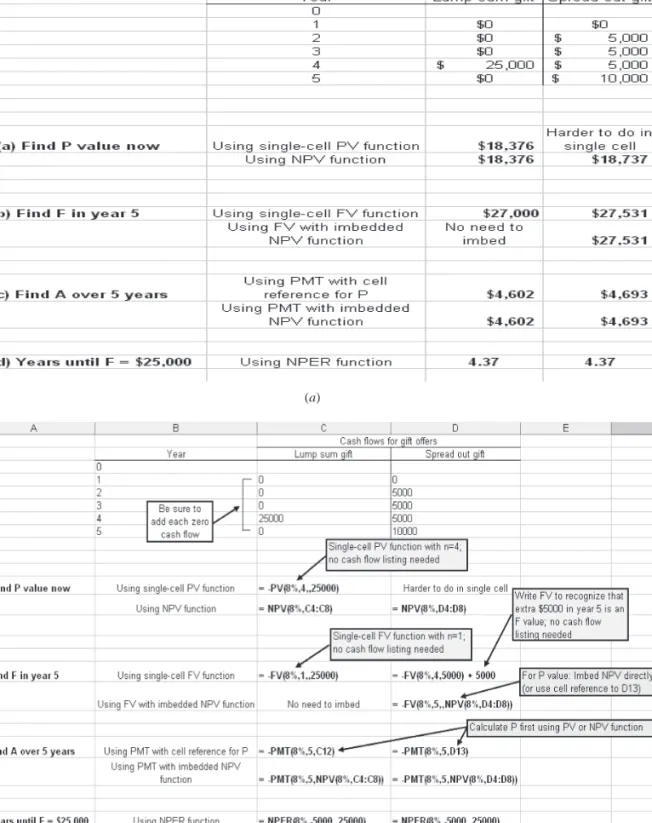
USING SPREADSHEETS FOR EQUIVALENCY COMPUTATIONS
What is the total future value of this savings in year 5 at an interest rate of 10% per year. Determine the present value in year 0 of the costs at an interest rate of 10% per year.
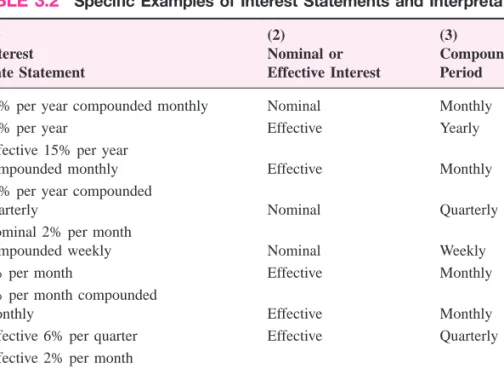
NOMINAL AND EFFECTIVE INTEREST RATE STATEMENTS
Such interest rates are assumed to be effective interest rates, with the compounding period (CP) being the same as that of the stated interest rate. In such cases, the interest rate is assumed to be nominal and the compounding period is equal to the stated interest rate.
EFFECTIVE INTEREST RATE FORMULATION
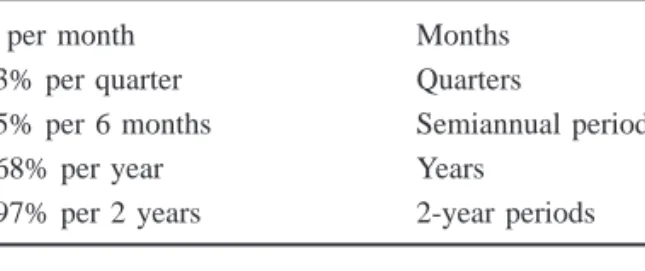
Comment: Note that the r兾m term in equation [3.2] is always the effective interest rate for the compounding period. For an interest rate of 18% per year compounded continuously, calculate the effective monthly and annual interest rates.
RECONCILING COMPOUNDING PERIODS AND PAYMENT PERIODS
For simplicity, the frequency of payments or collections is known as the payment period (PP). It is important to distinguish between the compounding period (CP) and the payment period because in many cases the two do not coincide.
EQUIVALENCE CALCULATIONS INVOLVING ONLY SINGLE-AMOUNT FACTORS
For example, if a company deposits money every month into an account that pays a nominal interest rate of 6% per annum, compounded semi-annually, the payment period will be 1 month while the compounding period will be 6 months as shown in Figure 3.1 showed. After this, it will be necessary to determine the relationship between the compounding period and the payment period as a first step in solving the problem, for problems involving either uniform series or uniform gradient cash flow amounts.
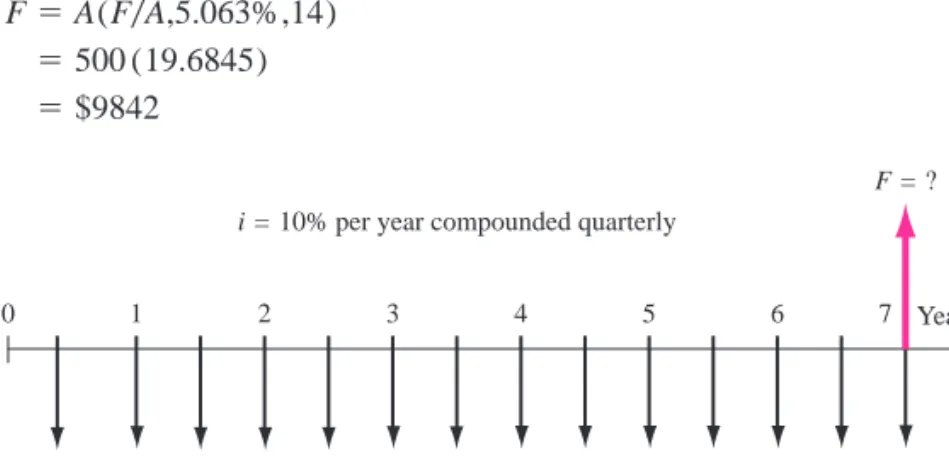
What is the equivalent amount after the last payment, if these funds are taken from a pool that pays back 10% per year, compounded quarterly. The payment period (6 months) is longer than the compounding period (quarterly); that is, PP ⬎CP.
For a no-interest-between-periods policy, all deposits (negative cash flows) are considered deposits at the end of the pruning period, and all withdrawals are considered withdrawals at the beginning. To illustrate, when interest is compounded quarterly, all monthly deposits are moved to the end of the quarter and all withdrawals are moved to the beginning (no interest is paid for the entire quarter).
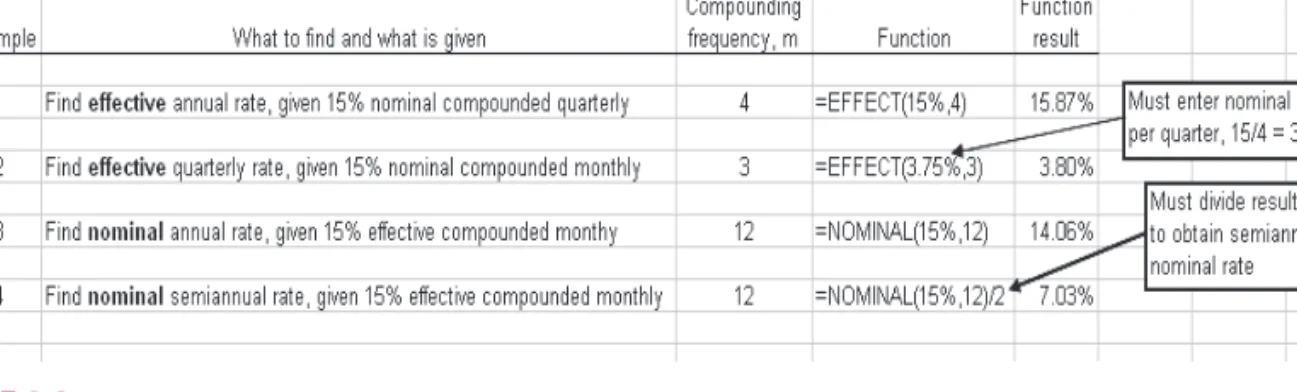
USING SPREADSHEETS FOR EFFECTIVE INTEREST RATE COMPUTATIONS
What is the future value of the income at an interest rate of 8% per year, compounded quarterly? At an interest rate of 20% per annum compounded quarterly, the present value of the equipment is closer.
FORMULATING ALTERNATIVES
PRESENT WORTH ANALYSIS OF EQUAL-LIFE ALTERNATIVES
To assess a proposed purchase of a bond, determine the PW on the MARR of all cash flows: the initial payment and receipts of periodic dividends and the par value of the bond at maturity. It is important to use the effective MARR rate in the PW relationship that corresponds to the period of the payments.
PRESENT WORTH ANALYSIS OF DIFFERENT-LIFE ALTERNATIVES
- Study Period
- Least Common Multiple (LCM)
Analysis of the current value using the LCM method, as illustrated in example 4.3, is correct, but not recommended. Determine which lease option to select based on a present value comparison using the LCM.
CAPITALIZED COST ANALYSIS
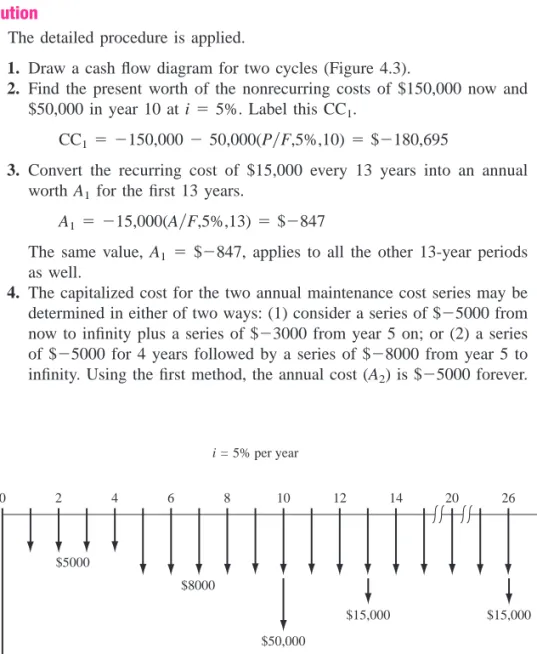
EXAMPLE 4.4 The Marin County Property Appraisal District has just installed new software to track the market values of residential properties for property tax purposes. Convert the recurring cost of $15,000 every 13 years to the annual value of A1 for the first 13 years.
EVALUATION OF INDEPENDENT PROJECTS
No more than a certain amount, b, of funds can be invested in all selected projects, and each project must meet or exceed the MARR. The amounts required to start each project (initial investment) now and the expected cash flows over the expected lifetime are estimated by the project engineering department.
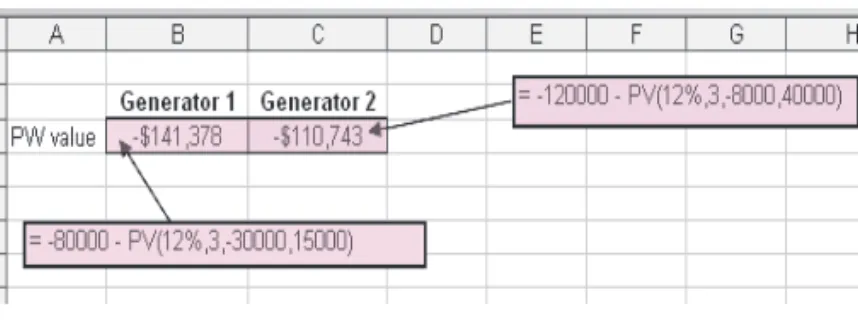
USING SPREADSHEETS FOR PW ANALYSIS
Use the corporation's MARR of 15% per year with (a) present value analysis and (b) future value analysis. Compare the following alternatives using capitalized cost and an interest rate of 12% per year compounded quarterly.
AW VALUE CALCULATIONS
Capital recovery is the equivalent annual cost of owning the asset plus the return on the initial investment. The cash flow (Figure 5.2a) for the tracker system should be converted to an equivalent AW cash flow sequence over 8 years (Figure 5.2b). All amounts are expressed in $1 million units.) The AOC is A $0.9 per year, and the capital recovery is calculated using Equation [5.3].
EVALUATING ALTERNATIVES BASED ON ANNUAL WORTH
The financial viability can now be determined without calculating the AW value, because the $5000 in new income is lower than the CR of $5822, which does not yet include the annual cost. An equivalent of the projected $5000 plus the AW amount is needed to make the project economically justified at a 10% return.
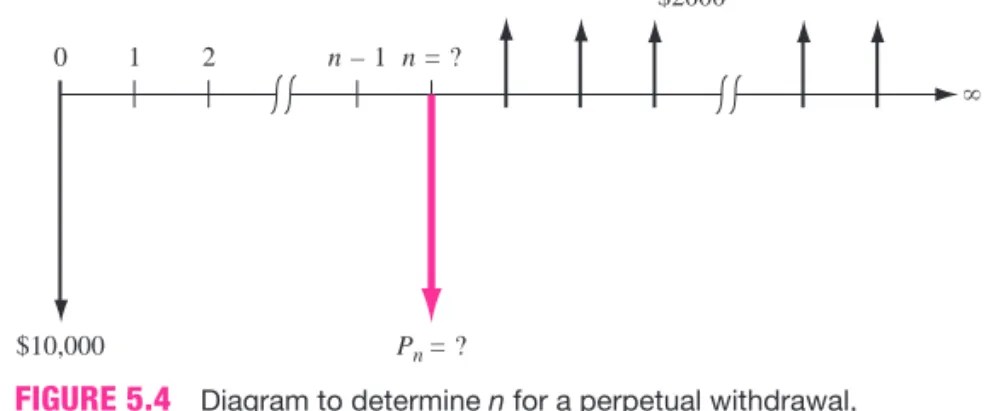
AW OF A PERMANENT INVESTMENT
The cladding is believed to be permanent, but minor maintenance will be required each year at a cost of $5000. Estimates are: initial cost of $6 million, annual maintenance of $3000 for right of way and a lifespan of 50 years.
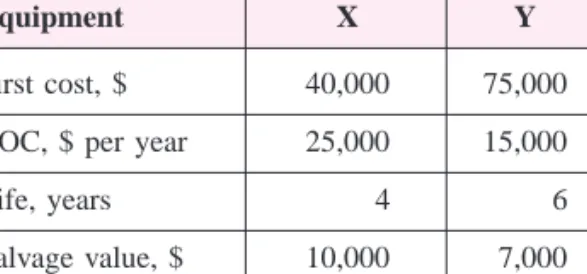
USING SPREADSHEETS FOR AW ANALYSIS
Use the annual value method for a study period of 4 years and i6% per year to choose the lowest annual cost alternative. Use the estimates made by the Harmony owner to perform an annual appreciation at 12% per year to choose the best option.
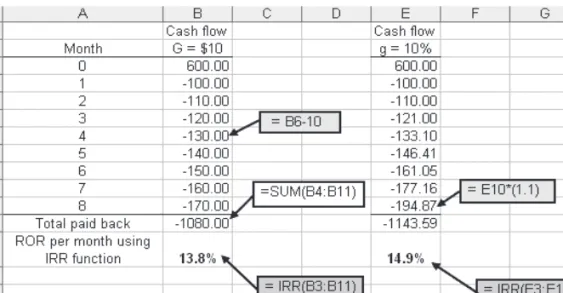
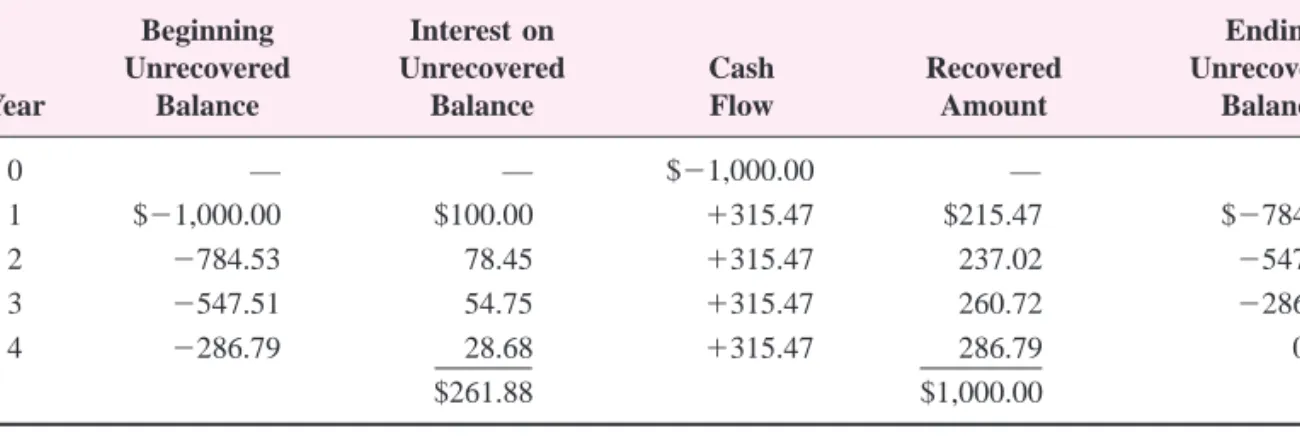
INTERPRETATION OF ROR VALUES
Since the rate of return is the interest rate on the outstanding balance, the calculations in Table 6.1 represent the correct interpretation of the 10 percent rate of return. From the borrower's point of view, it is better to charge interest on the outstanding amount than on the original amount borrowed.
ROR CALCULATION
The fastest way to determine an i* value, when there is a series of equal cash flows (A series), is to apply the RATE function. Find the nominal and effective annual interest rate, compounded semiannually, that Allied pays to an investor.
CAUTIONS WHEN USING THE ROR METHOD
UNDERSTANDING INCREMENTAL ROR ANALYSIS
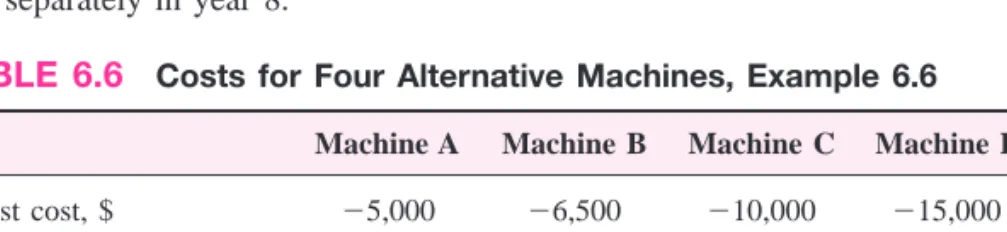
To solve the dilemma, perform a stepwise analysis between two alternatives at a time and base the alternative choice on the ROR of the stepwise cash flow series. In the incremental cash flow tabulation for 6 years (Table 6.5), note that the reinvestment and salvage value of A is shown in year 3.
ROR EVALUATION OF TWO OR MORE MUTUALLY EXCLUSIVE ALTERNATIVES
The best rationale for understanding incremental ROR analysis is to think of only one alternative under consideration, which is represented by the incremental cash flow series. As a matter of efficiency, if the analysis is between multiple revenue alternatives, an acceptable procedure is to initially determine each alternative's i* and remove those alternatives with i* MARR, since their returns are too low.
Only if the profitability of the additional investment, which is the value of i*, has reached or exceeded the MARR, is it financially justified; in this case, a larger investment alternative should be chosen. If no alternative i* meets or exceeds the MARR, the economically best alternative is to do nothing.
- MULTIPLE ROR VALUES
- REMOVING MULTIPLE ROR VALUES BY USING A REINVESTMENT RATE
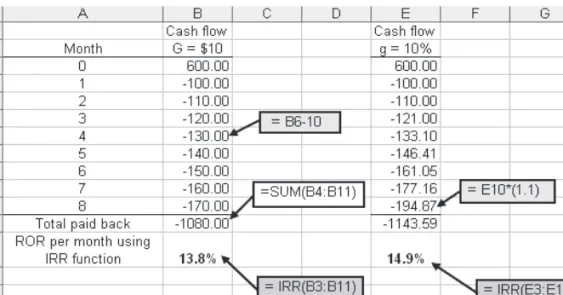
- USING SPREADSHEETS FOR ROR ANALYSIS
- PUBLIC VERSUS PRIVATE SECTOR PROJECTS
- BENEFIT/COST ANALYSIS OF A SINGLE PROJECT
- INCREMENTAL B/C EVALUATION OF TWO OR MORE ALTERNATIVES
- USING SPREADSHEETS FOR B/C ANALYSIS
- BREAKEVEN ANALYSIS FOR A SINGLE PROJECT
He contracted with Binkely Toys, Inc., the maker of the dolls, to purchase bobbleheads in lots of 250 for $2,500. Taxes are collected from those who own them – the citizens (for example, the gas tax on highways is paid by all petrol users). EXAMPLE 7.1 The City of Dundee's citizen-based Capital Improvement Projects (CIP) Committee has recommended a $25 million bond issue for the purchase of greenbelt/floodplain land to preserve low-lying green areas and wildlife habitat.
EXAMPLE 7.3 The city of Garden Ridge, Florida received two plans for a new wing of the municipal hospital.