DOI: http://doi.org/10.4038/cjs.v46i5.7453
The biogeography and ecology of Sri Lankan mammals point to conservation priorities
Wolfgang P. J. Dittus1, 2, 3,*
1National Institute of Fundamental Studies, Kandy 2000, Sri Lanka.
2Association for the Conservation of Primate Diversity, Sri Lanka
3Conservation Ecology Center, Smithsonian Conservation Biology Institute, Washington, DC 20013, USA.
Received: 17/12/2016; Accepted: 15/10/2017
*Corresponding Author’s Email: [email protected] RESEARCH ARTICLE
Abstract: All mammals originated on the supercontinent of Pangaea in the Mesozoic era during the “Age of Reptiles.”
However, the crown ancestors of contemporary mammals did not flourish until major environmental and biotic changes had occurred. An asteroid collided with earth at the end of the Cretaceous Period (the K-Pg boundary event) wiping out non- flying dinosaurs and primitive mammals. It was followed by large-scale volcanism, a spike in atmospheric oxygen and the proliferation of flowering plants. New niches became available for the ancestors of today’s mammals to fill. Evidence suggesting whether the ancestors of the Sri Lankan and Indian mammals originated on the tectonically marooned Indian plate before crashing into Asia or on the Laurasian supercontinent is inconclusive. Modern Sri Lankan mammals show their greatest affinity with those of southern India, and were more diverse in the Pleistocene when rhinoceros, hippopotamus, wild dogs, gaur and lions enriched the island’s landscapes. Native Sri Lankan land-based mammals are diversified into about 108 unique taxa (among 91 species and 53 genera), differentiated as phenotypic adaptations to sharply contrasting environments among seven major phyto-climatic zones. Endemic subspecies are distributed fairly equally across different phyto-climatic zones (n=24 to 29), except in the highlands where they are fewer (n=14) having evolved rapidly to species and genera among the insectivores and rodents whose reproductive rates are high. Conversely, greater numbers of endemic species (n=13) and genera (n=3) occur in the highlands than in the other zones (2-6 endemic species, no endemic genera). The prevalence of endemism is inversely related to body size or vagility. This suggests a greater probability of genetic exchange among distant populations of large bodied mobile mammals within Sri Lanka, as well as with Indian fauna during periods of land bridges in the Pleistocene. Most (8 of 13) endangered and critically endangered endemic mammals occur in the wet montane regions that offer the least Protected Areas (PAs). More than 85% of PAs occur in the extensive dry zone about half of which is not suited for water dependent mammals whose distributions are restricted to alluvial forests (less than 1% of PAs). Historically, the national cost of conservation has been low and therefore politically palatable. Current conservation urgently requires a major change in management policy combined with realistic investment to prevent extinctions of many endemic mammals and other unique Sri Lankan biota.
Keywords: endemism, evolutionary stable unit, mammal subspecies, habitat quality, ecological niche, mammalian evolution.
INTRODUCTION
Chance events in the geological history of the earth have placed Sri Lanka in a globally unique position with respect to biodiversity. Apical flora and fauna reside in Sri Lanka, especially in the highlands. They are the products of at least 200 million year biological evolution and adaptation to the shifting of continental plates, massive volcanic eruptions and periods of glaciation. This extraordinary gift of nature to Sri Lanka is not widely appreciated and is under threat of permanent loss. The study of biogeography opens our eyes to the nation’s priceless biological heritage and underscores the urgency of safeguarding it.
The aims of this report are: firstly, to reiterate the importance of focusing not merely on the species, but especially on the subspecies of Sri Lankan mammals for conserving their diversity (Dittus, 2013); secondly, to relate the taxonomic differentiation of mammals to their biogeography, through geological time (Figure 1) and to the various contemporary phyto-climatic environments of Sri Lanka; and finally, to reflect on the status and challenges of conserving mammalian biodiversity in relation to ecology and supporting habitats.
Why is biogeography of interest? It is the study of the distribution of species and ecosystems in geographic space and through geological time. Organisms and biological communities often vary in a regular fashion along geographic gradients of latitude, elevation, isolation and habitat area, leaving clues to pivotal turning points in evolutionary history. The phenomenon was first brought to our attention formally in the 19th century by the Prussian naturalist Alexander von Humboldt who documented it among plants (phytobiography) (Humboldt, 1805); Alfred Wallace described it later among animals (zoogeography) (Wallace, 1876); and it was pivotal empirical support for clarifying the process of natural selection by Charles Darwin (Darwin, 1859), and continental drift (known today as plate tectonics) by Alfred Wegener (Wegener, 1915). The seminal work by MacArthur and Wilson (1967) established the modern quantitative study of biogeography and described many of the processes involved.
Knowing the phylogeny of organisms and why they are found in their present locations is important for making informed conservation decisions. So we need an appreciation of the evolutionary process and ecological adaptation. The evolution of new forms of life rests on
http://orcid.org/0000-0001-7981-3968
individual and population differences in phenotypic adaptations to local environments. If the environment changes, so do the adaptations to it.
Volcanic activity and glacial bursts create an instant impact on the environment. Change in environmental properties can also be gradual over long periods of time, such as plate tectonics, continental glaciation, and climate change. The affected habitats vary in extent and location, and it may involve local or mass extinctions of life. Within a species, genetic and phenotypic changes arising in one population may spread to neighboring ones, even across geographic barriers, through dispersal. Alternatively, population differences may develop through vicariance, when a formerly widespread population is subdivided through geographic barriers, such as mountains or oceans that prevent genetic exchange. Phenotypic adaptation to the environment, therefore, is a dynamic process that has given rise to a great diversity of living and extinct organisms differing in their global distribution over contrasting landscapes. MacArthur and Wilson (1967) provided a theoretical and practical framework for analyzing biogeographical phenomena, and Heaney (1986) applied it to the mammals of Southeast Asia.
Recent advances in molecular genetics adds an important new dimension to this body of knowledge (Riddle et al., 2008). Insofar as evolution involves alterations in the frequency of genes responsible for phenotypic adaptation, an examination of genetic profiles of taxonomic relationships is useful in defining the development of phylogenetic relationships on a geological time scale and for the construction of phylogenetic species trees (Murphy et al., 2001a, b; Sims et al., 2009). In the context of Sri Lankan mammals, for example, molecular studies have clarified our understanding of the genetic population structure and/or taxonomic relationships in macaque monkeys (Shotake et al., 1971; Hoelzer et al., 1994), leopards (Miththapala et al., 1991, 1996), elephants (Fernando et al., 2000) and shrews (Meegaskumbara et al., 2007, 2008). When molecular data are combined with information about ecology, or niche requirements, it provides a greater resolution not only of a taxon’s past, but also of its potential for future survival. Knowing
the limits of a taxon’s adaptation in terms of ecology and geographical distribution across varying environments is clearly useful information for conservation planning.
Reflecting on the origins of Sri Lankan mammals gives us a deeper appreciation of their unique nature and place in relation to other mammals in the world, including humans, and to other faunal groups of Sri Lanka and the region.
THE ORIGIN OF SRI LANKAN MAMMALS The break-up of Pangea
The geological history of Sri Lanka is closely tied to that of India; both were linked at the heart of the ancient supercontinent of Pangea during the Mesozoic when Sri Lanka was geologically connected to Madagascar, Africa, southern India and Antarctica (Dissanayake and Chandrajith, 1999). The first mammal-like creatures evolved under the ecological dominance of the dinosaurs on this supercontinent. These early mammals, known as morganucodontids, were no larger than the size of a cat and represented the ancestors of both marsupial and placental mammals.
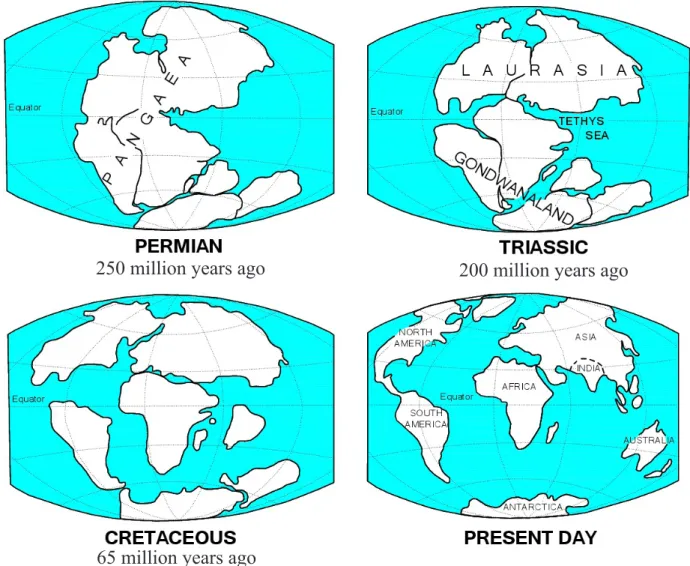
Under the force of plate tectonics Pangaea began to break up during the Jurassic period, about 150 to 220 Million years ago (Mya) into two major supercontinents pulling apart: Laurasia to the north (including North America, Europe and Holarctic Asia) and Gondwana to the south (the southern continents) (Figure 2). At this time also, the first marsupial mammals evolved in Laurasia and spread into some parts of southern Gondwana by way of still existing connections as the two supercontinents pulled apart. While Laurasia stayed more or less intact as a supercontinent in the north, about 180 Mya Gondwana broke into a jigsaw puzzle of continents and isles in the Southern Hemisphere.
One of those was a giant island forming what we now call India (including Sri Lanka). The other fragments of Gondwana comprised the two huge land masses; one including South America, Africa and Madagascar and the other Australia and Antarctica (Figure 2).
Just prior to the split of Gondwana, fossil evidence from 125 Mya points to a substantial fauna of the first placental Figure 1:Geological time table.
Figure 2: The geological history of India and Sri Lanka in relation to plate tectonics. Sri Lanka has always been connected to the Indian subcontinent that was part of Pangaea during the Permian period (250 to 300 Mya). Pangaea split apart at the end of the Triassic (200 Mya) into two supercontinents: Laurasia to the north and Gondwana drifting southward. Gondwana itself broke apart about 180 Mya ago into progressively more separated landmasses that we know today as South America, Africa, Antarctica, Australia, the Arabian Peninsula and India. For about 90 My India drifted rapidly northward as an isolated island in the Thethys Sea and crashed into Laurasia about 35 to 55 Mya to take up its present position. Fluctuating sea levels have repeatedly submerged or emerged the land bridge connecting India and Sri Lanka at the shallow Palk Strait during the Pleistocene (Modified from The Future Mapping Company, UK).
mammals (Eutheria) in central Laurasia coexisting with dinosaurs (Ji et al., 2002). About 65.5 Mya, at the end of the Cretaceous period, an asteroid plummeted into our planet at what is now Chicxulub, Mexico. The catastrophe set off major climatic and ecological upheavals that spelled the end for the age of dinosaurs, as well as for some early mammals (Alvarez et al., 1980; Schulte et al., 2010). The globally ubiquitous geological strata marking this event are referred to as the Cretaceous-Paleogene (K-Pg) boundary.
The extinction of non-flying dinosaurs after the K-Pg boundary opened ecological niches; the remaining early mammals could exploit previously inaccessible resources.
Within a few million years of the impact the fossil record shows an explosion in mammalifan diversity in Laurasia (Halliday et al., 2015). This proliferation by-passed the ancestral placentals and instead involved mostly an ancient mammal lineage, the rodent-like multituberculates that themselves became extinct, leaving no descendants to the
present (Bininda-Emonds et al., 2007). The extinctions near the K-Pg boundary, particularly in India and Sri Lanka, may have been exacerbated by major basalt flow volcanism on the Deccan at about 65 Mya shortly after the asteroid struck the earth (Bajpai, 2009).
The integration of molecular data, the fossil record, and theoretical models can give probing but sometimes conflicting views of the evolutionary past. For example, analysis of a comprehensive data set relating to mammalian origins suggested that most placentals originated after the K-Pg boundary in the early Cenozoic (O’Leary et al., 2013). However, a reanalysis of the same data set along with new evidence placed the placental mammal origins substantially before the K-Pg boundary (Tarver et al., 2016), in keeping with earlier estimates (Eizirik et al., 2001; Ji et al., 2002). These Eocene placentals, with pre-K-Pg roots, are the ancestors of modern mammalian groups (perissodactyls, artiodactyls, primates, rodents, and
250 million years ago 200 million years ago
65 million years ago
carnivores) we know today (Bowen et al., 2002; Solé and Smith, 2013; Halliday and Goswami, 2016).
The “out of Asia” hypothesis for the origin of Indian and Sri Lankan mammals
India was marooned as an island from Gondwana in the Jurassic (150-200 Mya), before flowering plants were common and marsupials or placental mammals had evolved.
Therefore, the early biota of India would have been like that of the rest of Gondwana at that time. It would have had dinosaurs as well as early types of Mesozoic mammals.
Of a more primitive evolutionary grade than the marsupials or placentals, these primitive types (Gondwanatheria) were widespread in the Mesozoic world (Krause et al., 1997;
Cox and Moore, 2010). For many years scientists had no fossil evidence of ancestors of any of the large mammals we now associate with India — elephants, tigers, lions, primates. This created a great scientific mystery: How did India get its mammals?
According to the leading “out of Asia” hypothesis Laurasia was the site of evolution of the placental mammals.
These placentals dispersed southward, outcompeting and replacing the marsupials on still connected land masses (excluding Australia) (Bowen et al., 2002). Furthermore, the theory posits that after tectonic forces caused India to crash into Laurasia between 55 to 35 Mya, or possibly later (Aitchinson et al., 2007), the ancestors of these mammals moved into India from Africa (again reconnected to Laurasia), Southeast Asia and northern Asia. These immigrant mammals spread out across the Indian subcontinent, occupying climates to which they were best adapted and at times diversifying into new species (Bowen et al., 2002). This hypothesis is strongly supported by the absence of marsupial or placental fossils on the Indian subcontinent prior to its collision with Laurasia 55 to 35 Mya.
One of the most enigmatic biogeographical puzzles relating to this hypothesis is posed by the highly disjunct distribution of living strepsirrhine primates; the Lorisidae (loris) and Galagidae (bushbabies and pottos). The crown strepsirrhine lineage has African roots dating back to the late Eocene (about 40 Mya), and split into one galagine and two lorisine lineages shortly thereafter (about 38 Mya) (Seiffert et al., 2003; Pozzi et al., 2015). One lorisine lineage remained in tropical Africa with the galagines, the other migrated north out of Africa and into Asia by way of temporary Afro-Arabian land bridges (Masters et al., 2005).
Once in Asia, this lineage split into the primorida of genera Nycticebus, now found in Southeast Asia, and Loris, now found in India and Sri Lanka (Yoder, 1997). This evidence of a past dispersal event involving thousands of kilometers is surprising in the light of the limited vagility of lorises as well as the fact that their much more mobile sister taxon, the Galagidae, does not occur outside sub-Saharan Africa (Masters et al., 2005).
The “out of India” hypothesis
More recent evidence challenges the “out of Asia” view.
Firstly, phylogenetic reconstructions based on molecular genetics and taking into account the first appearance of
placental fossils in Laurasia 125 Mya, suggest that the oldest stem eutherian placental mammals originated earlier from Gondwana rather than Laurasia (Woodburne and Springer, 2003; Rose and Archibald, 2005). Secondly, fossils with European (Laurasian) kinship and representing the precursors of modern perissodactyls, primates and rodents were found in north-western India mixed with typical Gondwanan fauna, from a period (54 Mya) that predated the collision of India with Asia (Rose et al., 2014).
This has given rise to suggestions of occasional Laurasian land connections (chains of island stepping-stones) to India as the island plate traversed the ocean towards northern Asia (Masters et al., 2006; Ali et al., 2008), particularly during ocean low levels in the Oligocene (Schlanger and Silva, 1986; Miller et al., 2008).
Alternatively, these modern forms developed from early Pangaean mammals on the Indian plate itself during its long period of isolation (65 to 90 My) from the rest of Gondwana and Laurasia (Figure 2). When India collided with Laurasia, these modern descendants of Gondwanan origin spilled into Asia and populated the mammalian fauna in keeping with the “out of India” hypothesis (Murphy et al., 2001a; Solé and Smith, 2013; Rose et al., 2014). Until the true origin of the European type mammals dug up in India is resolved, and the timing between phylogenetic divergences in relation to geological events (Aitchison et al., 2007) are substantiated, all contending hypotheses are on hold (Bajpai, 2009; O’Leary et al., 2013; Tarver et al., 2016).
The “out of India” hypothesis, though equivocal for the origin of Cenozoic Indian mammals is consistent with the origin of relics among plants, freshwater fish, crustaceans, amphibians, reptiles and some insects and birds for which the ancestors of these biota were present in Gondwana before India fragmented off from Pangaea in the Jurassic (Karanth, 2006). Datta-Roy and Karanth (2009) outline different scenarios for the origin of non-mammalian Indian biota.
The Tertiary period globally and in Sri Lanka
The Tertiary period (65.5 Mya to 1.8 Mya) was marked by a cooling trend from tropics to ice age. At its beginning much of the earth was tropical and subtropical and reached a thermal maximum during the Eocene at about 55.8 Mya. The warm and moist Eocene and Oligocene epochs witnessed the second peak in the diversification of placental mammals that was facilitated by a combination of events.
Firstly, a spread of dense forests and angiosperm plants at the expense of archaic gymnosperms, a trend that actually began in the Cretaceous (Bininda-Emonds et al., 2007;
Berendse and Scheffer, 2009). Secondly, the extinction of small-bodied multituberculate mammals that had been competing with the placentals. Lastly, a spike in oxygen concentrations in the earth’s atmosphere in the Eocene and Oligocene; high oxygen levels are necessary for the physiology of placental reproduction.
This correlation between an increase in atmospheric oxygen and placental body size and diversity began when placental mammals first appeared in the Cretaceous (93 -
120 Mya). Shortly thereafter, however, oxygen levels and placental diversity fell and remained low for long periods and across the K-Pg boundary, then peaked again in the Eocene and continued through the Tertiary (Falkowski et al. 2005). It culminated in the megafauna of mammals that characterized the subsequent Quaternary period. The ancestors of today’s elephants were part of this Eocene
“explosion” of megafauna (Deraniyagala, 1955).
India crashed into Laurasia during the Oligocene (35 - 55 Mya) forming the Himalayas (Aitchinson et al., 2007).
As the climate cooled towards the end of the Oligocene, glaciation in Antarctica lowered sea levels and opened land bridges (Rohling et al., 1998). Sri Lanka was positioned in the southern hemisphere during that epoch and the Sri Lankan highlands were under an ice cap, leaving behind tell-tale erratic boulders (Katupotha, 2013). With further global cooling in the Miocene the arctic also developed an ice cap, forests gave way to grasslands. In the Oligocene ancestral carnivores were common and diversifying (Nyakatura and Bininda-Emonds, 2012). Primates with roots in the Paleocene to Eocene boundary, or possibly even earlier (90 Mya) (Tavaré et al., 2002), proliferated with ancestral monkeys and apes in the Miocene (Bowen et al., 2002; Martin 2003). The cooling and drying trend continued into the Pliocene and contributed to the spread of enormous savannahs and grasslands (Osborne, 2008) that supported the diversification of herds of large bodied grazing mammals (artiodactyls and perissodactyls) and their predators (Bobe and Behrensmeyer, 2004;
Vislobokova, 2008). The first hominids (Ardipithecus) appeared during the Pliocene in Africa (White et al., 2009).
The global cooling that accelerated in the Miocene lead to the development of polar caps in the Pliocene and continued into the Pleistocene ice age.
The Quaternary Period: extinction of megafaunal mammals globally and in Sri Lanka
The Pleistocene [1.8 Mya to 11.7 Thousand years ago (Kya)] is characterized by the expansion of polar and montane glaciers that at one time covered up to 30% of the earth’s land and sea surfaces. The climate was not static, glacial ice sheets advanced and retreated in cycles, especially in the northern hemisphere, and caused major changes globally in sea levels, habitat, vegetation and faunal composition (Cooper et al., 2015).
Since the Pliocene, Sri Lanka’s geographic position has been similar to how it is currently. The periodic low sea levels in the Pleistocene opened the land connection to India (Cooray, 1984) and facilitated a two-way dispersal of fauna across the Palk Strait in repeated waves. The last land bridge was cut off by rising sea levels 5-8 Kya as the Pleistocene gave way to warmer climates and the retreat of northern glaciers in the Holocene (Fleming et al., 1998;
Rohling et al., 1998; Milne et al., 2005). Sea levels in Sri Lanka have not changed in the last 3 Ky (Cooray, 1984).
During the Pleistocene epoch, Sri Lanka experienced heavy rainfall, stimulating the emergence of rain forest in the country and providing habitat for marsh loving animals (Sumanarathna, 2017). The mammal fauna of Sri Lanka was more varied in the Pleistocene than it is now. Fossil
remains in the alluvial deposits of the Sabragumuwa basin, known as the Rathnapura Fauna, indicated the former presence of hippopotamus Hexaprotodon, two species of the genus Rhinoceros, the Indian lion Panthero leo, the red dog Cuon javanicus, the gaur Bibos gaurus (Deraniyagala, 1958) and even the tiger (P. tigris) (Manamendra-Arachchi et al., 2005). It has been suggested that the transition early in the Pleistocene from dry open grassland savannah (habitat favorable for lions) to moist closed-canopy forest (habitat favorable for tigers) in the Holocene underlies the replacement of lions by tigers in the fossil record of Sri Lanka (Manamendra-Arachchi et al., 2005).
On a global scale, 97 of 150 genera of megafaunal mammals (defined as animals >44 kg) went extinct from about 50 Kya until the end of the Pleistocene (Barnosky et al., 2004). Prevailing explanations include human impacts (overhunting, fire), environmental changes, and a combination of both, but primarily driven by climate change (Cooper et al. 2015). Most of these losses were sustained in the glacier-laden northern hemisphere. In the southern hemisphere (except for Australia) 20 of 21 identified mammalian taxa from the past 100 - 200 Kya survived to the present.
The Indian subcontinent preserved a mosaic of ecosystems, ranging from tropical rainforests to grassland savannahs and deserts. This ecological diversity would have supported a large range of organisms. The majority of ancient taxa survived or adapted to substantial ecological pressures in an interconnected mosaic of fragmented habitats in the Asian tropics (Roberts et al., 2014). Notwithstanding, in Sri Lanka several megafauna, all of Indian origin, were lost (Sumanarathna, 2017). Why were they lost in Sri Lanka but not in India? The answer lies most likely in island biogeographical expectations (MacArthur and Wilson, 1967; Heaney, 1986) and local events. Compared to the size of the Indian subcontinent, Sri Lanka had a lesser diversity of vast areas of habitat necessary to sustain the extinct megafaunal mammals. Furthermore, challenges to survival would have been made worse by substantial local climate-related habitat turn-overs during the Pleistocene in Sri Lanka (Katupotha, 1995, 2013).
The impact of humans on megafaunal mammals globally and in Sri Lanka
Expanding human populations are thought to have exacerbated the impact of climate change on the extinction of megafaunal mammals in the late Pleistocene to Holocene transition (Cooper et al., 2015). Genetic and archaeological evidence from Africa and Asia support a coastally oriented dispersal of modern humans from eastern Africa to southern Asia about 60 - 50 Kya (Mellars et al., 2013), as well as multiple exits, varying terrestrial routes, a sub-divided African source population and a degree of interbreeding with archaic varieties of Homo (Boivin et al., 2013). The most ancient remains of anatomically modern Homo sapiens in South Asia have been found in cave deposits of the Upper Pleistocene in Sri Lanka (Kennedy et al., 1987). These foragers from 20 Kya, at the transition from the Pleistocene to the Holocene, exploited semi- open rainforest and forest edge products and influenced
these habitats (Roberts et al., 2015). In light of the faunal remains of mostly small animals in the middens of these cave dwellers (Perera et al., 2011) it seems unlikely that this population of early human hunter-gatherers had a major role on the extinction of the island’s megafauna.
That is not to say that humans have not impacted Sri Lankan megafauna; one example being the elephant.
Selective trophy hunting and the massive export of Sri Lankan elephants (for labor, ceremony and warfare) over the last 2-3 millennia (Jayewardene, 1994) may be responsible for the low proportion (less than 8%) of tusked males in Sri Lanka, compared to 45-90% of tuskers on the Indian subcontinent or nearly 100% in Sumatra (Kurt et al., 1995).
The scarcity of tuskers in Sri Lanka has been attributed also to natural variation among geographically isolated populations (Deraniyagala, 1958), or to the founder effect and genetic drift (Fernando et al., 2000). Notwithstanding, humans did influence elephant populations insofar as the dispersal of elephants from different origins by human traders has resulted in a mixing of mitochondrial DNA among formerly isolated populations in Myanmar, Sri Lanka and India (Fleisher et al., 2001). The scarcity of tuskers in Sri Lanka has stimulated the importation of tuskers from India for ceremonial purposes (Jayewardene, 1994). These domesticated tusked imports are closely managed and their reproductive contribution to wild Sri Lankan elephant populations is doubtful (Kurt et al., 1995).
DIVERSIFICATION OF THE MODERN MAMMAL FAUNA OF SRI LANKA
Following the Pleistocene extinctions of megafaunal mammals in Sri Lanka, as evident in the fossil record (Sumanarathna, 2017), Sri Lanka was left with the contemporary suite of mammals. Sri Lanka is home to 108 unique taxa of mammals under the umbrella of 91 species and 53 genera (Dittus, 2013) among native land living forms. If marine and introduced land mammals were included there are at least 125 species among at least 77 genera in Sri Lanka (Yapa and Ratnavira, 2013). Sri Lanka represents less than 2% of the South Asian land area, but harbours nearly 25% of South Asian mammal species.
The taxonomic classification of Sri Lankan mammals has been dealt with comprehensively by the standard works of Phillips (1935, 1980) who uniquely distinguished and described the subspecies among the different species of mammals. Phillips’ work was updated by Eisenberg and McKay (1970) and reviewed recently by Dittus (2013).
Colorful illustration and descriptions of mammals, mostly at the level of the species, can be found in the very readable and comprehensive volume by Yapa and Ratnavira (2013) and as a hand guide by de Silva Wijeyartne (2008).
Subspecies of primates have been attractively illustrated by Pethiyagoda et al. (2012) and Nekaris and de Silva Wijeyaratne (2009).
A distinguishing feature of the flora and fauna of Sri Lanka is its high degree of endemism. Endemism is a measure of the degree of taxon divergence from a common, often geographically widespread ancestral type, and reflects phenotypic adaptation to a unique restricted environment.
Sri Lanka’s topography and climate are highly variable within a relatively small area of 65,610 km2, and the island’s generally high biodiversity has been linked to localized floral and faunal trait adaptations (Eisenberg and McKay, 1970; Ashton et al., 1997; Bossuyt et al., 2004;
Gunatilleke et al., 2004; Weerakoon and Goonatilake, 2006;
Kathriarachchi, 2012). Forests rich in plant species are also rich in animal species, and there is a direct correlation between the numbers of endemic plants and endemic animals found in sample plots of forests (Figure 4.6, Green and Gunawardena, 1997). Mammals are but one radiation in a web of interactions among substrate, flora and fauna, and given almost 1000 endemic angiosperms in Sri Lanka (listed by Wijesundara et al., 2012) it is not surprising that mammals, too, would show a high degree of endemism (Dittus, 2013).
Species, subspecies and the Evolutionary Significant Unit (ESU)
Given that mammalian phenotypes vary geographically within a species, and some of these population variants are distinct and unique to Sri Lanka, or endemic, it raises the question on which taxonomic level should we focus for scientific consideration and conservation management?
From the point of view of unravelling evolutionary trajectories as well as conservation, the focus should be on the adaptive diversity across the range of a taxon, which reflects its evolutionary success (Moritz, 2002; Hey et al., 2003). Traditionally, intra-specific variation in mammals has been documented and taxonomically classified by the use of subspecies. In other words, the focus of attention should be at the taxonomic level of the subspecies rather than the species. This is particularly so for mammals, where conservative taxonomic tradition has assigned subspecies status to phenotypic variants among populations where ichthyologists or herpetologists, for example, would assign species status.
To give weight to intra-specific variation for the practice of conservation management, the idea of the Evolutionary Significant Unit (ESU) has been introduced (Ryder, 1986).
The ESU is an operational concept designating groups of organisms that should be managed separately (Vogler and DeSalle, 1994). The identification of ESUs is based on concordance between sets of data (genetic, morphological, ecological, behavioural) as outlined, for example, by Mortiz (1994). The ESU therefore is a population unit that merits separate management and has a high priority for conservation (Crandall et al., 2000).
While genetic information is a desirable back-up for deciding ESU identity, in practice it is rarely available, whereas historically traditional phenotypic descriptions and morphometric analyses often have been well documented for subspecies, particularly for the Sri Lankan mammals.
O’Brien and Mayr (1991) suggested that subspecies are logical conservation units because members of a subspecies share a unique geographic range or habitat, a group of phylogenetically concordant phenotypic characters, and a unique natural history relative to other subdivisions of the species. Dittus (2013) outlined the rationale for the importance of a focus on subspecies as ESU’s applied
to Sri Lankan mammals. The approach is buttressed by comparing the prevalence of endemic mammals at different taxonomic levels; 3 of 53 genera (6%), and 22 of 91 species (24%) are endemic, but incorporating subspecies, the majority 69 of 108 (64%) Sri Lankan land-living indigenous mammal taxa are diversified as endemics.
The environmental arena for mammalian diversification Climate, and to some extent soil, interact to determine vegetation form, which in turn influence mammalian ecology and faunal composition (Eisenberg, 1981). Eisenberg and McKay (1970) updated the nomenclature of Phillips (1935, and revised in 1980) and confirmed and extended the ranges of known named forms, basing their revisions on museum collections as well as on field observations.
These authors also commented on the proposed validity of subspecies, and analyzed the distribution of mammalian fauna in relation to habitat types.
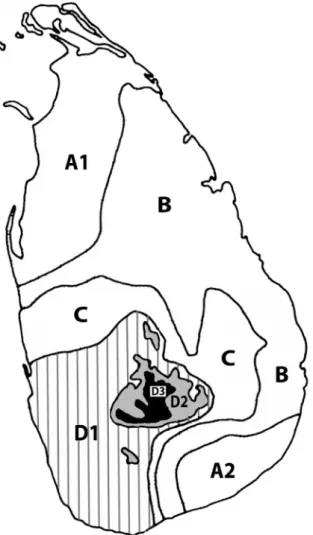
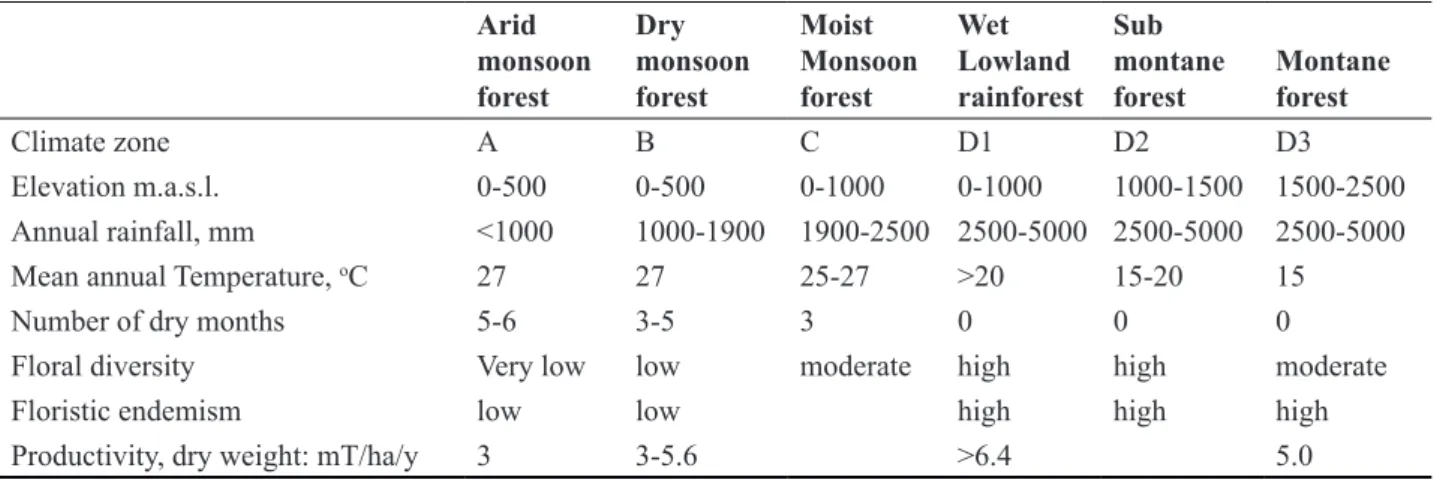
Following the climate maps of Mueller-Dombois and Sirisena (1967), Eisenberg and McKay (1970) recognized seven different phyto-climatic zones (Figure 3) and related the distribution of terrestrial mammalian taxa accordingly.
The lowland arid zone (A) supports dry monsoon scrub jungle and grassland that occur in the extreme north and northwest (A1) and extreme southeast (A2) of the island. The most extensive area (B) includes the lowland
dry monsoon forest and grassland of what is commonly known as the “dry zone.” A belt of transitional inter- monsoon forest (C) separates the dry zone from the wet zone. Rainforests in the south-west and the central massif of the island occur below 1000 m (D1), between 1000 m to 1500 m (D2), and above 1500 m (D3). The phyto- climatic zones differ in rainfall, temperature, months of drought, floral diversity, endemicity and forest productivity (Table 1). The boundaries between these habitat types are inexact and local variations occur. For example, in zone D3 Wijesinghe et al. (1993) distinguish between and
“intermediate” and “wet” montane zones. Floristic and habitat variations occur on a finer scale within the dry zone (e.g., Dittus, 1977a, 1985a; Perera, 2012), lowland wet zone (Gunatilleke et al., 2006; Kathriarachchi, 2012) and montane wet zone (Wijesundara, 2012). Variations in habitat properties have also been assessed, under GAP analyses, with a view towards watershed management and ecosystem conservation (Jayasuriya et al., 2006) and the reduction of forest cover loss (Mattsson et al., 2012).
Such data would be invaluable for future ecological studies and conservation applications (Pethiyagoda, 2012b;
Miththapala, 2015).
Regardless of zonal classifications, the contrasts and gradients in habitat constitute the different environmental contexts wherein mammalian phenotypic adaptations
Figure 3: The climatic zones of Sri Lanka are: arid lowlands (A1 and A2), dry zone lowland (B), intermediate zone (C), rainforests of the lowland (D1, striped), midland (D2, dark gray) and montane regions (D3, black).
evolved. Eisenberg and McKay (1970) pointed out that all of the major ecological feeding niches are filled by Sri Lankan mammals, but compared to that of South India the mammalian fauna of Sri Lanka is less diversified; there being fewer species to fill these niches. This suggests firstly, that ecological niches of Sri Lankan mammals are broader than on the subcontinent, and secondly, that this
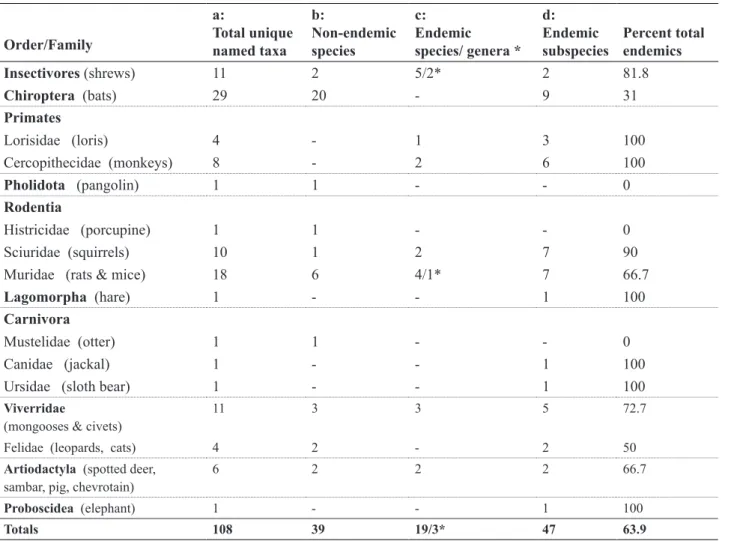
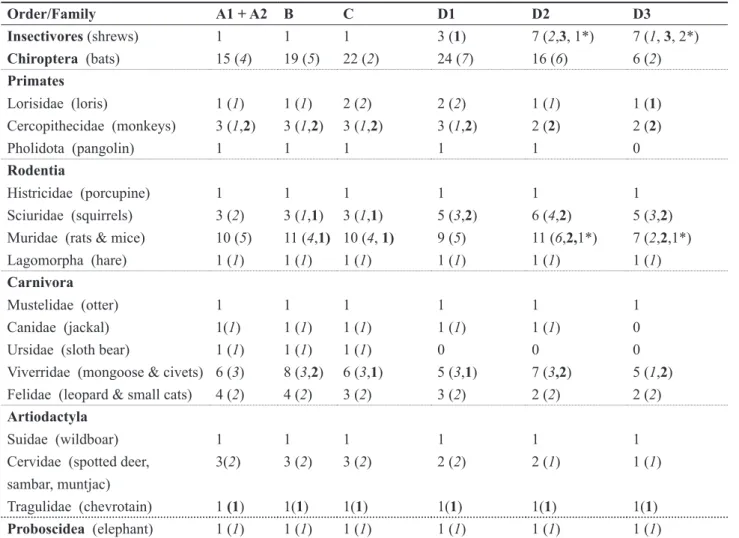
Table 2: The numbers of (a) native uniquely named terrestrial mammal taxa, separated according to the numbers of (b) non-endemic species, (c) endemic species and genera, and (d) endemic subspecies that occur in all forest types in Sri Lanka (Summary of Appendix 1).
Order/Family
a: Total unique named taxa
b:Non-endemic species
c:Endemic species/ genera *
d:Endemic
subspecies Percent total endemics
Insectivores (shrews) 11 2 5/2* 2 81.8
Chiroptera (bats) 29 20 - 9 31
Primates
Lorisidae (loris) 4 - 1 3 100
Cercopithecidae (monkeys) 8 - 2 6 100
Pholidota (pangolin) 1 1 - - 0
Rodentia
Histricidae (porcupine) 1 1 - - 0
Sciuridae (squirrels) 10 1 2 7 90
Muridae (rats & mice) 18 6 4/1* 7 66.7
Lagomorpha (hare) 1 - - 1 100
Carnivora
Mustelidae (otter) 1 1 - - 0
Canidae (jackal) 1 - - 1 100
Ursidae (sloth bear) 1 - - 1 100
Viverridae
(mongooses & civets) 11 3 3 5 72.7
Felidae (leopards, cats) 4 2 - 2 50
Artiodactyla (spotted deer,
sambar, pig, chevrotain) 6 2 2 2 66.7
Proboscidea (elephant) 1 - - 1 100
Totals 108 39 19/3* 47 63.9
greater niche breadth is subdivided among subspecies or ESUs. The latter proposition was examined earlier (Dittus, 2013). The emphasis here is on the role of habitat in the geographic distribution and conservation of mammalian diversity.
Table 1: Climatic and biotic properties typical of the major climatic zones and forest types of Sri Lanka.
Arid monsoon forest
Dry monsoon forest
Moist Monsoon forest
WetLowland rainforest
Sub montane
forest Montane forest
Climate zone A B C D1 D2 D3
Elevation m.a.s.l. 0-500 0-500 0-1000 0-1000 1000-1500 1500-2500
Annual rainfall, mm <1000 1000-1900 1900-2500 2500-5000 2500-5000 2500-5000
Mean annual Temperature, oC 27 27 25-27 >20 15-20 15
Number of dry months 5-6 3-5 3 0 0 0
Floral diversity Very low low moderate high high moderate
Floristic endemism low low high high high
Productivity, dry weight: mT/ha/y 3 3-5.6 >6.4 5.0
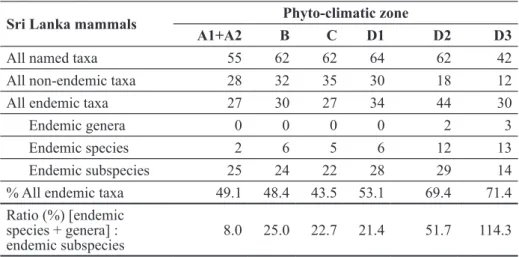
Table 3. The distribution of the numbers of native uniquely named terrestrial mammal taxa, N, endemic subspecies (N), endemic species (N) and endemic genera (N*) among the major phyto-climatic zones of Sri Lanka.
Order/Family A1 + A2 B C D1 D2 D3
Insectivores (shrews) 1 1 1 3 (1) 7 (2,3, 1*) 7 (1, 3, 2*) Chiroptera (bats) 15 (4) 19 (5) 22 (2) 24 (7) 16 (6) 6 (2) Primates
Lorisidae (loris) 1 (1) 1 (1) 2 (2) 2 (2) 1 (1) 1 (1)
Cercopithecidae (monkeys) 3 (1,2) 3 (1,2) 3 (1,2) 3 (1,2) 2 (2) 2 (2)
Pholidota (pangolin) 1 1 1 1 1 0
Rodentia
Histricidae (porcupine) 1 1 1 1 1 1
Sciuridae (squirrels) 3 (2) 3 (1,1) 3 (1,1) 5 (3,2) 6 (4,2) 5 (3,2)
Muridae (rats & mice) 10 (5) 11 (4,1) 10 (4, 1) 9 (5) 11 (6,2,1*) 7 (2,2,1*)
Lagomorpha (hare) 1 (1) 1 (1) 1 (1) 1 (1) 1 (1) 1 (1)
Carnivora
Mustelidae (otter) 1 1 1 1 1 1
Canidae (jackal) 1(1) 1 (1) 1 (1) 1 (1) 1 (1) 0
Ursidae (sloth bear) 1 (1) 1 (1) 1 (1) 0 0 0
Viverridae (mongoose & civets) 6 (3) 8 (3,2) 6 (3,1) 5 (3,1) 7 (3,2) 5 (1,2) Felidae (leopard & small cats) 4 (2) 4 (2) 3 (2) 3 (2) 2 (2) 2 (2) Artiodactyla
Suidae (wildboar) 1 1 1 1 1 1
Cervidae (spotted deer, sambar, muntjac)
3(2) 3 (2) 3 (2) 2 (2) 2 (1) 1 (1)
Tragulidae (chevrotain) 1 (1) 1(1) 1(1) 1(1) 1(1) 1(1)
Proboscidea (elephant) 1 (1) 1 (1) 1 (1) 1 (1) 1 (1) 1 (1)
The diversity of mammals in relation to their biogeography
Taking habitat type as a proxy for potential ecological niche specialization, it was useful to examine mammalian phenotypic diversity at the level of the species and subspecies and its relation to this proxy. A compilation of this data (Appendix 1) was based primarily on Phillips (1980) and Eisenberg and McKay (1970) who considered subspecies in relation to habitat. Where these publications differ in subspecies designations, the more conservative application of Eisenberg and McKay (1970) was followed.
The nomenclature for genera and species was updated to conform to recent taxonomic revisions as referenced by authors in Appendix 1. With a few exceptions, subspecies designations have not been closely scrutinized in the recent literature.
The data of Appendix 1 were summarized in relation to the numbers of endemic and non-endemic taxa (genera, species and subspecies) according to taxonomic Order and Family (Table 2) and to the distribution of these taxa among the different phyto-climatic zones (Table 3).
Among the 9 land-living orders of mammals of Sri Lanka, there are 91 species among 53 genera. Of these, 22 (24%) are endemic species. Among polytypic orders
the proportions of endemic species is highest among insectivores (70%) and primates (60%), being nearly twice those found among rodents (32%) and Artiodactyla (33%), and more than among the carnivores (19%). Bats have no endemic species. The Carnivora (5 Families) and Artiodactyla (3 Families) have one and two endemic species, respectively. There are no endemic species among the geographically widespread monotypic orders (elephants and hares) or monotypic families (otters, sloth bears).
Mammalian diversity and endemism come to the fore with a finer resolution when incorporating subspecies in the compilation. There are 108 documented unique named taxa at the level of the species or subspecies and more than half (64%) of these are endemic (compared to only 24% of endemic species). The proportions of all endemic forms below the level of the genus is highest among the primates (83% to 100%), moderately high (67% to 82%) in the insectivores, rodents, carnivores and ungulates, and relatively low (31%) among the bats. Among the monotypic orders, the elephant and hare are considered Sri Lankan subspecies. Similarly, among the monotypic genera of Artiodactyla, the spotted deer and possibly the sambar are peculiar subspecies (Table 2).
Mammal taxa differed in their geographic distribution
Table 4: Comparison of the distribution of non-endemic and endemic mammal taxa (genera, species and subspecies) and the rates of taxonomic differentiation across different phyto-climatic zones.
Sri Lanka mammals Phyto-climatic zone
A1+A2 B C D1 D2 D3
All named taxa 55 62 62 64 62 42
All non-endemic taxa 28 32 35 30 18 12
All endemic taxa 27 30 27 34 44 30
Endemic genera 0 0 0 0 2 3
Endemic species 2 6 5 6 12 13
Endemic subspecies 25 24 22 28 29 14
% All endemic taxa 49.1 48.4 43.5 53.1 69.4 71.4
Ratio (%) [endemic species + genera] :
endemic subspecies 8.0 25.0 22.7 21.4 51.7 114.3
across climatic zones and in the degree of endemic differentiation (Table 3). The fewest numbers of named taxa occurred in the extremes of the climate spectrum, namely the arid zone (A1 and A2) and the very restricted montane zone (D3). These two extremes differed markedly from each other, however, in the number of endemic taxa that they harboured, 49.1% (zone A) and 71.4 % (zone D3). The number of named taxa across the more moderate climatic zones (B to D2) was fairly equally distributed at 62 to 64 taxa (Table 4). There was, however, a trend for an increase in the number and proportion of endemic taxa from the dry zones (A and B) and intermediate zone (C) into the wet zones (D). Within the wet zone itself, the proportion of endemics increased with altitude from D1 to D3. Most of the endemic taxa in the wet hill zones (D2 and D3) involved the shrews, squirrels, rats and mice (Table 3). Presumably the high rates of reproduction and low vagility among these small bodied mammals promoted rapid adaptation to their respective niches, culminating in the evolution of at least three endemic genera Solisorex, Srilankamys and Feroculus (Appendix 1). Assuming in situ evolution from endemic subspecies to higher endemic taxa, differences in the rate of natural selection (phenotypic change) towards niche specialization among all Sri Lankan mammals would be reflected by the ratio (endemic species and genera: endemic subspecies). The ratios indicated an increasing taxonomic differentiation from the arid (A: 8%) to the dry, moist and wet lowlands (B to D1: mean 23%), submontane (D2: 53%) and montane zones (D3: 114%) (Table 4).
Among the primates, Sri Lanka has at least 12 endemic ESU adaptations (subspecies) to the different climatic zones. Of the 5 species, three are also endemic (Macaca sinica, Semnopithecus vetulus and Loris tradigradus).
Populations of the gray langur (Semnopithecus priam) and one of the two species of loris (Loris lydekkerianus) have species counterparts in South India. From a regional perspective, Sri Lankan primates show the highest diversity per unit land area among south Asian primates (Dittus, 2013). Similarly, the relatively small bodied civets and mongooses (Viverridae) are taxonomically diverse (Groves et al., 2009) and exhibit endemic taxa in all zones with
overall 74% endemism. The smaller bodied chevrotains (Tragulidae) among the Artiodactyla have evolved one endemic species widespread from the arid zone (A) to the submontane zone (D2) and another is restricted to the montane zone (D3) (Groves and Meijaard, 2005).
The bats have the greatest number of genera and species, are widespread from the arid (zone A) to submontane (zone D2), but are less prevalent in the more restricted land area of upper hills (D3). Bats have no endemic species and relatively few (31%) endemic subspecies (Table 2).
McKay (1984) suggested that the lack of endemic bat species is the outcome of an absence of local effects owed to the bats’ potentially high vagility. A similar argument might be made for absent or low endemism among the largest land mammals that can move fairly easily over long distances. This includes the elephant, leopard, wild boar, spotted deer, sambar, sloth bear, and jackal. If body size can be taken as an index of long distance mobility, then there is an inverse relation between the percent of endemic taxa (subspecies to genus) and mammal body size or vagility (Figure 4). The ability to move easily over long distances over the landscape, particularly in the lowland dry zone, would promote gene flow among neighboring populations and counteract local phenotypic ESU distinctiveness. Such gene exchanges, too, may have occurred in geological time between northern Sri Lanka and southern India. The shallow Palk Strait isthmus provided land bridges to India and the opportunity for faunal exchanges during frequent sea-level low-stands in the Pleistocene.
Evolutionary specialization towards endemism in the dry zone (A + B) was low (Table 4) and is consistent with frequent gene exchange among neighboring populations within Sri Lanka and historically with southern India. Bats and rodents present the highest number of species (Table 2). Unlike other mammals, however, the bats show the highest proportion of non-endemics (Table 2) supporting the notion that, given their vagility, most bat species in Sri Lanka range into distant lands.
Did the montane endemic mammals have more time to differentiate by virtue of being older than mammals of lower elevations? The Pliocene (5.6 to 2.5 Mya), just prior
to the Pleistocene ice ages, was warmer and sea levels were higher, suggesting that Sri Lankan mammals were marooned on what is now the highlands, the lowlands being under water. With the retreat of the sea to lower levels in the Pleistocene, exposure of the lowlands and the opening of the isthmus to southern India, dispersers from the highlands together with new immigrants from the mainland would retard endemism in newly opened habitats, which now are represented by the lower elevation regions within zones A1, A2, B, D1 and C.
For South Asian nonvolant fauna in general, 5 -25 km sea channels have proven substantial barriers to dispersal and island colonization with consequences for genetic diversity (Heaney, 1986). In Sri Lanka, for example, the populations of leopard (Miththapala et al., 1991, 1996) as well as elephant (Fernando et al., 2000) are genetically less diverse than their mainland source counterparts, suggesting genetic founder events. Elephant populations showed further genetic differentiation among different regions within Sri Lanka.
It is appropriate to close these generalized considerations with caveats. The indicated numbers of taxa and their distributions by climatic zone (Appendix 1, Tables 3 and 4) are limited by published reports of a few investigators.
Although the biogeographic patterns are apparent, the numerical details are expected to change with future research. The ranges of some taxa, particularly into the zone C may be greater (or less) than indicated. Most recently, morphometric comparisons among loris populations point to two new subspecies (Gamage et al., 2017 online).
Phylogenetic studies, in particular, have uncovered at least five new species that formerly were thought of as subspecies (Groves and Meijaard, 2005; Meegaskumbura et al., 2007; Meegaskumbura and Schneider, 2008; Groves et al., 2009; Dissanayake and Oschida, 2012). Baker and Bradley (2006) estimate that genetic investigations will uncover >2,000 new and “cryptic species” worldwide.
The trend in our knowledge is for greater rather than lesser species diversity among Sri Lankan mammals. Finally, there is a seemingly unexplained absence of phenotypic diversification among such geographically widespread and
moderately vagile monotypic taxa as hares, porcupines, pangolins, and otters. Perhaps future investigations will identify population ESU differentiation?
The above analyses serve to predict which mammalian taxa one might observe in the different phyto-climatic zones of Sri Lanka and point to some hypothetical evolutionary drivers for the observed pattern of taxa differentiation and biogeography. The following section examines the likelihood of actually observing different mammalian taxa, the ecological challenges facing mammals and their conservation status.
THE CONSERVATION OF MAMMALS IN RELATION TO THEIR ECOLOGY AND BIOGEOGRAPHY
What once there was
Natural forest covered almost the entire island a few centuries ago comprising the dry zone forests (48,000 km2), lowland rainforest (12,500 km2), montane forest (3,000 km2) and unclassified (1,920 km2). Overall closed forest cover has dwindled from 84% in 1884 to less than 22% in 2016 (after Legg and Jewell, 1995; GOSL, 2000;
FAO, 2005, 2010). Forest loss was greatest in the wet zone, particularly in the lowlands, where most humans dwell. Of the original lowland rainforests (D1) less than 2.1% (141 km2) now remain as fragmented, degraded and isolated patches throughout the lowland wet zone (Kathriarachchi, 2012). Likewise, the submontane and montane ecoregion forests have been reduced to 1% (30 km2) comprising isolated fragments of degraded habitat (Wijesundara, 2012).
Published descriptions of the lowland and montane forests give details about species composition, ecological properties, threats facing them, the fauna that they support and conservation status (Gunatilleke and Ashton, 1987; Gunatilleke and Gunatilleke, 1991; Ashton et al., 1997; Wikramanayake and Gunatilleke, 2002a, b, c;
Kathriarachchi, 2012; Wijesundara, 2012). Although there are 31 different protected areas in the lowland rainforest region, and nine at higher elevations, most are small in Figure 4: The relation between the prevalence of endemic mammal taxa (subspecies, species and genera) and mammal body size.
Protected areas/climate
zone A1
km2 [n]
A2 km2 [n]
B km2 [n]
C km2
[n]
D1 km2 [n]
D2 km2
[n]
D3 km2 [n]
Total km2 [n]
Dept Wildlife Conservation
National Parks 404 [3] 3,407 [7] 1,980 [10] 371 [1] >1 [1] 32 [2] 6,194 [24]
Strict Nature Reserve 289 [1] 15 [1] 11 [1] 315 [3]
Nature Reserves 533 [3] 80 [1] 613 [4]
Sanctuaries Forest,
predominantly 41 [2] 94 [4] 942 [11] 440 [2]1 7 [6] 130 [2]2 1,654 [27]
Wetlands & mangrove 75 [2] 39 [2] 76 [9] 190 [13]
Tanks 22 [1] 43 [1] 373 [6] 11 [1] 449 [9]
Dept Forestry
Biosphere Conservation
Area 250 [1] 109 [1] 359 [2]
Conservation Forest 112 [1]3 133 [12] 245 [13]
Other important FRs 154 [1] 59 [1] 213 [2]
Total 621 [7] 3,908 [15] 4,132 [34] 923 [4] 395 [31] 130 [2]2 123 [4]2 10,232 [97]
1 Victoria-Randenigala-Rantebe Sanctuary, spans B + C
2 Peak Wilderness Sanctuary, spans D2+D3
3 Knuckles Conservation Forest, spans C+D2
areas, with exception of the Sinharaja National Heritage Wilderness Area (112 km2) in the lowland rainforest and the Peak Wilderness area (120 km2) that straddles the submontane and montane regions (Table 5).
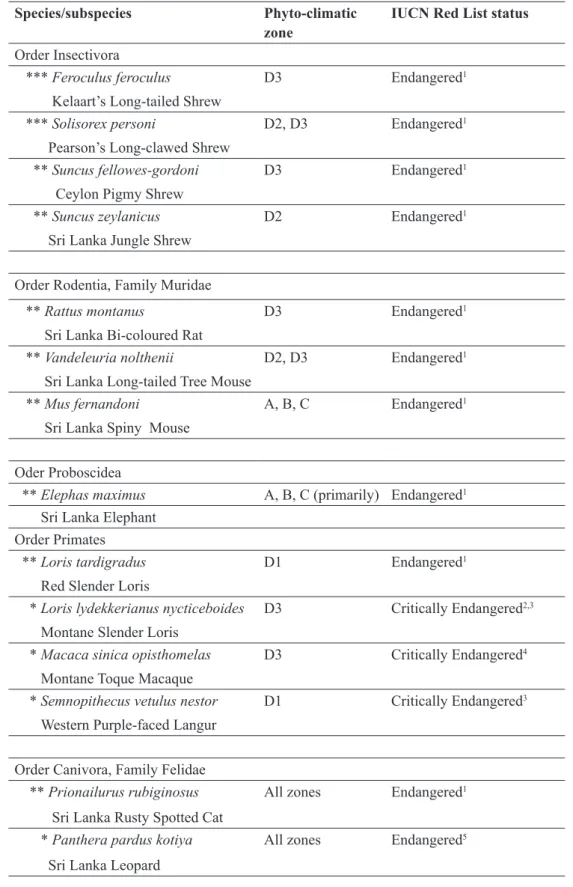
The montane and/or submontane (D2, D3) forests constitute the exclusive homes for 22 mammalian taxa, and the partial homes for an additional 38 taxa. Eight of the taxa that are confined to the highlands are endemics (genus, species or subspecies) and all of them are either Endangered or Critically Endangered (MOE, 2012; Dittus, 2013; IUCN 2017). The highlands are the exclusive habitat for the highest proportion (8/14 = 53%) of endangered endemic mammals in Sri Lanka (Table 6). The few PAs in these hills are small and subject to continuous habitat loss and degradation (Wikramanayake and Gunatilleke, 2002c; Wijesundara, 2012). Pethiyagoda (2012a) described most of the mammals encountered in or near the Horton Plains National Park of zone D3. Mammals that potentially conflict with humans outside of these PAs are persecuted (Gamage et al., 2010; Dittus, 2012; Kittle et al., 2014).
The critically endangered endemic montane toque macaque (Macaca sinica opisthomelas) lacks even legal protection.
The Sinharaja is the largest reservation for lowland rainforest biodiversity and is supplemented by many smaller forest fragments that offer suitable habitat especially for mammals of relatively small body sizes and limited home
ranges (Table 5). Jayasekera et al. (2007) observed 14 species of arboreal and terrestrial mammals typical of the area at fruit traps, and Ratnaweera and Wijesinghe (2009) suggested that populations of fruit eating rainforest rodents are limited by seasonal fruit shortages. Notably, the wet-zone toque macaque (M. s. aurifons) was rare inside forested areas, but was common at the forest peripheries in keeping with its ecological adaptation to “edge” habitats (Richard et al., 1989). Wijesinghe and Brooke (2005) and Wijesinghe (2012) have pointed out, however, that habitat disturbance, as occurs on forest edges, negatively impacts the small bodied mammal endemic niche specialists more than the non-endemic ones and may lead to a shift in faunal composition in such areas. The endangered endemic leopard (Panthera pardus kotiya) is the apex predator in Sri Lanka and its survival is best served by large extents of PAs of natural forest and protected corridors of vegetation connecting smaller areas (Kittle et al. 2014, 2017). The leopard’s versatile diet, which may include more than 60%
porcupines in areas where other prey are rare, contributes to the predator’s success outside of protected areas.
The lowland rainforest region north of the Kalu river lacks undisturbed original forest altogether. A moderately disturbed forest of about 21 km2, the Kalatuwawa and Labugama reservoirs, which supply drinking water to the city of Colombo, is valuable habitat, particularly for Table 5: The estimated numbers [n] and areas of extents of different categories of protected areas according to phyto-climatic zone.
Table 6: The distribution among phyto-climatic zones of Endangered and Critically Endangered endemic mammal taxa (*subspecies, ** species, *** genus).
Species/subspecies Phyto-climatic
zone IUCN Red List status Order Insectivora
*** Feroculus feroculus Kelaart’s Long-tailed Shrew
D3 Endangered1
*** Solisorex personi
Pearson’s Long-clawed Shrew
D2, D3 Endangered1
** Suncus fellowes-gordoni Ceylon Pigmy Shrew
D3 Endangered1
** Suncus zeylanicus
Sri Lanka Jungle Shrew
D2 Endangered1
Order Rodentia, Family Muridae ** Rattus montanus
Sri Lanka Bi-coloured Rat
D3 Endangered1
** Vandeleuria nolthenii
Sri Lanka Long-tailed Tree Mouse
D2, D3 Endangered1
** Mus fernandoni
Sri Lanka Spiny Mouse
A, B, C Endangered1
Oder Proboscidea
** Elephas maximus A, B, C (primarily) Endangered1 Sri Lanka Elephant
Order Primates ** Loris tardigradus Red Slender Loris
D1 Endangered1
* Loris lydekkerianus nycticeboides Montane Slender Loris
D3 Critically Endangered2,3
* Macaca sinica opisthomelas Montane Toque Macaque
D3 Critically Endangered4
* Semnopithecus vetulus nestor Western Purple-faced Langur
D1 Critically Endangered3
Order Canivora, Family Felidae ** Prionailurus rubiginosus Sri Lanka Rusty Spotted Cat
All zones Endangered1
* Panthera pardus kotiya Sri Lanka Leopard
All zones Endangered5
1Weerakoon (2012), 2Gamage et al. (2014); 3Mittermeier et al. (2006); 4Dittus and Gamage (2017). 5Kittle & Watson (2008).
the Critically Endangered western Purple-faced langur (Semnopithecus vetulus nestor) (Rudran, 2007) and other associated wildlife. Most remaining populations of the western Purple-faced langurs inhabit fragments of secondary forest in plantations or home gardens that face attrition (Dela, 2007). The replanting of silvicultural (pine) plantations with native forest species would contribute ecologically suitable habitat for the support of many species of wildlife in this area (Rudran et al., 2013; Jinie Dela, personal communication).
A close look at the Dry Zone as mammal habitat The purpose here is to examine some of the more salient ecological properties of the dry zone habitats in relation to ecological niches suitable for mammals. The dry zone comprises the largest segment (about 70%) of Sri Lanka’s landscapes and the majority of PAs occur there (Figure 5).
The extensive dry zone is not uniform in forest cover, forest type and floristic composition owed to regional variations in rainfall, soil, number of months of drought and human activity. It is a mosaic of vegetation types including forest- scrub, open grassland, savannah, scrub, as well as modified types (e.g., paddy and chena) as described by Koelmeyer (1958), Andrews (1961), Gaussen et al. (1964), Fernando (1968), Dittus (1977a, 1985a), and Perera (2005). The flora and conservation status of these areas has been reviewed (Wikramanayake and Gunatilleke 2002a; Perera, 2012). The forests of these areas are most often referred to as “Dry Evergreen”, “Dry Monsoon”, or “Semi-deciduous”
and other labels have also been applied (see, Dittus, 1985a).
Structurally, the dry evergreen forest has three layers;
a more or less continuous subcanopy of trees (above 5 m height) over-towered by a discontinuous upper canopy of emergent trees. A layer of shrubs occurs below 5 m. The floristic composition of the sub canopy of trees is generally more stable in species composition than the emergent layer, and its tree species richness (number of species), diversity, and average canopy height are directly related to rainfall amount and drought duration (Dittus 1977a). Therefore, the forests of zone B are more diverse, richer in species and taller than those of arid zones A (Andrews, 1961; Dittus, 1977a). In addition, regularly recurrent cyclones impact the northeastern coastal forests and occasionally penetrate deeply into the island’s central and western interior.
Cyclones cause most damage to the emergent tree layer, and Dittus (1985a) had suggested that the greater geographic variation in species composition typical of this uppermost layer may, in part, be a consequence of regularly recurrent cyclone damage. Cyclones affect not only forest structure directly, but also indirectly by negatively impacting the normally stable relationships between arboreal browsers and tree species composition (Dittus, 1985b). Past disturbance in the dry zone through chena cultivation, fire and two millennia of rice cultivation and irrigation schemes also have changed the character of the old growth forests and the extents of open grasslands and savannah in the dry zone (Gaussen et al., 1964; McKay, 1973; Perera, 2005).
The biological importance of ‘Weera’: mother tree of the dry zone
The ‘Weera’ tree (Drypetes sepiaria) is a key floral constituent of dry zone forests, contributing the greatest proportion of trees; from 10% of all tree stands in the relatively moist regions to more than 50% in the arid regions such as the Madhu and Panama PAs (Dittus, 1977a). A typical cross section of these forest (Figure 6) in a relatively moist area of Polonnaruwa (1671 mm rainfall, 3-4 months of drought) illustrated that Drypetes plays a dominant ecological role with the greatest Importance Value Index of Curtis and McIntosh (1951) (Dittus, 1977a).
Extensive surveys of Sri Lankan forests were carried out in the 1950’s in an effort to inventory harvestable timber trees. The Drypetes tree with its gnarled, furrowed and twisted trunks certainly was unsuitable as timber, and was condemned as a “problem junk tree” useful only as fuel wood (Andrews, 1961).
Other than timber, however, the biological properties the Drypetes tree distinguish it as the most important biological asset (arguably second only to water) for sustaining the floral and faunal biodiversity of the dry and arid zones. The tree is a hardy and drought resistant evergreen that does not shed its thick leathery leaves, even in the driest of months.
It retains moisture in the soil beneath its canopy, provides year round shelter for plants growing in its shade, and it is a crucial source of fruit for animals at the peak of the annual drought. ‘Weera’ is most often associated in dry habitats with the ‘Palu’ tree (Manilkara hexandra) that is similarly drought resistant and forms a discontinuous emergent layer Figure 5: The total size of all protected areas distributed according to phyto-climatic zones and administering government departments.
of large shading crowns, albeit, at a far lower densities than ‘Weera’. Studies by Hladik and Hladik (1972) have shown that a single average sized fruiting tree of Drypetes produces over 50,000 fruits per annum, or an average of 17.5 kg of nutrient rich pulp. The seeds themselves provide additional food for animals capable of processing woody seeds (e.g., many rodents). Fruit is produced in prodigious amounts just prior to the drought in April and May. Much of this bounty falls to the ground and dries as “raisins.” Animals seek these raisins when many other forests resources have been exhausted at the peak of the drought from June to September. The tree also produces leaf flush in the dry months and this serves as food and moisture for browsers. Drypetes, far from being useless, is a critical component for sustaining the biodiversity of a generally unproductive dry zone that blankets over 70% of Sri Lanka’s land area. The official and unofficial wanton destruction of this tree constitutes an environmental assault matched only by a similar eradication of the wet zone forests in the 19th Century up to the present.
Carrying capacity for mammals of the dry zone
To the untrained eye a visit to any one of the protected areas of the dry zone forests may impart the impression of bountiful verdant habitat to support animal life. Indeed, wildlife management practices, whereby “problem” elephants, monkeys and other creatures have been translocated to these areas is based on such an uninformed assumption.
The bounty of the habitat is an illusion: ecological studies have shown these dry and arid zone protected areas to have
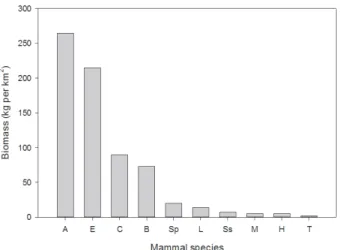
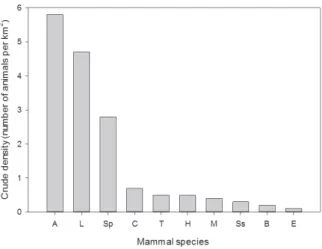
the lowest plant productivity among Sri Lankan forests (Table 1) and comparable forest in other tropical regions (Hladik and Hladik, 1972). Consequently, their carrying capacity for mammals is generally low, as illustrated by ecological studies of the Wilpattu and Gal Oya National Parks (Figure 7 and 8). The most common large mammal, the spotted deer (Axis axis) has a crude density of less than 6 deer per km2 at Wilpattu (before the recent war) and even less at Gal Oya. Mammal densities and forest habitat were reduced in most dry zone areas, including the protected ones, through hunting and poaching, especially during the protracted war (Santiapillai and Wijeyamohan, 2003).
Local variations in vegetation type affect mammal species densities. Thus, in areas such as Wilpattu, where the forest understory is widespread, the biomass of browsing species (axis deer, sambar and muntjac) is greater than in sparsely forested areas such as Gal Oya NP. On the flip side, the extensive grasslands and savannah habitats, as found at Gal Oya NP, support greater densities and biomass of grazing mammals (elephant, buffalo and hare) than the closed forest habitats (McKay, 1973).
Elephants, buffalos and sambar, with relatively large body sizes and total biomass (Figure 7), have very few individuals per square kilometer (Figure 8). The herbivores (elephant, axis deer, sambar, buffalo, hare, and langurs) have a generally higher biomass than mammals dependent upon less common or predictable food sources such as fruiting trees, tubers or anthills (Figure 7). Water influences mammal distributions indirectly through its Figure 6: Cross section of a typical dry monsoon forest habitat for dry zone mammals, as at Polonnaruwa, Sri Lanka, indicating the distribution of the major tree species according to the frequency of numbers of trees by their height. (After Dittus, 1977a).