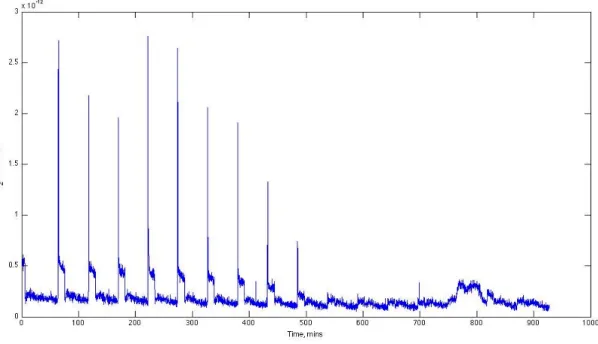
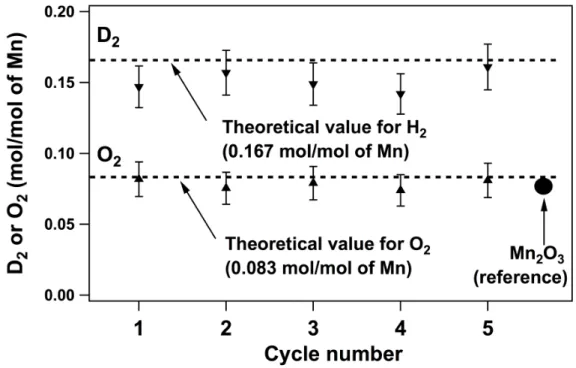
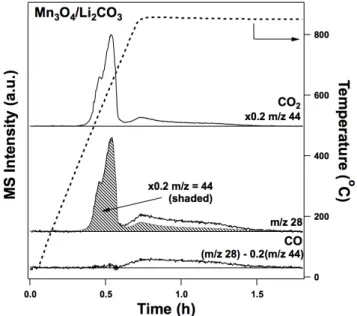
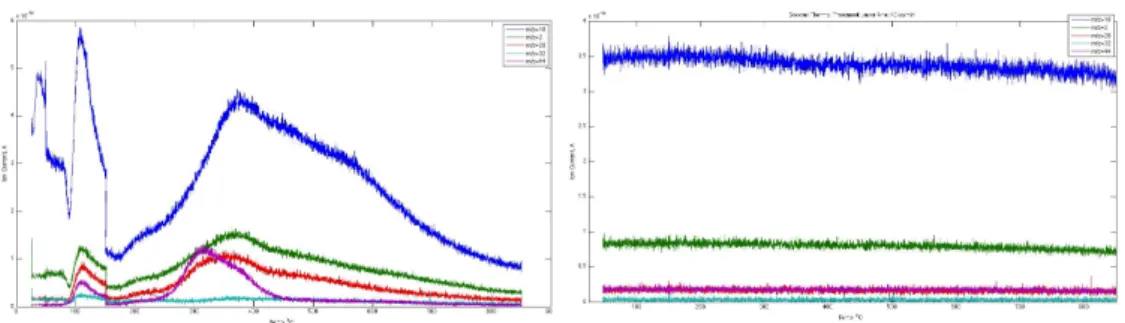
45 Figure 6-6 Multiple cycles of the Mn-based thermochemical water splitting system. bottom track) in the absence of water. The part of the data included in the box is used to use for the product distribution analysis.
Overview of Thesis
This chapter looks at the effect that this treatment has on both some of the characterizations carried out on the zeolites and on the catalytic activity. Finally, Chapter 15 concludes this part of the thesis by summarizing the main findings of the various studies that were carried out.
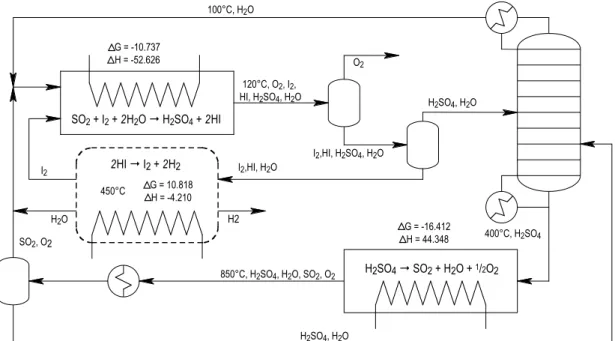
Introduction to Thermochemical Splitting of Water
This cycle is an example of the case where the metal oxide is thermally reduced to the metal. From the above two sections of this work, the shortcomings of the two types of thermal water splitting cycles are evident.
These groups must be removed from the material to obtain a pure material for metal oxide impregnation. CuO was used as the metal oxide to prove that for the thermal reduction step, particle size changes affect the thermodynamics of the thermal reduction step.
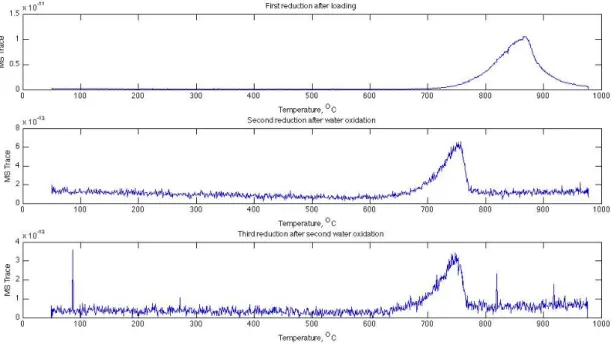
This indicates a change in the nature of the species, which decreases between the first and second heat treatments. The total integral of unaccounted oxygen was 95% of the oxygen integral seen in the second and third.
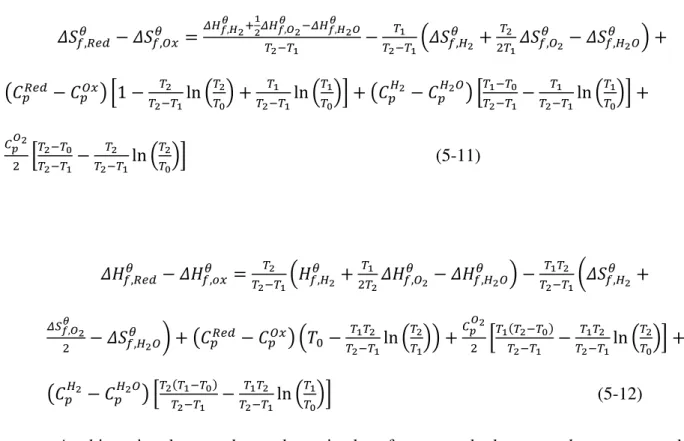
Thermodynamic analysis of 2-step water splitting cycles #
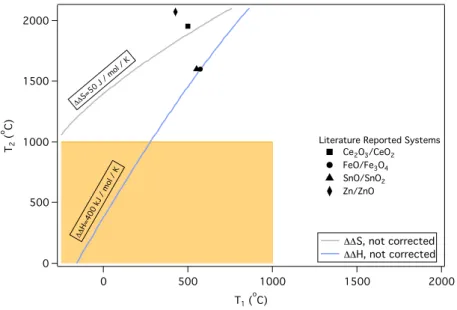
The next step is to combine the terms so that the tabulated enthalpic and entropic expressions are the subjects of the formulas. The partial pressure of oxygen in the thermal reduction step is set to 1/100 of the reference pressure (1% oxygen and 99% carrier gas) for Fig.
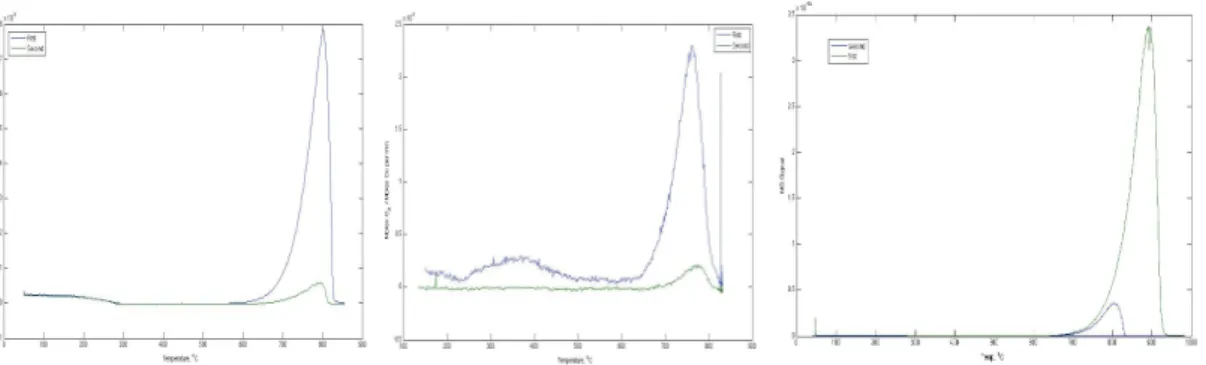
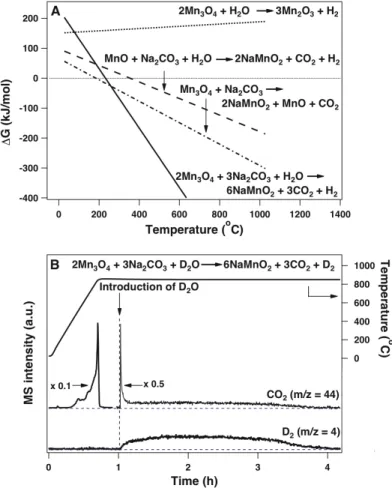
The introduction of Na2CO3 drastically changes the thermodynamics of the oxidation reaction; the ΔG of the reaction decreases with increasing temperature and becomes negative around 250oC (Fig. 6-2A, solid line). These thermodynamic estimates are consistent with our experimental observations, in that water does not react with Mn3O4 in the absence of Na2CO3 at 850oC, and the amount of D2 obtained by reacting D2O (D2O is used instead of H2O to increase signal-to-noise -ratio in the product detection and quantification) with the Mn3O4/Na2CO3 mixture at 850oC corresponds to the amount that would be expected when Mn2+ is completely converted to Mn3+ (Fig. 6-2B). We confirmed that this step can occur independently at 850oC. ΔG for both steps decreases with increasing temperature and becomes energetically favorable above 400oC, (Fig. 6-2A).
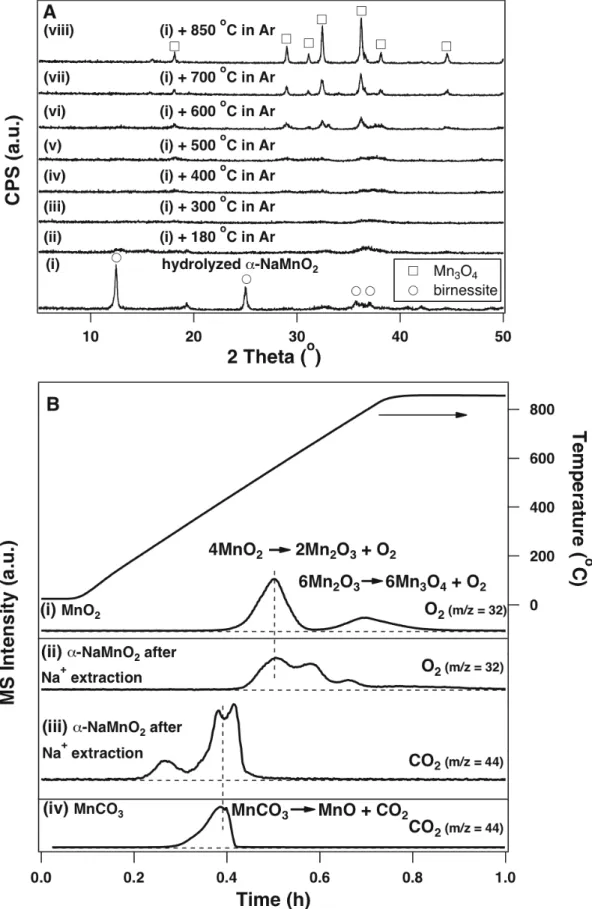
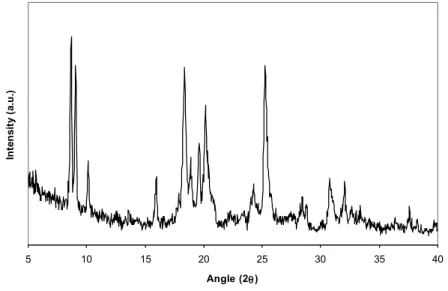
The XRD pattern of the solid obtained after the hydrogen evolution reaction (steps 1 and 2 in Fig. 6-1) contains α-NaMnO2 and a hydrated product α-Na0.7MnO2.14 (Fig. Water can intercalate and expand in these layers the distance between adjacent layers to form sodium birnessite (Fig. 6-4)11, as evidenced by the disappearance of the diffraction peak at 16.7o in α-NaMnO2 and the appearance of the 12.5o peak in birnessite (Fig.
Both the hydrogen and oxygen evolution steps are performed at 850oC in the Mn-based cycle, corresponding to the temperature of the highest temperature step in the currently piloted sulfur-iodine system13. The Mn-based system involves no corrosive materials, while almost all previously reported multi-stage low-temperature thermal water splitting cycles have toxic and/or corrosive intermediates in one or more of the steps of the cycle. However, their cycle was not closed due to the use of sacrificial Fe2O3 to extract Na+ from sodium manganese iron oxide produced in the hydrogen evolution step16.
Sodium sources other than Na2CO3, such as NaOH, have also been used to facilitate the oxidation of Mn2+ to Mn3+ in the water splitting step17. Furthermore, Na2CO3 must be recovered from the aqueous solution in the Na+ extraction step.
Other Spinel structures #
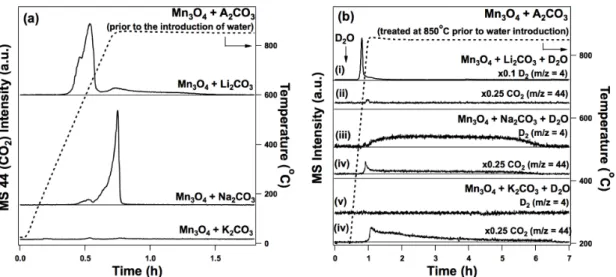
A fraction of the Mn(II) and the rest of the Mn(III) are contained in an amorphous Mn3O4. D2O was used instead of H2O to obtain a better signal-to-noise ratio of the signal in the hydrogen evolution step (m/z = 4 for D2 instead of m/z = 2 for H2). About 80% of the Fe(II) is oxidized by CO2 (produced from the reaction between Fe3O4 and Na2CO3) during the temperature rise to 750°C in Ar.
The temperatures for the initiation of the D2 evolution for Fe3O4 and carbonates during the temperature ramp-and-hold in D2O/Ar (5%/95%) are all around 500°C. Therefore, it is not surprising that none of the Co3O4-based systems are active for hydrogen evolution or CO2 reduction reactions.
Conclusions from Materials for thermochemical cycles
First, supercritical CO2 in the presence of vapor phase water could be used to attempt to extract the alkali metal as an alkali carbonate. Thus, a possible way to explore this further is in a flow system in the presence of supercritical CO2. Particular attention must be paid to the extraction of the alkali metal cation, as this step is currently the most energy inefficient step in the entire cycle.
If a material consists entirely of tetravalent atoms (Si, Ge) in the tetrahedral positions, the resulting framework is charge neutral. Naturally, zeolites form under hydrothermal or sedimentary conditions in the presence of large amounts of alkali metal and silica-alumina cations.
Building scheme for MEL and MFI
Periodic Building Unit
As previously mentioned, crystal structure confirmation and determination of zeolites and zeotype solids is typically performed with X-ray diffraction measurements. Although this work does not describe the synthesis and crystal structure solution of a new material, this technique has been used in the characterization of all the materials that have been made for reaction testing, and the obtained spectra were compared with known spectra in the literature. Elemental characterization of the materials was performed using energy dispersive spectroscopy (EDS) using a JEOL JSM-6700F instrument equipped with an Oxford INCA Energy 300 X-ray energy dispersive spectrometer.
As such, there is a large synthetic and characterization component associated with catalytic testing of the materials.
Connection mode
- HZSM-5
However, there appears to be consensus in the literature on the intermediates through which the reaction proceeds. For this part of the thesis, the flow reactor unit (from the one described in the first part of this work) had to be rebuilt for use in the reaction. There are straight channels in the 010 direction (vertical direction in the left panel), and perpendicular to this, in the 100 direction, is a sinusoidal 10-membered ring channel (horizontal direction).
To “activate” the acid sites in the zeolite, the solids were calcined in situ under a stream of ultra-high purity argon at 580ºC. The first of these papers looked at the effect of reaction temperature, Si/Al zeolite ratio and methanol pressure on reaction selectivities.
Channels and/or cages
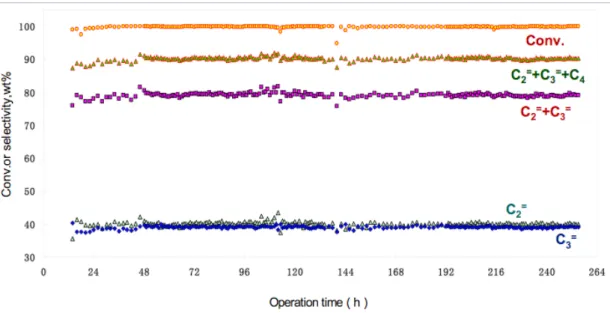
At the end of the reactor, a cyclone separates the solid catalyst from the reactants and products. In an effort to do this, a step-by-step study of various parameters of the catalyst structure that can influence the selectivity in the MTO reaction is studied. Then, at the optimal cavity width, the length of the pockets was varied to try and understand how this affected the selectivity to different products.
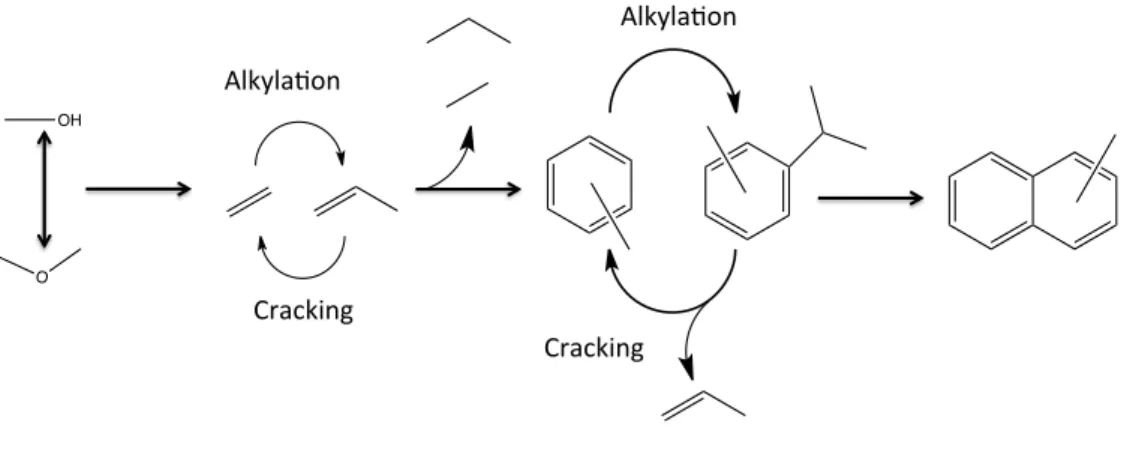
Therefore, the relative rate of the alkylation-cracking sequence will determine the selectivity for the desired light products. For each of the structures, the effect of temperature variation was looked at to understand the effect of reaction temperature on the selectivity for different frameworks.
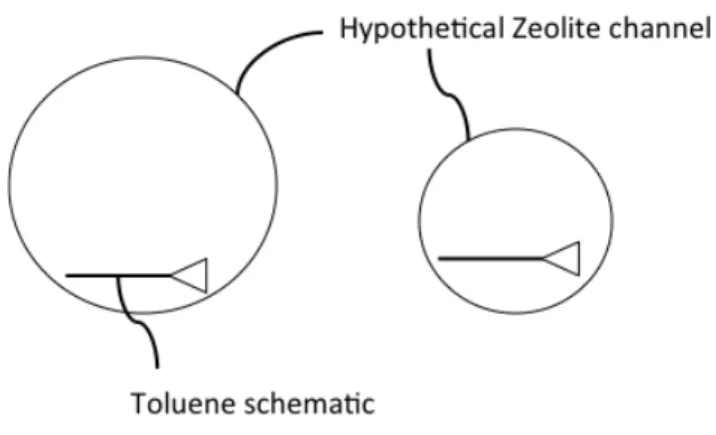
Effect of channel size and shape on MTO reaction
The selectivity to ethylene and propylene was used as an indicator of whether the restriction effects changed the stabilization of the intermediates in the desired direction. As with other studies conducted to date, there are some caveats to the approach to examining the effect of channel cross-section. Most of the materials presented here have been previously synthesized in the laboratory, and possible synthesis protocols used are indicated.
Thus, given these data, the effect of channel eccentricity on product selectivity in the methanol-olefin reaction is inconclusive. However, when looking at channel eccentricity as a whole, no trend was found.
Effect of cage size variation #
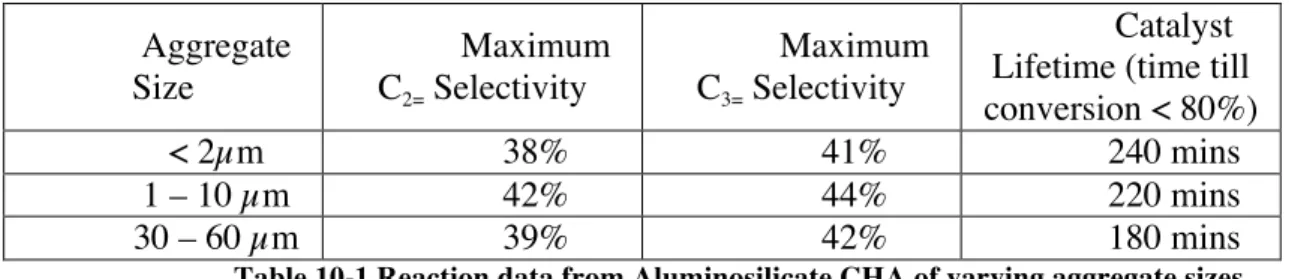
One caveat of the characterization used above is that the aluminum distribution in the crystals is assumed to be homogeneous. To change the Si/Al of the studied structures, two different approaches were used. The AFX material has the shortest lifetime, and the worst carbon balance of the three materials studied.
The GC/MS distribution data suggest that the carbonaceous species formed during the reaction correlate with the size of the cavities present in the respective frameworks. Changes in the Si/Al ratio of the CHA and LEV materials caused changes in the primary crystallite sizes, and the results are shown in Figure 11-8.
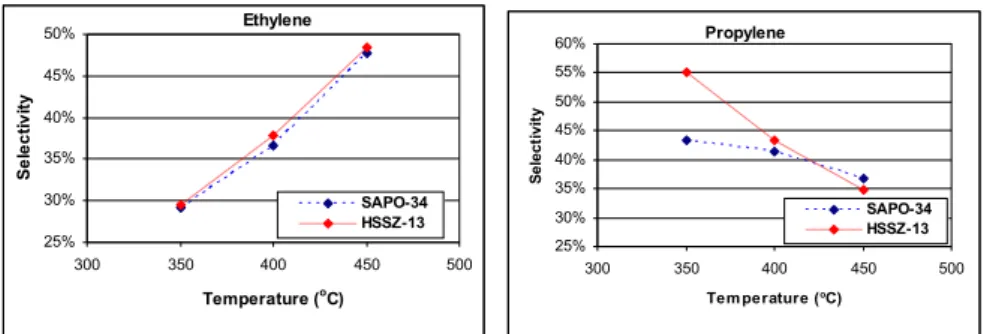
Effect of framework composition variations
The catalyst was thus calcined, replaced and activated in the same way as the aluminosilicate catalysts described so far. Ga-CHA does not show a smooth trend in the C3=/C2= ratio as the regular CHA material does. In the case of CHA, this likely means that the alkylaromatic species that are part of the hydrocarbon pool mechanism for olefin formation.
All these syntheses were carried out by replacing some of the silicon content in the synthesis gel with oxides of the respective atoms. Since this structure was not discussed in previous sections, Figure 12-8 shows a cartoon of the AEI cage.
Summary of frameworks studied
- ITE-RTH
The carbon balance was poor (< 60%), with most unreported products being dimethyl ether. The dependent variables selected were the means of the maximum and minimum C3=/C2= ratios for each material. The structures considered were the aluminosilicate analogs of the AEI, AFX, CHA, LEV and RTH structures.
The expression for the number of T-atoms in the cage cancels out with the definition of acid site concentration as used in this exercise, so cage size does not seem to matter in this fit either. This chapter summarizes some of the more interesting materials that have been tested and the conditions under which these materials were tested.
Conclusions & future directions for structure effects on MTO reaction
The only exception was the LEV structure, where the SAPO produced a higher C3=/C2= ratio than the aluminosilicate. Finally, a large number of readily accessible frameworks (detailed in chapter 13) have been synthesized and tested for their activity in the MTO reaction. Only a small number of small pore zeolites can be synthesized with high Si/Al ratios that enable meaningful catalytic testing for the MTO reaction.
As mentioned in the conclusion above, as part of this thesis, a large general review of materials was performed to obtain a library of materials whose reaction data are known. As mentioned in the previous section of this chapter, a large number of 8-MR structures were tested as part of this thesis.