.
I
.
SH
207 TR4
#25 .
III
The CoastalEnvironmentalProfileof
S'e:gara Anakan-CJ laca~p, . SouthJava,Indonesia
Editedby
AlanT. White,PurwitoMartosubrotoandMarieSol M.Sa'tlorra
.
"
The Coastal Environmental Profile of
Segara Anakan-Cilacap, South Java, Indonesia
The Coastal Environmental Profile of Segara Anakan-Cilacap,
South Java, Indonesia
Edited by
Alan T. White, Purwito Martosubroto and Marie Sol M. Sadorra
Association of Southeast Asian Nations1 United States
Coastal Resources
Management ProjectTechnical Publications Series 4
The Coastal
Environmental
Profileof Segara Anakan-Cilacap,
South Java, Indonesia
Published by the:
International Center for Living Aquatic Resources Management on behalf of the Association of Southeast Asian NationslUnited States Coastal Resources Management Project Printed in Manila. Philippines
White, A.T., P. Martosubroto and M.S.M. Sadorra, editors.
1989. The coastal environmental profile of Segara Anakan-Cilacap, South Java, Indonesia. ICLARM Technical Reports 25, 82 p. International Center for Living Aquatic Resources Management, Manila, Philippines
Cover: (Front) False color composite of Bands 1,2 and 3 of landsat-MSS sub-irnage taken on 17 May 1987 and processed at Earth Resources Satellite Ground Receiving Station, National Institute of Aeronautics and Space (LAPAN), Indonesia. Shown, among others, are Nusa Kambangan (bslow), which looks like part of the main island of Java, Cilacap (lower right). Cilacap Bay and Segara Anakan (left) with its various levels of turbidities and swampy area.
(Back, counterclockwise) ( 1 ) The accretion of silt adjacent to the mangrove forest continues with the high rate of sedimentation to Segara Anakan. (2) Traditional crab fishermen place their traps near the mangrove forest in protected waterways. (3) Segara Anakan fishermen market some of their catch in the nearby town of Cilacap through fish vendors.
ISSN 01 15-5547 ISBN 971-1022-54-0
ICLARM Contribution No. 522
Contents
List of Tables List of Figures
List of Acronyms and Abbreviations Preface
Foreword Chapter 1.
Chapter 2.
Chapter 3.
Chapter 4.
Introduction, Tatang Sujastani and Ecology Team - Bogor Agricultural University
Geography and Physical Setting, Ecology Team - Bogor Agricultural University, Mulia Purba and Tatang Sujastani
Segara Anakan
Segara Anakan Catchment Area and Land Use Climate
Hydrology, Tides and Currents Sedimentation Patterns
Natural Resources, Ecology Team - Bogor Agricultural University and Tatang Sujastani Water
Soils
Mineral Resources Coastal Forest General Fauna Fisheries
Population, Socioeconomics and Land Use, Tatang Sujastani
Demography
Health and Water Supply Education
Housing Employment Income
Transportation, Communication and Infrastructure Land Use and Ownership
vii
IX
xi xiii xv
Chapter 5. Economic Sector, Ecology Team - Bogor Agricultural University and Tatang Sujastani Fisheries
Aquaculture Development
Chapter 6. Institutional and Legal Framework, Alan T. White and Punvito Maflosubroto Legal Acts Affecting CRM
Institutions
Coordinating Ministries Central Line Ministries Universities
Nongovernmental Organizations Cilacap and CRM
Chapter 7 . Coastal Resources Management Issues and Plan Formulation, Alan T. White and Purwito Martosubroto Coastal Resources
Management Issues
Information Needs for Management Management Planning and Options References
List of Tables
Change in Segara Anakan land and water areas (ha) from 1900 to 1984 (Ludwig 1985).
~ i d a l s w a m p and a,ssociated saline areas, Segara Anakan and environs (Ludwig 1 984).
Morphometrical data of Segara Anakan (ET 1984).
Climatological data for Cilacap and its adjacent area in maximum and average of 10 years (Uktolseya 1984).
Climatological characteristics of the broad study area and Segara Anakan (ECI 1979a).
Hydrology of rivers tributary to Segara Anakan (Ludwig 1985).
Peak flow rates and velocities in ocean and lagoon entrances under various tidal conditions (ECI 1987).
Values of the surface and near-bottom water parameters of Segara Anakan, May and July 1980 (Birowo and Uktolseya 1982).
Physical, chemical and biological characteristics of Segara Anakan (ET 1984).
Water quality average conditions based on surveys conducted by IHE-ARD-MPW in Segara Anakan in March, June and October 1983 and January 1984 (Ludwig 1985).
Pesticide residue in water column (pg/l) of Segara Anakan, 1982.
The contents of phosphate and nitrate (mg/l) in Cilacap mangrove forest waters, 1980-1 982 (Winata and Muchtar 1984).
Primary productivity (mg C/m3/3 hr) in Segara Anakan (ET 1984).
Zooplankton density (ind./rn3), 1983 (ET 1984).
Zooplankton density (ind./rn3) observed in Segara Anakan-Cilacap waters, 1980- 1981 (Sutomo 1984).
Macrobenthic invertebrate density (ind.lm2) in Segara Anakan, 1983 (ET 1984).
Estimated mangrove area (ha) affected by exceptionally high tide (ET 1984).
Mangrove species found within the transects (Sunaryo 1982).
Net primary production of litter in Segara Anakan as estimated from observations of marked shoots, 1983 (ET 1984).
Estimated tree stem density (N) (treestha) and biomass (B) (m31ha) of dominant mangrove species in the four zones, excluding those on islands (ET 1984).
Net primary production of litter of some mangrove species in Segara Anakan, 1983 (ET 1984).
Composition (number and percentage) of fish and shrimp larvae found in the mangrove habitats in the four zones, 1983 (ET 1984).
Common animals found in Cilacap mangrove forest, 1980 (Hardjosoewarno et al.
1982).
lchthyo community in the four zones in Segara Anakan, July-September 1983 ( E l 1984).
stomach content (% volume) of dominant fish species in Segara Anakan, 1983.
Fisheries production (t) from Cilacap, 1966-1 984.
Population of Karnpung Laut, 1975-1 983 (ECT 1984).
Population density (ind.lkm2) of Kampung Laut villages, 1983 (ECT 1984).
Number of transmigrants, 1979-1 983 (ECT 1984).
Population distribution by age, 1983 (ECT 1984).
vii
Results of physical, chemical and bacteriological examination of drinking water, October 1985 (adapted from TEM 1986).
Level of education in Kampung Laut, 1980 (Hardoyo 1982).
Level of education in Kampung Laut, 1983 (ECT 1984).
Main occupations in Segara Anakan, 1983 (ECT 1984).
Sources of additional income in Segara Anakan, 1983 (ECT 1984).
Land use pattern (ha) in 1972 (ECT 1984).
Distribution of traditional fishing gears and craft in the four zones in Segara Anakan, 1983 (ET 1984).
Annual fish production (t) in Segara Anakan, 1976-1982 (FSC 1983).
Annual production (kg) of and revenue obtained from the fisheries industry in Citanduy River, Segara Anakan, 1968-1 973 (FSC 1983).
Estimated annual yield (t) of fish and shrimp from the four zones in Segara Anakan (ET 1984).
Changes and shares of fish production (t) of Cilacap and Segara Anakan, 1978- 1983.
Conceptual framework and expected outputs for CRM plans for Segara Anakan- Cilacap area.
viii
List of Figures
Segara Anakan-Cilacap and vicinity.
Conceptual overview of upland Segara Anakan ecosystem and human interaction.
General geomorphology of Cilacap region based on LANDSAT MSS 4 , 5 and 6 (27 August 1978 image interpretation) (Hadisumarno et al. 1982).
Segara Anakan configuration, based on July 1980 survey showing bottom depth contours (m) and land accretion (adapted from ECI 1974a).
Citanduy and Segara Anakan catchment area, showing mean annual rainfall (mm) for period 1915-1984 (ECI 1987).
Tidal records at Cilacap, October-November 1986 (ECI 1987).
Tidal records at Sidareja (October 1980) and at Western Outlet (October 1986) (ECI 1987).
Tidal records at Karang Anyar, 17-1 8 December 1987.
Tidal current directions in Segara Anakan in December 1980 (Hamidjojo 1982).
Salinity distribution (ppt) in Segara Anakan in dry and rainy seasons (July and November 1983, respectively) (ET 1984).
Salinity distribution (ppt) in Segara Anakan and Citanduy River on 19 August 1987 (ECI 1987).
Shorelines and mangrove forest growth from 1903 to 1986 (ECI 1987).
Historical curves of water surface and new forest areas since 1903 IECl 19871.
Sketch of new mangrove growth as surveyed in July and ~ecembe; 1987
(€dl
1987).
~and'accretion since 1900 (Ludwig 1985).
Direction of future shoreline changes (CORD 1986).
Projected shape of Segara Anakan (ECI 1987).
Zonation system (I-IV) and sampling sites for mangrove and natural water resource studies in Segara Anakan (adapted from Rachmat and Setiawan 1984).
Mangroves in Segara Anakan-Donan watersheds (ECI 1987).
Diagrammatic profile showing the species zonation with respect to environmental gradient in the trees (R. apiculata, B. gymnorrhiza, 8. cylindrica) and undergrowth communities (D. heterophylla, S. banksii, B. gymnorrhiza) of South Majingklak area of aquatic Zone I (ET 1984).
Diagrammatic profile showing the species zonation with respect to environmental gradient in the trees (R. apiculata, A. alba, R. mucronata) and undergrowth communities ( A . ilicifolius, R. apiculata, A. alba) of Karang Anyar area of aquatic Zone I (ET 1984).
Diagrammatic profile showing the species zonation with respect to environmental gradient in the trees (R. apiculata, X. granatum, N. fruticans) and undergrowth communities (D. heterophylla, A. aureus, A. ilicifolius) of Cibeureum area of aquatic Zone II (ET 1984).
Diagrammatic profile showing the species zonation with respect to environmental gradient in the trees (R. apiculata, A. alba, R. mucronata) and undergrowth communities (D. heterophylla, A. ilicifolius, N. fruticans) of Muara Dua area of aquatic Zone Ill (ET 1984).
Simplified energy flow in Segara Anakan ecosystem (ET 1984).
Composition of ichthyo community structure in Segara Anakan, 1983 (ET 1984).
Schematic diagram of possible organic matter transfer in food web in Segara Anakan (ET 1984).
Villages in Segara Anakan and Cilacap area.
Monthly fish yield variation in Zone. Ill (Motean and Klaces), 1983 (FSC 1983).
Monthly fish yield variation in Zone II (Cibeureum), 1983 (FSC 1983).
Average demersal fish (gill net) and shrimp (trammel net) production (1 981 -1 983) from offshore waters. Data were obtained from landing station at Pangandaran (FSC 1983).
General organizational structure of the Indonesian government (CIDA 1987).
Realistic institutional framework for planning and implementation of CRM in Indonesia.
Process involving local government to develop CRM plans for Segara Anakan- Cilacap area.
Content of CRM plans for Segara Anakan-Cilacap area.
Zonation plan showing resources distribution and general land uses in Segara Anakan.
List of Acronyms and Abbreviations
AAETE AARD ASEAN BAKN
BAKOSURTANAL BAPPEDA
BAPPENAS BATAN BKKBN BPK BPPT BPS B U LOG ClDA CORD CRM CRMP DBH DGF DGWRD D PA DPR ECI ECT EIA ET FSC HNSl ICLARM IHE-ARD-MPW LAP AN
LIP1 LPSM MA MC MDS M EC MF
Agency for Agricultural Education, Training and Extension Agency for Agricultural Research and Development Association of Southeast Asian Nations
Civil Service Administration Board
National Coordinating Agency for Surveys and Mapping Provincial and District Planning Board
National Development Planning Board National Atomic and Energy Agency
National Family Planning Coordination Board Supreme Audit Body
Agency for Assessment and Application of Technology Central Bureau of Statistics
State Logistics Board
Canadian International Development Agency
Centre for Oceanological Research and Development Coastal resources management
Coastal Resources Management Project Diameter at breast height
Directorate General of Fisheries
Directorate General of Water Resources Development Supreme Advisory Council
People's Representative Council Engineering Consultants, Inc.
Economic Team
Environmental impact assessment Ecology Team
Fisheries Service Cilacap
Himpunan Nelayan Selurah Indonesia (All lndonesian Fishermen Association) International Center for Living Aquatic Resources Management
Institute of Hydraulic Engineering-Agency for Research and Development- Ministry of Public Works
National Institute of Aeronautics and Space lndonesian Institute of Sciences
People's Self Reliance Development Group Ministry of Agriculture
Ministry of Cooperatives
Ministry of Defense and Security Ministry of Education and Culture Ministry of Forestry
MHA MME MPR MPW rnsl MSRT M SY MT MTPT NAB NGO NKPA Perhutani PKK PPt RlCA RlMF SMPE US USAlD
Ministry of Home Affairs Ministry of Mining and Energy People's Consultative Assembly Ministry of Public Works
mean sea level
Ministry of State for Research and Technology Maximum sustainable yield
Ministry of Transportation
Ministry of Tourism, Posts and Telecommunications National Agrarian Board
Nongovernmental organization Nusa Karnbangan Prison Authority State Forest Corporation
Pendidikan Kesejahteraan Keluarga (Women's Vocational Training) partsperthousand
Research Institute for Coastal Aquaculture Research Institute for Marine Fisheries State Ministry of Population and Environment United States
United States Agency for International Development
xii
Preface
Indonesia has the second longest coastline (81,000 km) of all countries in the world.
Tremendous benefits could be derived from the coastal resources. But, as in many developing countries, these resources are being quickly depleted and degraded. The Segara (lagoon) Anakan-Cilacap area, on the south coast of Central Java, is rich in resources but is rapidly being altered by human activities. The key resource use problems and conflicts in the area include:
1. High levels of sedimentation in the lagoon resulting from poor upland agricultural practices, modern flood control measures and natural causes;
2. Loss of mangroves and tidal swamplands which support traditional fisheries;
3. Overfishing and use of destructive methods;
4. Agricultural runoff and potential pesticide and oil pollution in the lagoon;
5. Improper utilization of the mangrove forest;
6. Management of the large inputs of silt, resulting land accretion and decreasing size of the lagoon; and
7. Declining socioeconomic/livelihood status of the already poor inhabitants of Segara Anakan.
The Segara Anakan-Cilacap coastal region is the only major estuarine-mangrove zone in Java which supports intensive use by local people. The renewable resources and unique values of the area require sound management strategies which can be implemented practically.
Many development programs have been attempted and exist in the area. Human settlement plans, industrial sites, port construction, agroforestry activities and proposed
recreation-tourism plans are examples. But not all are compatible with sound resource use, and several have caused conflicts among users and environmental degradation.
Water quality in the area varies greatly in time and space due to the influence of tidal inflows mixing with river water. Most parameters indicate a suitable condition for fisheries.
However, high levels of sedimentation have an impact on bottom fauna, depreciating it and the fisheries as a whole while the lagoon decreases in size.
The Segara Anakan-Cilacap area is inhabited by two ethnic groups, the Javanese and the Sundanese. Social and economic solidarity among these peoples at the grass roots level is strong in a traditional sense but not through formal organization. Thus, it will be important to consider the implications of CRM on the peoples' traditional life-style and how they can participate in the process.
Poverty and inadequate drinking water lead to poor health. There is lack of education so that the implications of overuse of natural resources are not readily understood. A final and important consideration is the lack of institutional-governmental coordination in the area. Without such coordination in a potential management plan, success will be limited.
In light of these issues and the recognition of the value of the coastal resources, it is apparent that sustainable use management is necessary. The ASEAN-US CRMP (Indonesian component) is beginning to generate an integrated management plan for Segara Anakan- Cilacap area. This coastal profile is the first attempt to summarize appropriate existing
xiii
information on management of the area so that implementation can proceed. Since around 1970, intentions to stabilize the use of resources have led to baseline studies and accumulation of many data. However, data gaps still exist and much of the information gathered is not
relevant for management purposes.
Many of the data in this profile are derived from a study on the ecological aspects of Segara Anakan carried out by the Ecology Team, Faculty of Fisheries, Bogor Agricultural University. The study's main objective was to obtain basic ecological information from which future resources management alternatives could be derived. The study results were contained in the "Ecological aspects of Segara Anakan in relation to its future management" (1 984), which was made possible by the Institute of Hydraulic Engineering, Agency for Research and Development, Ministry of Public Works (IHE-ARD-MPW), Indonesia, and the research team.
The study consisted of a preparatory stage, a pre-survey and field surveys. The preparatory stage was conducted in Bogor and Bandung in July to October 1982. The pre- survey was in July 1982 in Segara Anakan and its surroundings, and the field work, in July to
November 1983. Two comprehensive studies were conducted in July and November 1983, each for three weeks. Between these periods, monthly monitoring was done. Emphasis on the
interaction of inter- and intraecological components has provided better understanding of the dynamics and importance of each component to the Segara Anakan ecosystem.
The Ecology Team consisted of: Ir. Suporno T.H. Wardoyo (leader), Dr. Ir. Kardiyo Praptokardiyo (vice leader), Dr. Ir. Joko Punvanto, Ir. Kadarwan Soewardi, Chairul Muluk, M.Sc., Drs. Sukristiono Sukardjo, Dr. Ir. Enan M. Adiwilaga, Ir. Bambang Irawan, Ir. Gelar Wira Atmadja, Ir. Hermanu Triwidodo, Ir. Warti Sumarsini, Ir. Asryanto, Ir. Djuwito Djunadi, Eddy Kurniarayadi, A.B. Djunaedi, Ruslan and Sodikin.
Another important reference is the Engineering Consultants, Inc. (ECI) report to the Lower Citanduy River Basin Project under the MPW. The report, which was based on primary data and the above study, made recommendations for the physical maintenance of Segara Anakan. The report is discussed in this profile.
The document was originally compiled by Mr. Tatang Sujastani, the Project Consultant engaged to review all the literature on the area. It has since been reviewed by several persons whose attention is much appreciated. These were: Dr. David McCauley (USAID-Jakarta); Mr.
Tatang Sujastani (Department of Fisheries, Ministry of Development, Brunei Darussalam); Dr.
Daniel Pauly (ICLARM); Mr. Jay Maclean (ICLARM); and Ir. Chairul Muluk (Bogor Agricultural University).
Alan T. White Technical Advisor
ASEAN-US Coastal Resources Management Project
Purwito Martosubroto Director
Directorate of Living Resources Management
Directorate General of Fisheries Indonesia
xiv
Foreword
The coastal waters of Southeast Asian countries have some of the world's richest ecosystems characterized by extensive coral reefs and mangrove forests. Blessed with warm tropical climate and high rainfall, these waters are further enriched with nutrients from land which enable them to support a wide diversity of marine life. Because economic benefits could be derived from them, the coastal zones in these countries teem with human settlements. Over 70% of the population in the region live in coastal areas which are characterized by high-level resource exploitation brought about by increasing population pressure and associated economic activities over the last two decades. Large-scale destruction of the region's valuable resources has caused serious degradation of the environment, thus affecting the economic condition and quality of life of the coastal inhabitants. This lamentable situation is mainly the result of
ineffective or poor management of the coastal resources.
It is essential to consider coastal resources as valuable assets that should be utilized on a sustainable basis. Unisectoral overuse of some resources has caused grave problems.
lndiscriminate logging and mining in upland areas might have brought large economic benefits to companies undertaking these activities and, to a certain extent, increased government revenues, but could prove detrimental to lowland activities such as fisheries, aquaculture and coastal-tourism-dependent industries. Similarly, unregulated fishing efforts and the use of destructive fishing methods, such as mechanized push-netting and dynamiting, have caused serious destruction of fish habitats and reduction of fish stocks. lndiscriminate cutting of
mangroves for aquaculture, fuel wood, timber and the like have brought temporary gains in fish production, fuel wood and timber supply but losses in nursery areas of commercially important fish and shrimp, coastal erosion and land accretion.
The coastal zones of most nations in the Association of Southeast Asian Nations (ASEAN) are subjected to increasing population and economic pressures manifested by a variety of coastal activities, notably, fishing, coastal aquaculture, waste disposal, salt-making, tin mining, oil drilling, tanker traffic, rural construction and industrialization. This situation is
aggravated by the expanding economic activities attempting to uplift the standard of living of coastal people, the majority of which live below the official poverty line.
Some ASEAN nations have formulated regulatory measures for their coastal resources management (CRM) such as the issuance of permits to fishing, logging, mangrove harvesting, etc. However, most of these measures have not proven effective due partly to enforcement failure and largely to lack of support for the communities concerned.
Experience in CRM in developed nations suggests the need for an integratsd,
interdisciplinary and multisectoral approach in developing management plans providing a course of action usable for daily management of the coastal areas.
The ASEAN-United States (US) Coastal Resources Management Project (CRMP) arose from the existing CRM problems. Its goal is to increase existing capabilities within ASEAN nations for developing and implementing CRM strategies. The project, which is funded by the US Agency for International Development (USAID) and executed by the International Center for
Living Aquatic Resources Management (ICLARM), attempts to attain its goals through these activities:
analyzing, documenting and disseminating information on trends in coastal resources development;
increasing awareness of the importance of CRM policies and identifying, and where possible, strengthening existing management capabilities;
providing technical solutions to coastal resources use conflicts; and
promoting institutional arrangements that bring multisectoral planning to coastal resources development.
In addition to implementing training and information dissemination programs, CRMP also attempts to develop site-specific CRM plans to formulate integrated strategies that could be implemented in the prevailing conditions in each nation.
lndonesia is an archipelagic nation with an extensive coastline. The coastal area is thickly populated and heavily utilized, thus, playing a significant role in ensuring stability of the rural economy. Like other developing nations, lndonesia faces problems on resource use conflicts primarily caused by poor planning and management. Poverty, especially in the rural areas, aggravates the problems.
Sustainable development is achieved through adequate resource use planning and effective management. Many countries which have paid a substantial price for not protecting their primary resources have begun undertaking appropriate coastal area planning and developing practical management strategies. lndonesia is one of these countries.
The project has chosen Segara Anakan as pilot site for one of the case studies being conducted in the ASEAN region. As shown by research, the lagoon performs significant
ecological and economic functions such as serving as a nursery area for finfish and shrimp. The coastal environmental profile of Segara Anakan-Cilacap, South Java, lndonesia is the resu It of an exhaustive primary and secondary research over a two-year period by the planning team.
Nevertheless, information gaps were also identified for further study by the research team. This profile will be valuable in the formulation of a management plan for the area.
Mr. Tatang Sujastani of lndonesia did a lot in compiling the initial project report on
Segara Anakan. Dr. Alan T. White and Ms. Marie Sol M. Sadorra, both of ICLARM, put in a lot of personal efforts in editing this profile. Dr. Purwito Martosubroto of the Directorate General of Fisheries, Indonesia, also provided valuable assistance which facilitated data collection and interpretation. Rachel
C.
Josue and Rachel Atanacio, both of ICLARM, typed the manuscript and drew the figures, respectively. All these efforts are greatly appreciated.Chua Thia-Eng Project Coordinator
ASEAN-US Coastal Resources Management Project.
xvi
Chapter 1 Introduction
TATANG SUJASTANI AND
ECOLOGY TEAM - BOGOR AGRICULTURAL UNIVERSITY
Segara Anakan and its surrounding environments in the Cilacap coastal area are a unique ecological feature in Java (Fig. 1 .I). The area, a continuation of the Citanduy Depression Zone of Java (Rahardjo 1982), has long been recognized as resource-rich. Numerous proposals have been made for resource development and management. Interest in the development of the area dates back prior to World War II when attempts were made to divert part of the
downstream portion of Citanduy River into Segara Anakan.
Blommenstein (Ludwig 1985) considered the possibility of converting Segara Anakan into a polder by diking Citanduy and diverting its discharge directly to the Indian Ocean. He intended to close off Segara Anakan from the sea by means of cutoff dikes at the outlets. It was further proposed that the resulting polder be drained by pumping and that entry of local rainfall runoffs flush the salt water so the area could be converted to productive agricultural land.
The Citanduy River Basin Development Project (DGWRD-DR 1976) envisioned the conversion of the lagoon from a brackishwater tidal estuary into a freshwater lake. This was to be accomplished by the construction of tidal levees and gates at the outlets to the sea; the diversion of the silt-laden Citanduy River directly to lndian Ocean; and the diversion of Donan River into the lagoon. The surrounding tidal-dependent mangrove, tidal swamp and marsh areas would be naturally desalinated by this procedure and reclaimed for agriculture (Ludwig 1985).
It was noted in 1975 that the major fisheries value of the lagoon was as a source of shrimp and finfish captured by offshore fishing vessels. The value of fish captured within the lagoon was considered small in comparison. The possibility of using the shallow freshwater lake resulting from the proposed development for aquaculture appeared to be limited. Subsequent reports on the Segara Anakan Reclamation Project indicated that the sedimentation filling rate had accelerated rapidly and that the usefulness of the lagoon as envisioned before was
seriously impaired (Ludwig 1985). (Table 1.1 shows the change in land and water areas from 1900 to 1984.)
These studies focused on the reclamation aspect and were oriented to augmenting available agricultural land. The ecological and fisheries studies were limited.
Since these proposals were made, the Ecology Team has shown that Segara Anakan performs a significant biogeographical role for many aquatic organisms and, in particular, for migratory populations. Ecologically, the interrelated mangrove complex and the Segara Anakan aquatic systems are believed to have a significant role to the adjoining marine coastal
ecosystem. On the other hand, this adjoining system and the water drainage systems flowing into the lagoon perform important functions. The resources which evolved from these dynamic interactions are exploited by the local inhabitants, and thus possess a socioeconomic role. The
5'-
N
A Indian
Oceon0
-
2 4 krn1 I I
108'50 108~55' 1 0 9 ~ 0 0 ~
Fig. 1.1. Segara Anakan-Cilacap and vicinity.
Table 1.1. Change in Segara Anakan land and water areas (ha) from 1900 to 1984 (Ludwig 1985).
Year Total lagoon
area including Island Net water Water area loss
islands area area Total Per year
conceptual linkages of the lagoon and drainage basin; the roles performed by Segara Anakan;
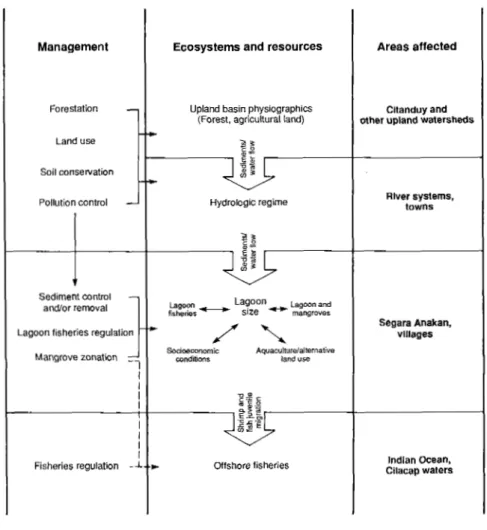
and management possibilities are shown in Fig. 1.2.
Management Ecosystems and resources
Upland basin physiographics (Forest, agricultural land)
Hydrologic regime
Lagoon
-
Lagoon and-
size rnangrovos Sodwconornic Aquaculturc/altornativeconditions land use
-
Offshore fisheriesAreas affected
Citanduy and other upland watersheds
Rlver systems, towns
Segara Anakan, vlllages
lndlan Ocean, Cilacap waters
Fig. 1.2. Conceptual overview of upland Segara Anakan ecosystem and human interaction
At present, the Segara Anakan system constitutes andlor is affected by six linked
components, each having a significant role (Fig. 1.2). The important components and processes in the area are:
1. Hydrological aspects;
2. Natural resource ecosystems (mangrove, offshore and lagoon system);
3. Physiographical aspects, which include: hydrological changes, land subsidence and submergence and erosion in the upper river basin and the adjacent coastal lands;
4. Terrestrial vegetation; and
5. Socioeconomic aspects which include human activities affecting the area and how people are affected by the changing resource base.
Siltation may adversely affect some fish species in the lagoon, but may benefit others, especially those with the ability to adjust to the resulting water system. This condition arises due to environmental changes, often drastic, which will further cause changes in the availability and/or accessibility of preferred habitat which may function as refuge, spawning, nursery, feeding or general living area; and natural food supply, both in quality and quantity.
Segara Anakan and its adjacent areas as estuarine lagoons are important as sources of fisheries commodities for food and commerce by the local people. Maintenance of productive fisheries may require limitation of fishing effort and protection of habitat. The fisheries resources and estuarine-mangrove habitat are modified by: (1) increases in sedimentation; (2) reduction of mangroves by human encroachment; (3) potential influence of pollution from pesticides in the agricultural runoff water; (4) water pollution from human settlements and industrial sites; and (5) overfishing of the lagoon fisheries.
Chapter 2
Geography and Physical Setting
ECOLOGY TEAM - BOGOR AGRICULTURAL UNIVERSITY, MULIA PURBA AND TATANG SUJASTANI
Segara
Anakan
The Segara Anakan-Cilacap area is located on the southeast coast of Central Java (Fig.
2.1). It is protected from lndian Ocean by Nusa (island) Kambangan, having two openings to the ocean, the western (at the southwest corner of the lagoon) and the eastern passages.
Freshwater inflow from the three major rivers of Citanduy, Cibeureum and Kawunganten and other minor rivers is discharged through these passages into the lndian Ocean. The lagoon is influenced by tidal actions of lndian Ocean through the passages. The eastern opening is long, shallow and narrow; while the western opening is more important for tidal action as it is shorter, deeper and wider than the eastern channel and carries a much greater proportion of the tidal water. A part of Citanduy water discharge flows indirectly into Segara Anakan through Nusa Were and Cibeureum River (Fig. 2.1).
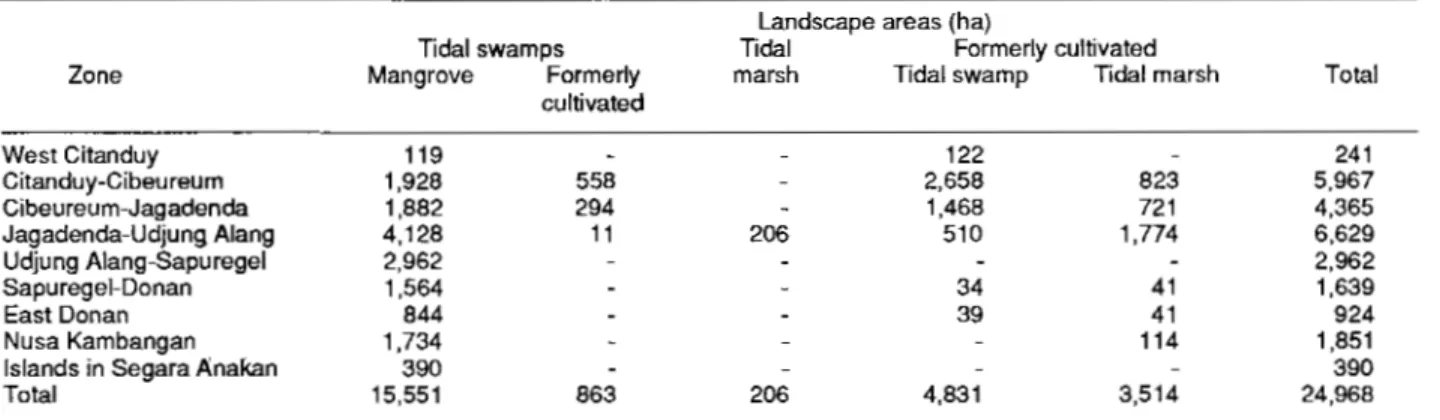
Segara Anakan consists of a central lagoon surrounded by mangrove swamps and intertidal land which have been converted into ricefields. The central lagoon is surrounded by about an equal area of sloughs and tributaries draining from mangrove swamps and intertidal converted land. These systems cover a total land area of about 8,345 ha (ECI 1974a). There are about 15,000 ha of mangrove tidal swamps, and the entire area is about 25,000 ha (Table 2.1).
The morphometric details of the lagoon are shown in Table 2.2. The surface area of Segara Anakan is about 3,225 ha. Maximum depth of the west opening channel is about 10-14 m. The average depth of the lagoon, however, is only 1.48 m. Water depth varies from 0.2-2.6 rn below mean sea level (msl). These data clearly illustrate that the larger part of the lagoon is an extensive shallow area, originally part of the tidal mudflat. The lagoon's volume, as estimated in 1976, was more than 50% water less than 0.5 m deep, whereas only 10% of the lagoon volume was found below 3 m. Thus, thermal stratification and oxygen depletion in the deep layer is unlikely, and wind-driven turbulence is pronounced, causing intense and frequent mixing.
The large, swampy lagoon west of Cilacap City is a southeast continuation of the broad alluvial plain of Citanduy. It is surrounded by the estuaries of Citanduy-Cibeureum and Donan Rivers, sheltered by Nusa Karnbangan from the waves and currents of lndian Ocean. The river silt loads dominate the deposition causing a narrowing and shallowing of the lagoon. The tide- affected lowland is swampy, crisscrossed by tidal channels underlined by alluvium and swamp sediments consisting of clay and silt mixed with organic materials (Rahardjo 1982).
The Segara Anakan area and volume have been gradually decreasing because of upland sediment intrusion which is causing sediment accretion. Several islands have developed
HIIIs surround~ng the lowlond urea Beach ridges ond olternaling svales.
0 Higher (inland ) parts of the ploin rums of whlch may be inundoled
Ea
Ssmyu deposits ( recent d e p o i a in the west, Wandotwd meanders/troces of ancient streams older deposits in the cost)1
- Silt-Iwdud seuwotor:Swampy and marJhy area ,,,... I. Heavily l w d o d
Ontomated avampland -.- 2. Sllqhtly looded
Arm o f inundatlonr
Fig. 2.1. General geomorphology of Cilacap region based on LANDSAT MSS 4, 5 and 6 (27 August 1978 image interpretation) (Hadisumarno et al. 1982).
Table 2.1. Tidal swamp and associated saline areas, Segara Anakan and environs (Ludwig 1984).
Zone
Landscape areas (ha)
Tidal swamps Tidal Formerly cultivated
Mangrove Formerly marsh Tidal swamp Tidal marsh Total cultivated
West Citanduy Citanduy-Cibeureum Cibeureum-Jagadenda Jagadenda-Udjung Alang Udjung Alang-Sapuregel Sapuregel-Donan East Donan Nusa Kambangan Islands in Segara Anakan Total
in the lagoon and are increasing in size. Other islands have joined the mainland. The accretion rate in the lagoon varies with the erosion rates in the Segara Anakan Basin and/or Citanduy River Basin.
The rate has also increased following river improvement works of straightening, channel enlargement and the construction of levees (ECI 1987). Fig. 2.2 shows the land accretion in 1976 and 1980. In 1986, the lagoon area was 2,700 ha (a decrease of 58% since 1903).
Table 2.2. Morphornetrical data of Segara Anakan (ET 1984).
Total surface area Maximum depth Mean depth Width Length
Water level fluctuation Water surface area at:
high water level low water level Volume below msl
3,225 ha 14 m
1.48 rn 3.9 krn 10.4 km 41-191 crn 829 ha 488 ha
29.1 million m3
Fig. 2.2. Segara Anakan configuration, based on July 1980 survey showing bottom depth contours (m) and land accretion (adapted from ECI 1974a).
If the present conditions prevail, it is estimated that the lagoon will become a mangrove forest with a network of tidal waterways draining into the western outlet by year 2000 (ECI
1987). In November 1986, the volume below rnsl of Segara Anakan was estimated to be significantly lower than the early 1900s. The western outlet has also undergone changes being 40
m
deep in I81 7 and now 10,'m deep at most places (ECI 1987). These changes are due tosediment deposition in the channel which reduces the tidal flow and reflects sediment accretion in the lagoon. The eastern outlet has not changed much.
Segara Anakan Catchment Area and Land
Use
The Segara Anakan catchment area forms the lower end of Citanduy Valley which extends from Sidareja Lowlands and the origin of Cijulang River in the west to the headwaters of Jeruk Legi River in the east, and from the headwaters of Cihaur River in the north to Nusa
am bang an
in the south. The topographic and physiographic characteristics of the catchment area are encompassed by the lagoon and its environs which cover about 32,500 ha of Sidareja east and 63,500 ha of the north area. The lagoon principally collects the runoff and inflowing water from CitanduyICiseel River Basin (ECI 1972; ECI 1973; ECI 1974a) (Fig. 2.3).Catchment area of Citonduy Rlver
upstream of Nusa- wuluh Floodway Segara Anakon catchment b u n m r y District center Town center Small town River Siphon
Mountain peak ( m )
Fig. 2.3. Citanduy and Segara Anakan catchment area, showing mean annual rainfall (mm) for period 191 5-1984 (ECI 1987)
The drainage pattern in the upper reaches of CitanduyICiseel River Basin features incised residual soils formed from weathered quarternary volcanic materials, tertiary basalts and andesites, while the volcanic ash and debris erupted from Galunggong Mountain are mixed with these soils. At higher and lower elevations, the soils are endosols and latosols, respectively
(ECI 1973; ECI 1974b; ECI 1979b).
Downstream from Tasikmalaya, Citanduy River flows through a narrow V-shaped valley with steep slopes, varying in depth from 75-100 m. This midstream section, which terminates at Banjar, has a total length of 65 km and drops from an altitude of 335 to 15 m above sea level at Banjar (ECI 1974a) (Fig. 2.3).
A short distance upstream from Banjar, Citanduy River is joined by Cimuntur River. The Cijulang and Cikawung Rivers join Citanduy at a point downstream at Banjar. From this point, Citanduy flows through Wanareja Swamp. Here, the gradient suddenly flattens, and the valley widens into flood plains. Upon emerging from Wanareja Swamp, the river meanders through a flood plain until it reaches the sea. The flood plain is composed of sedimentary deposits built up from sediments brought down from the upper reaches of the river (ECI 1974b).
The overall CitanduyISegara Catchment Area then consists of two main basins, the Citanduy River System with an area of 350,000 ha and the Segara Anakan Basin with 96,000 ha (ECI 1975) (Fig. 2.3). In Citanduy, about 290,000 ha are upland and the rest, lowland. In Segara Anakan, 32,500 ha are the lagoon environs and the rest, the east and north areas of Sidareja. The lagoon environs consist of 8,150 ha of water area and 24,350 ha of
mangrovesltidal marshesltidal swamps, 8,345 ha of which had been converted to paddy by 1972. The Citanduy Basin is regarded as separate from Segara Anakan Basin. However, because Citanduy River passes through the southwest corner of Segara Anakan on its way through the western outlet to the sea, the river tends to flow into the lagoon and deposit much sediment load there during flood tide. Only part of this load is flushed out during ebb tide.
Several smaller rivers in Segara Anakan Watershed discharge into the lagoon and deposit their silt there, but the main problem of acceleration of the lagoon's filling rate is from Citanduy Basin. About 30% of this basin is flat and presents no erosion problem; 5ooA (between 35 and 500 m high) has undulating/hilly topography with terraces and so has little erosion; and the rest (C 500 m high) has steep slopes with fine textured soil which easily erodes if not cov- ered with vegetation. In 1975, some 74,000 ha of Segara Anakan Watershed Area were said to be in the "critical erosion" category (ECI 1975). About 25% (about 11 7,543 ha) of the Citanduy Basin has gentle slopes (> I 0 0 m high); 45% (about 207,143 ha), between 100 to 500 m high;
18% (about 83,163 ha), between 500 to 1,000 m high; and the rest, more than 1,000 m high.
Of the 96,000 ha in the Segara Anakan Watershed, 83,500 ha are used: 58% for farming; 38%, forestry (mangroves); and 4%, other uses (ECI 1975). Napitupulu and Ramu (1 980) estimated the land use pattern for Segara Anakan Basin as follows: forestry and plantation, 27,000 ha (28%); upland, 11,000 ha (1 1.5%); homes and gardens, 1 1,000 ha (1 1.5%); lowland rice, 23,000 ha (24%); and mangrove and lagoon, 24,000 ha (25%). For Citanduy Basin, land use is primarily between agriculture (57%) and forestry and plantation (33%) (RMI 1986). The patterns are constantly changing so that by 1989 the present areas will have changed somewhat.
Climate
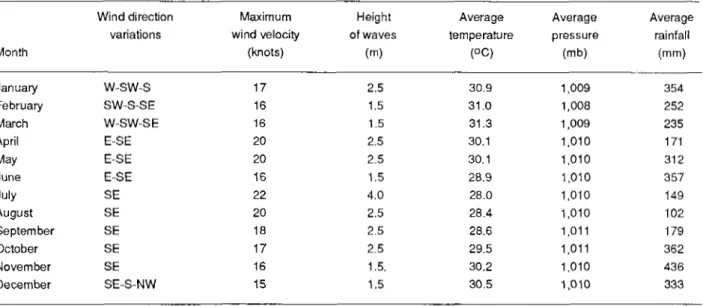
Two seasons affect the area, the rainy or wet, from November to April, and the dry, from July to September. The average monthly rainfall ranges from 100-180 mm during the latter, and from 180-400 mm during the former. The average annual rainfall is about 2,900 mm with a range of 87 mm in August to 378 mm in November. Table 2.3 shows the climatic data for Cilacap and Segara Anakan and Table 2.4, for the larger Cilacap region.
The equatorial climate has a high average monthly temperature of 26.pC. The deviation of the mean monthly temperature from the mean annual temperature is seldom greater than 1°C, and the difference between the maximum and minimum temperatures is about 7OC. The
Table 2.3. Climatological data for Cilacap and its adjacent area in maximum and average of 10 years (Uktolseya 1984).
Wind direction Maximum Height Average Average Average
variations wind velocity of waves temperature pressure rainfall
Month (knots) (m) ( O C ) (mb) (mm)
7-
January W-SW-S 17 2.5 30.9 1,009 354
February SW-S-SE 16 1.5 31 .O 1,008 252
March W-SW-S E 16 1.5 31.3 1,009 235
April E-SE 20 2.5 30.1 1,010 171
May E-SE 20 2.5 30.1 1,010 31 2
June E-SE 16 1.5 28.9 1,010 357
July SE 22 4.0 28.0 1,010 149
August SE 20 2.5 28.4 1,010 102
September SE 18 2.5 28.6 1,011 179
October SE 17 2.5 29.5 1,011 362
November SE 16 1.5. 30.2 1,010 436
December SE-S-NW 15 1.5 30.5 1,010 333
average monthly humidity ranges from 81 to 86% and the average of 100% sunshine hours is for a period of about 8 hours (800-1 600 hours) (Tables 2.3 and 2.4).
Lake evaporation is high with a mean of 149 m m for September and October. This correlates with wind velocities of 9.9 and 10.3 knots, respectively, for these two months.
Hydrology, Tides and Currents
The total drainage area of Segara Anakan is about 960 km*. About 150 km2 of this area is the watershed of Donan River. The total daily inflow into Segara Anakan from its own
watershed was about 20.5 million m3 (Ludwig 1985) (Table 2.5).
The water movement of the lagoon is influenced mainly by river runoff and tide from Indian Ocean. The tide is mixed and predominantly semidiurnal, with tidal range between 0.40 and 1.90 m. Typical daily tide fluctuation is shown in Figs. 2.4-2.6. The tidal phase of the lagoon at the western entrance lags that in Cilacap for about 1-2 hou'rs (Uktolseya 1984). On the west, water exchange between the sea and Segara Anakan is mainly through Citanduy River
Channel, a western entrance. On the east, it is through the eastern passage joined with Donan and Sapuregel Rivers.
During the rising tide, the tidal currents flow into Segara Anakan through both passages mixing at a point east of Motean. Water flows back with receding tides from this point following the same course when it entered (Uktolseya 1984).
The western tidal current, running west to east, lasts for about 5 hours after low water level is achieved, and with the receding tide, flows westward for the same period. Variations in the tidal current in the eastern or western passage become slower at the meeting point.
During flood tide, seawater is pushed to the lagoon through its two inlets. While tidal energy penetrates the lagoon from both inlets, the main source of seawater to the lagoon is from the western inlet. The volume of water passing the mouth of the western entrance during flood tide is about 26 million m3 for spring tide and 10 million m3 for neap tide. This mixture of fresh- and saltwater is distributed to Citanduy River, to the main lagoon and the rivers directly draining
Table 2.4. Climatological characteristics of the broad study area and Segara Anakan (ECI 1979a).
Month Temperature (OC)
Cilacap Humidity Sunshine
( % ) hours (%)
Evaporation (mm)
Rain (mm) January
February March April May June July August September October November December Total Average
-
Tasikmalaya
Temperature Humidity Sunshine Evaporation Rain I0C) I"/o 1 hours (%) (mm) (mm)
Table 2.5. Hydrology of rivers tributary to Segara Anakan (Ludwig 1985).
Basin and river Basin area Dry season ( h 2 )
Average flows (mslday) Estimated silt Rainy season Annual average transport into lagoon (Uyear) Citanduy Basin
Citanduy River Segara Anakan Basin Cibereum River CihaurlCikonde River Total
Segara Anakan Rainfall
(mm)
Water surface elevation
( rn a b o w Cilacap c h r t datum 1
o R ~ ~ ~ g s a ~ ~ ~ E ~ ~
Water surface elevation
( m above Cilacap chart datum 1
Fig. 2.6. Tidal records at Karang Anyar, 17-18 December 1987 (EGI 1987).
into it and to the mangrove forest. The water mass that passes the western entrance during a flood is a mixture of fresh- and seawater. During ebb tide, the Citanduy freshwater is discharged into Indian Ocean through the western entrance. Some of this water and its accompanying sediment remain near the mouth of the western entrance especially during weak coastal currents. This water after being mixed with saltwater is recirculated into the lagoon during the next flood tide.
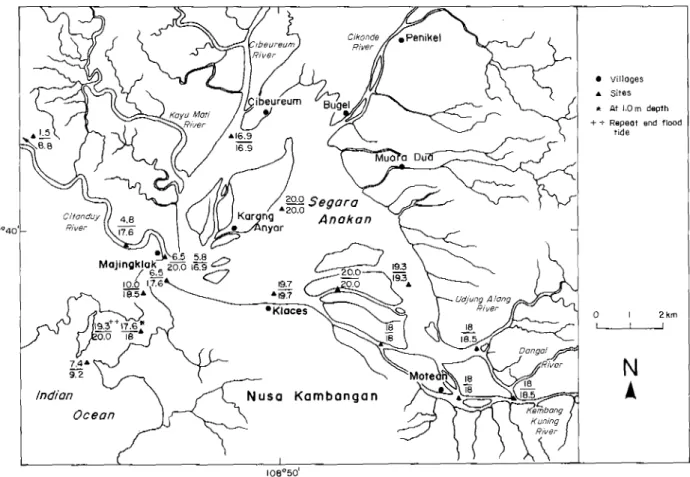
Tidal measurements were also conducted by Hamidjojo in October to December 1980 at various places. At Karang Tengah, the tidal range was 1.30 m, whereas further to the north at Bugel and Cibeureum, the ranges were less. The tide influence could still be observed up to 10 km inland at Penikel (Harnidjojo 1982, Fig 2.7). ECI (1 975) noted a maximum range of 2 m.
Recent tidal measurements from Cilacap being tabulated by ECI are shown in Figs. 2.4-2.6.
Fig. 2.7. Tidal current directions in Segara Anakan in Decornber 1980 (Hamidjojo 1982).
The water movement of the lagoon can be differentiated into the following subareas:
1. The central subarea covers a large area with high salinity due to incursion of
seawater. Water exchange through the west is dominant. The water passing through the river is vertically well mixed by rapid tidal current. Tidal currents are relatively fast with almost no immediate admixing with river runoff. These conditions result in the observed high salinities in the north of the subarea. During the dry season, the salinity range is about 20-28 ppt, and about
12-1 7 ppt during the wet season (Fig. 2.8).
Fig. 2.8. Salinity distribution (ppt) in Segara Anakan in dry (top) and rainy (below) seasons (July and November 1983, respectively) (ET 1984).
2. The western subarea is a typical brackishwater area with a relatively staDle salinity range of about 8-12 ppt, although under the influence of Cibeureum, Cikujang and Kayu Mati Rivers. At the mouth of Citanduy River, the inflowing freshwater contains a high load of silt, whrch is found south of Segara Anakan, creating a sharp halocline. The salinity in this subarea is low, between 1-8 ppt (Fig. 2.8).
3. The northern subarea is defined by its considerable water movements and varying salinity. It is mostly turbid and low in salinity. A general countercurrent is present where freshwater from Kawunganten River is easily distinguished from the lagoon water. During dry season, the salinity of the surface layer becomes higher due to increasing freshwater influx and stagnation of seawater. During rainy season, the salinity decreases to 7-1 2 ppt. These
conditions strongly reflect the influence of Kawunganten River inflow (Fig. 2.1 0).
On 19 August 1987, ECI (1987) measured salinities at 16 locations in the main body of the lagoon, western outlet and Citanduy Estuary (Fig. 2.9). At each location, samples were taken at several depths. During the measuring, tidal conditions were recorded at Cilacap and Majingklak. However, the discharge from Citanduy and other rivers and tributaries were not known. It was, however, expected to be extremely low due to the continuing drought.
Several conclusions are drawn from the results of the measurements. The lagoon main water body has no vertical stratification and is also horizontally homogeneous. The Citanduy Estuary shows clear stratification and is categorized as a partially mixed estuary. The effect of the Citanduy freshwater discharge is noticeable in the low salinities of the thin upper layer of the western entrance water.
Fig. 2.9. Salinity distribution (ppt) in Segara Anakan and Citanduy River on 19 August 1987( ECI 1987).
0 villages A Sites
* At 1.0 rn depth
+ -I- Repeat ond flood
r ~ d e
Note: The numbers refer to surface and bottom samples, unless otherwise indicated
Sedimentation Patterns
Tidal currents and wave action determine the orientation of shoals; once a shoal is developed, it becomes a shield that affects the pattern of water flow. The pattern of tidal currents is affected by the large shoals southwest of Citanduy, south of Cibeureum River and r;orth of Karang Anyar. To the north and east, the tidal current is weaker due to the smaller tidal range, shallower depths and the meeting of two water masses (river discharge and tidal current from the eastern entrance). In the deeper channels (3-10 m), the current is strong enough to maintain a channel such as Kembang Kuning River which leads east to Cilacap (Hamidjojo 1982).
Sediment supply to Segara Anakan comes from Citanduy River, its upper watersheds (mainly Cibeureum and Cikonde Rivers) and a very small amount of shoreline sediment.
Several studies were made to estimate the rate of sediment transport to the lagoon, but the results had considerable differences between them. It was difficult to obtain accurate figures because of too few samples of sediment taken from r i v p . Also, the method used to compute sediment transport is subject to large error (ECI 1987).
Based on these studies, the estimate of sediment transport in Citanduy and other rivers tributary to Segara Anakan is in the range of 5 to 10 million t per year. Much of the sediment comes from Citanduy River and is deposited in the lagoon. After the construction of Nusa Wuluh Floodway, which connects Citanduy and Cibeureum Rivers, sediment enters Segara Anakan through the floodway during periods of flooding. The second major source of sediment is from Segara Anakan Watershed and Cikonde and Cibeureum Rivers.
In the past few years, developments on tributaries to Cikonde River, which enters the lagoon near Bugel, have resulted in a large increase in sediment delivered to the northeastern portion of Segara Anakan. The developments, which include levees, channel enlargement and straightening, prevent the spillage of floodwater and increase the velocity of the water which carries much sediment to the lagoon.
ECI (1 974a) estimated the load of the sediment from Citanduy River to be 14.3 x 1 @ t (1 9 x 10⁶ m3) annually. Since the mouth of Citanduy River is located close to the western outlet, a large portion of the sediment is carried into Indian Ocean and a small portion into the lagoon. It is difficult to estimate the latter portion. Assuming that the present rate of deposition is 20% as estimated in studies by ECI, then the volume of Citanduy sediment filling the lagoon is about 2.63 x 10⁶ t (3.80 x 10⁶ m3) annually (ECI 1987).
Water circulation in the main body of the lagoon, except in the eastern part, is driven mainly by tidal energy from the western inlet and by freshwater discharge from Citanduy River and other rivers. In the eastern and southeastern parts of the lagoon, tidal energy that enters both the lagoon from the western outlet and Cilacap plays an equally important role in driving the water movement. During flood tide, the tidal energy pushes considerable water masses through the western entrance. The water masses are spread over the main body of the lagoon.
The fastest water movement occurs in the lagoon entrance (Table 2.6). After the water masses reach the lagoon entrance, water spreads in all possible directions into the lagoon. The velocity of the water masses decreases as they travel farther into the lagoon where their initial tidal energy is also spread. Water masses that travel to the eastern part of the lagoon meet with those pushed westward by tidal energy from Cilacap. At the nesting point of the water masses, the horizontal velocities go to zero, and the horizontal water movement is limited at the northern and northeastern parts of the lagoon, especially in the vicinity of the area where tidal currents h his is pointed out so that it is clear why the estimates vary. Nevertheless, the estimates for sediment load and deposits in the lagoon are critical for determining management measures for the lagoon and were made for that purpose while realizing the potential inaccuracies. (The editors)
Table 2.6. Peak flow rates and velocities in ocean and lagoon entrances under various tidal conditions (ECI 1987).
Ocean entrance Lagoon entrance Type of tide and Tidal Flow Velocity Flow Velocity
tidal range (m) direction rate (m/s) rate (m/s)
(m%) (m%)
Spring ( 1 .SO m)
Ebb 2,350 0.55 2,200 0.70
Flood 1,650 0.35 1,500 0.50
Neap (0.20 m)
Ebb 700 0.20 650 0.25
Flood 500 0.15 450 0.20
from the western outlet meet freshwater discharges from Cibeureum and Cikonde Rivers.
During ebb tide, water recedes to the ocean through both the eastern and western entrances.
The general sedimentation patterns within the lagoon are dictated by the water circulation patterns. If the energy, which is reflected in the horizontal movement of the water mass, is high, then the sediment will stay suspended and move with the water mass. If the' water movement slows, such that the energy is not strong enough to keep the sediment suspended, then it starts falling and deposition occurs. Moreover, the energy of the water movement will also act to sort the size of sediment that will be deposited along the path of the flows.
As a consequence of sediment deposition taking place in the lagoon, Segara Anakan's morphology has and is being changed. As soon as the bottom of the lagoon is shallow enough, there is normally an accretion of mangroves over the area. ECI (1 987) compiled the shoreline changes and the growth of mangrove forest since 1903 when there were only three islands, all in the southeast corner of the lagoon (Fig. 2.10). The large island, called Sebilas, was 61 ha in
N A
0
-
I Z l i m19%
c Villages ---C Rlverr
G r o w t h of f o r e s t
ha
1403- 1939 390 U39 - 1944 6M) 1944- 1971 1,170 197 1 - 1984 1020
Fig. 2.10. Shorelines and mangrove forest growth from 1903 to 1986 (ECI 1987).
the surface area. The seven villages (Karang Anyar, Klaces, Motean, Muara Dua, Bugel, Penikel and Cibeureum) were built over the water. The rnudflats, which were to become the large island at Karang Anyar, were just forming. The surface area of Segara Anakan at high tide was 6,450 ha, excluding the seven villages, which covered an area of about 33 ha by 1986.
By 1939, six new islands had appeared and Sebilas grew appreciably. About 390 ha of new mangrove forest were established. The northern and eastern shores advanced and the western and southern shores remained unchanged. From 1939 to 1944, large amounts of accretion to the southern and eastern shores added some 500 ha of mangrove forest. From
1944 to 1971, the forest had an increase of 1,170 ha in the lagoon and from 1971 to 1984, of 1,020 ha. Much of these increases were new islands between Klaces and the eastern shores.
From 1903 to 1986, the total sediment deposits onto which new mangroves were established were 3,540 ha. Another 21 0 ha were converted from lagoon to tidal waterway, leaving the 1986 lagoon with a water surface at high tide of 2,700 ha, which was only 42% of the surface area (Fig. 2.1 1).
From November 1986 to December 1987, the proliferation of mangrove seedlings and grasses accelerated (Fig. 2.1 2). Karang Anyar became attached to the northern shore of the lagoon. The Cikonde River extended its mouth in the lagoon by building natural levees. New mangrove seedlings sprouted on both sides of the mouth. This rapid change at the mouth of Cikonde River was due to increased sediment load in the river.
Historic land accretion in the lagoon was also recorded by Ludwig (1 985) and is shown in Fig. 2.13, which can be compared with Fig. 2.10. Based on the accretion and the water circulation pattern, the trends of physical shoreline changes of the lagoon were predicted (Fig.
2.14).
0- 0 Wotcr surface
~ n c l u d l n g lagoon converted ra waterwnys
-
New t o r * s t1'
1939
0 1 1
1900 1920 1940 1960 19BO 2000
Year
Fig. 2.1 1. Historical curves of water surface and new forest areas since 1903 (ECI 1987).
Fig. 2.12. Sketch of new mangrove growth as surveyed in July and December 1987 (ECI 1987).
Fig. 2.13. Land accretion since 1900 (Ludwig 1985).
Fig. 2.14. Direction of future shoreline changes (CORD 1986).
The pattern of sedimentation, which resulted in shoreline growth and encroachment of mangrove forest, will continue in the direction of its historic growth since the water circulation pattern and the way the sediment load was introduced and distributed into the lagoon are conducive for such processes to occur. If no action is taken to prevent sedimentation, then it is expected that the lagoon will be filled and only waterways where channels cross will be left. ECI (1 987) predicted this future morphology of the lagoon (Fig. 2.15).
Fig. 2.15. Projected shape of Segara Anakan (ECI 1987).
Several studies have been done to estimate the filling rate of the lagoon--by sediment as well as by the rate of mangrove forest encroachment. Napitupulu and Ramu (1 982) computed the filling rate to be 8.8 million mWyear (1 971 to 1976); 3.0 million mWyear (1 976 to 1980); and 6.2 million mslyear (1971 to 1980). They warned that if nothing is done to stop the filling, then Segara Anakan will be silted in the next five to seven years, leaving only the tidal channels in the lagoon.
ECI (1 987) also made a projection on the filling rate of the lagoon, i.e., between 2 and 3 million mslyear. The rate of mangrove increase has been about 2 krnzlyear for the last few years, indicating that without intervention, the mangrove forest will encroach over all the
remaining shallow areas of the lagoon by the turn of the century and leave only tidal channels to connect tributary rivers to the two inlets (Fig. 2.15). It is also projected that more or less 500 ha of waterways will remain in what is the 1987 lagoon. This will depend on the balance of