Particulate matter (also called aerosol) is an important component of the atmosphere and poses risks to both health and the environment. Ground-based measurements were conducted in a rural area on the western slope of the Sierra Nevada.
Abstract
Introduction
The role of HO2NO2 in the photochemistry of the lower troposphere has been less investigated, in part due to the lack of observations of this compound. An indirect estimate of HO2NO2 abundance was obtained from the sum of peroxynitrate observations during the 2000 TOPSE campaign (Murphy et al., 2004).
Method
Instrumentation
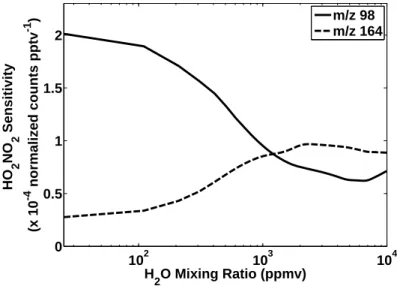
Due to differences in reactivity of CF3O− and its water cluster, the sensitivity of the CIMS instrument for the ion products of the three channels (R2.4, R2.5, R2.6) is dependent on the mixing ratio of water vapor in the flow tube (Crounse et al., 2006). During flight, isotopically labeled HNO3 was periodically added to the flow tube to monitor the stability of the instrument sensitivity.
Photochemical Time-Dependent Box Model
The amount of total reactive nitrogen is determined so that NO matches the observed value at the time of measurement. Daily profiles of photolysis rates are calculated using a four-stream implementation of the tropospheric ultraviolet and visible radiation (TUV) transfer code DISORT (Madronich and Flocke, 1998).
Photochemical Steady State
The measurements of the HO2 mixing ratio measured from C-130 were not sufficiently precise to provide a direct comparison between the measurements of HO2NO2 and the steady state calculation of [HO2NO2] based on observed HO2 and NO2; however, the mean observed concentration of HO2 was within 15% of the mean concentration of the NASA LaRC box model estimate for each of the flights used in this analysis.
Comparisons with NASA LaRC Photochemical Box Model
Ozone Production
In a polluted atmosphere, HO2 is produced mainly by the reaction of RO2 with NO, so the sum of all non-HO2 peroxy radicals will be closely and linearly related to the concentration of HO2 (eg Jacob, 1999).
Discussion and Conclusions
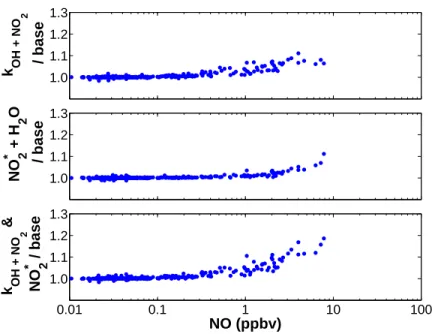
2.8 (top panel) illustrates the sensitivity of the modeled HO2NO2 mixing ratio to a change in the rate constant for R2.8. Including this process in the box model (using the rate of R2.9 determined by Li et al.) improves the agreement with observed HO2NO2.
Acknowledgements
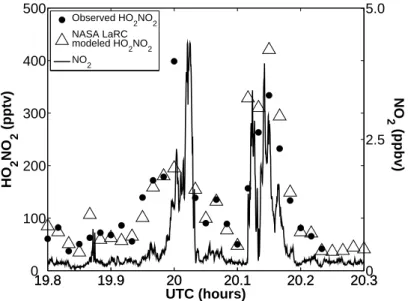
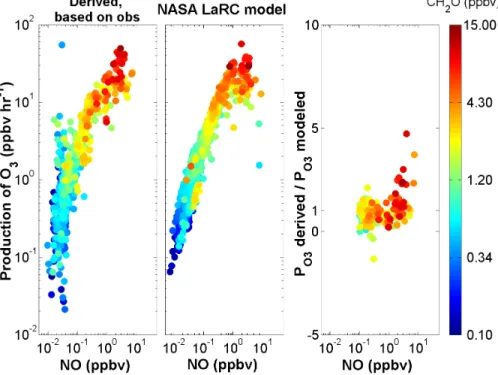
Madronich, S., and Flocke, S.: The Role of Solar Radiation in Atmospheric Chemistry, in Handbook of Environmental Chemistry, edited by Boule, P., Springer. Variations in the observed and modeled HO2NO2 mixing ratios closely follow variations in NO2. NASA LaRC box model predictions of PO3 versus modeled NO, colored by modeled CH2O are shown in the middle panel.
The ratio of measurement-based derived PO3 to NASA LaRC box model PO3 predictions for observed NO greater than 100 pptv, colored by observed CH2O, is shown in the right panel.
Introduction
Aircraft observations indicate an increase in sulfate concentrations in the Los Angeles Basin between 2002 and 2008, while ground-based measurements indicate a modest reduction. Sulfate is a significant component of particulate matter (PM) in Southern California, accounting for 9%–18% of the aerosol mass (Kim et al., 2000). The focus of this work is to compare historical and recent measurements of SO2 and sulfate in the South Coast Air Basin (SCB).
We present in situ measurements of SO2 and sulfate performed at SCB collected in May 2002 and June 2008.
Methodology
Aircraft Instrumentation
The sensitivity of the Caltech CIMS instrument to SO2 and the dependence of the sensitivity and ion products on the water vapor mixing ratio in the flow tube were determined in the laboratory. During the flight, isotopically labeled HNO3 as well as other calibration gases (formic acid, acetic acid, and H2O2) were periodically added to the flow tube to monitor the stability of the instrument's sensitivity. The SO2 concentration used in the subsequent analysis is the average of the concentrations determined from two independent measurements.
Using the same data analysis procedure described above and post-flight calibration of the CIMS instrument (pre-flight calibrations were not performed for SO2), SO2 concentrations determined using the Caltech CIMS instrument were 10% higher than those determined by the NOAA pulsed UV fluorescence instrument.
IMPROVE Sites
Background signals due to impurities in the ion source were measured (as described above) every 15 min and used to correct the data for instrumental backgrounds. After normalization by the amount of reagent ion signal and correction for background and interference signals, the ion-corrected atm/z 83 and m/z 101 signals were combined and the corresponding sensitivity factor (solid line in Fig. 3.2) was applied to give the concentration of SO2 in the environment. The uncertainty in the Caltech measurements reflects the sum of the data precision determined by the ion count statistics, the variability of the background signal, and the uncertainty in the sensitivities shown in Figs.
The NOAA Pulsed UV Fluorescence instrument and the Caltech CIMS instrument both flew on the NSF C-130 during the 2006 NASA INTEX-B/MILAGRO campaign.
EPA CMAQ Model
IMPROVE samplers consist of four independent modules, each with a separate inlet, filter pack and pump assembly (DeBell et al., 2006) and are described in detail in Malm et al. The collected material is ultrasonically extracted into an aqueous solution and analyzed by ion chromatography (DeBell et al., 2006). Additional SO2 emissions matching the spatial and temporal pattern of the NE traffic marker were added to provide the basin with a diffuse source of sulfur.
Observations
Results and Discussion
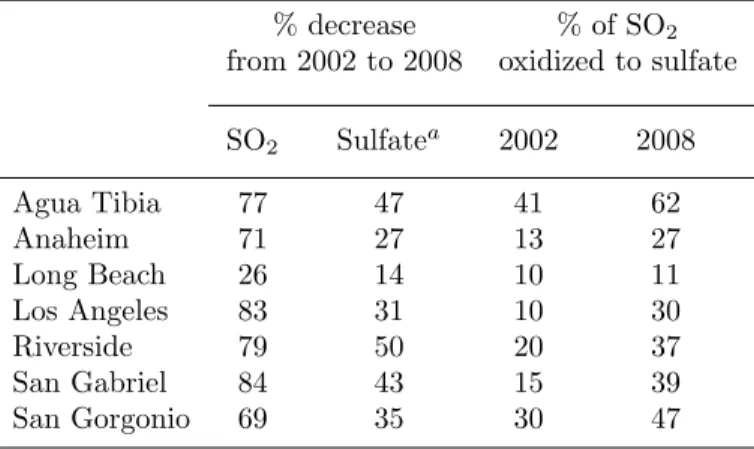
Measurements taken at three IMPROVE ground sites in the SCB indicate a modest decrease in sulfate concentration between 2002 and 2008. Aircraft measurements and CMAQ model simulations indicate an increase in oxidation efficiency in the SCB between 2002 and 2008. Although SO2 concentrations decreased significantly between 2002 and 2008, an increase in the efficiency of SO2 oxidation to sulfate may result in a minor decrease in sulfate concentration.
SO2, which would previously have been converted to sulfate upwind of the SCB, may now contribute to sulfate concentrations in the SCB.
Conclusions
Acknowledgements
The sensitivity curve for the sum of m/z 83 and m/z 101 is used to calculate the concentration of SO2. The concentration of SO2 used in this analysis is the average of the concentrations determined by the two independent measurements. The data shown are those in the inner region of the SCB (Fig. 3.1, yellow box).
Both methods are capable of measuring hydroxyacetone, an analyte with minimal known isobaric interferences.
Introduction
Chemical ionization mass spectrometry (CIMS) enables online, rapid, in situ detection and quantification of hydroxyacetone and glycolaldehyde. Measurement of hydroxyacetone and glycolaldehyde using these methods was demonstrated during the 2008 ARCTAS-CARB campaign and the 2009 BEARPEX campaign. Previous measurements of hydroxyacetone and glycolaldehyde concentrations have been performed using a range of analytical techniques.
Enhancement ratios for hydroxyacetone and glycolaldehyde in biomass burning plumes are presented and compared to literature values for laboratory fire data.
Instrumentation
Instrument Description
Hydroxyacetone and glycolaldehyde measurements were performed using the Caltech single quadrupole CIMS instrument and the Caltech tandem CIMS instrument. The Caltech single quadrupole CIMS instrument consists of a flow tube controlled at a total pressure of 35 hPa, where a reactant ion, CF3O−, interacts with ambient air diluted 1:4 with ultrapure N2. As with the Caltech single quadrupole CIMS instrument, the flow tube of the Caltech tandem CIMS instrument is maintained at a total pressure of 35 hPa.
Additional details on Caltech's single quadrupole and tandem CIMS instruments are provided in Crounse et al.
Calibration and Sensitivity
Daughter ions produced in the CID chamber of the Caltech tandem CIMS instrument are discussed below in Section 4.4.2. During the ARCTAS-CARB flights and the BEARPEX experiment, isotopically labeled acetic acid from the permeation tube was periodically added to the flow tube of the CIMS instruments to quantify the instrument sensitivity. The sensitivity of the single-quadrupole CIMS instrument to acetic acid during the ARCTAS-CARB campaign was comparable to that of postmission laboratory calibrations.
Consistent sensitivity of the CIMS tandem instrument was similarly confirmed during the BEARPEX campaign and post-shipment laboratory calibrations.
Determination of Analyte Concentration
Single Quadrupole CIMS Instrument
Post-mission laboratory calibrations for hydroxyacetone, glycolaldehyde, and acetic acid were performed for both the single quadrupole CIMS instrument and the tandem CIMS instrument. It must be taken into account when determining the glycolaldehyde concentration in the environment. The m/z 145 signal due to acetic acid is estimated by multiplying the m/z 79 acetic acid signal by the water-dependent ratio of the acetic acid m/z 145 signal to the acetic acid m/z 79 signal.
The average acetic acid contribution to the dem/z 145 signal varied from 40% to 60% of the total m/z 145 signal for the four flights.
Tandem CIMS Instrument
The advantages of tandem mass spectrometry are demonstrated in the separate quantification of isobaric compounds glycolaldehyde and acetic acid. Glycolaldehyde and acetic acid ions of the CF3O-group fragment differently due to differences in the stability of their groups and the resulting daughter fragments. Based on these fragmentation patterns, ambient signals due to glycolaldehyde and acetic acid can be distinguished.
The m145m85 signal is mainly due to glycolaldehyde, and the small contribution due to acetic acid is taken into account during the data analysis.
Observations
Final glycolaldehyde concentrations are calculated using the corrected glycolaldehyde m145m85 ion signal and the corresponding tandem CIMS instrument sensitivity curve. Final acetic acid concentrations are calculated using both the m79m59 and m145m79 ion signals and their respective sensitivity curves.
Results and Discussion
ARCTAS-CARB 2008
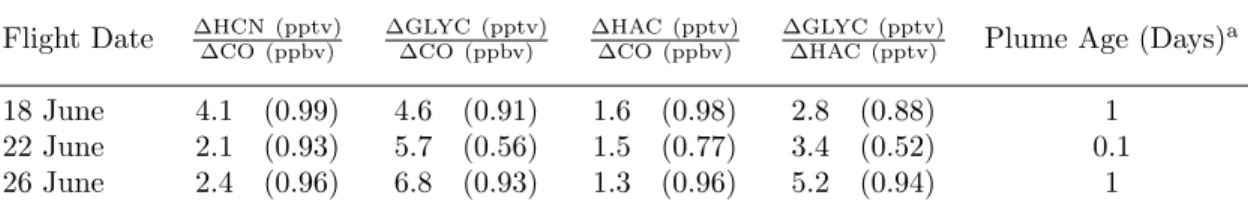
A list of biomass burning plumes encountered by DC-8 during the ARCTAS campaign can be found in Hornbrook et al. The elevation ratios of HCN in biomass burning plumes encountered in California during ARCTAS-CARB range from 2.1 to 4.1 HCN relative to CO (pptv / ppbv) (Table 4.1). The variability in the HCN improvement ratios can be explained by differences in combustion conditions and fuel type (Yokelson et al., 2007).
Using the emission ratio of CO, HCN, glycolaldehyde, and hydroxyacetone to CO2 determined by Christian et al. 2003), the corresponding CO emission ratios were estimated.
BEARPEX 2009
The yield of hydroxyacetone in the oxidation of methacrolein in the presence of NOx was updated to 0.43 from 0.2 (Galloway et al., 2011). The mechanism describing the oxidation of MBO in the presence of NOx from Chan et al. The model includes a lower yield of hydroperoxide from MVK oxidation followed by HO2 chemistry (0.3) as recommended by the Master Chemical Mechanism, MCM v3.2 (Jenkin et al., 1997; Saunders et al., 2003) and a high yield ( 0.6) of glycolaldehyde.
The initial ratio is determined by the rapid formation of glycolaldehyde and hydroxyacetone via radical rearrangement as proposed by theoretical work (Dibble, 2004a,b) and recent chamber experiments (Paulot et al., 2009a; Galloway et al., 2009). .
Conclusions
The ratio increases when glycolaldehyde from MVK oxidation and hydroxyacetone from MACR oxidation are the dominant formation pathways. The relationship between the production rate of glycolaldehyde and hydroxyacetone is shown in the figure. The observed ratio of glycolaldehyde to hydroxyacetone at the BEARPEX site is 1.4 (Figure 4.8), indicating that predictions based on isoprene and MBO chemistry alone are consistent with observations.
The observed relationship between measured glycolaldehyde concentration and measured hydroxyacetone concentration is consistent with predictions from a simplified box model where isoprene and MBO are the only VOCs represented.
Acknowledgements
The ratio of glycolaldehyde to hydroxyacetone in the plumes is included to enable comparison of the ratio of these compounds from biomass combustion emissions to biogenic emissions as measured during the BEARPEX 2009 campaign. Typical values for H2O mixing ratios in the instrument flow tube were approx. 1500 ppmv during the ARCTAS-CARB campaign. Typical values for H2O mixing ratios in the instrument flow tube were approx. 1500 ppmv during the BEARPEX campaign.
The close connection of the experimental and modeling communities enables the identification of errors and gaps in our understanding.
Peroxynitric acid sensitivity curves
Correlation between peroxynitric acid product ions
Calculated peroxynitric acid steady state concentrations compared to modeled concen-
Peroxynitric acid and NO 2 concentrations in Mexico City
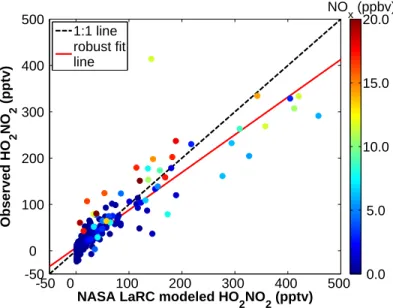
Comparison of observed and modeled peroxynitric acid concentrations
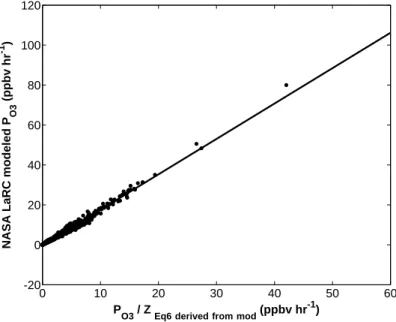
Rate of ozone production calculated assuming photochemical steady state of peroxyni-
Modeled and observation-derived ozone production rates
Concentration of peroxynitric acid predicted with variations of the base model
SO 2 sensitivity curves
Correlation between two independent measurements of SO 2 concentration
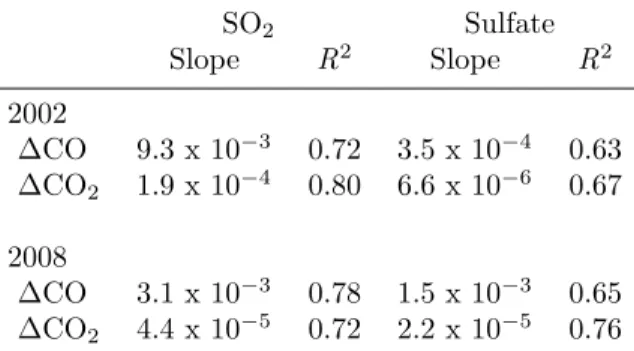
Observed correlation between SO 2 and CO 2
Observed correlation between particulate sulfate and CO 2
PM 2.5 sulfate concentrations at IMPROVE sites
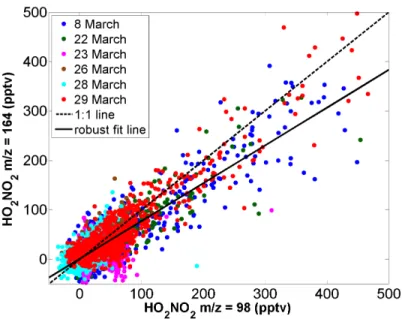
![Figure 2.3: [HO 2 NO 2 ] ss , calculated from Eq. 2.2, using modeled values of HO 2 and NO 2 versus HO 2 NO 2 predicted by the NASA LaRC box model](https://thumb-ap.123doks.com/thumbv2/123dok/10413402.0/43.918.288.683.397.707/figure-calculated-using-modeled-values-versus-predicted-nasa.webp)