8, a small "Josephson" tunnel current allowed direct measurement of the electron drift velocity at low current densities. An area of particular interest in the study of superconductivity is that of critical phenomena, i.e. of the approximation of the transition to the normal state. The present experiment was suggested by some simple theoretical calculations (3,4) based on the Ginzburg-Landau-Gor'kov theory.
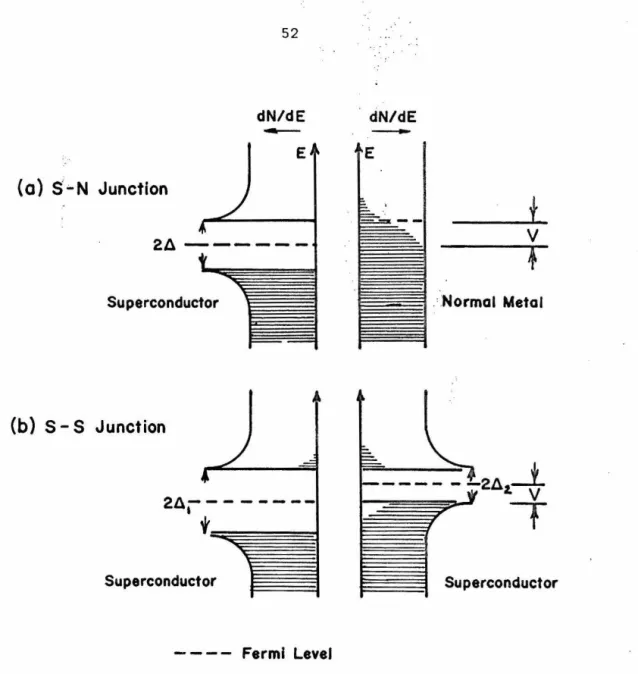
The researcher is then put in the position of having to infer from the data, which is essentially an integration of the data. Rev Appendix A contains a brief explanation of the relationship between tunnel measurements and the energy gap and density of states. However, this method had the major technical handicap that it was difficult to manufacture tunnel barriers.
Second, and significantly more serious changes, were deduced from the assumption that the density of states in the current-carrying state preserves the zero-current BCS function of the form p(E) = E/(E2-ti2) ~, with only the value.
Note that equation II.1 has the form of the London equations, but with a spatially dependent number of electrons. If we further recall that the common critical field Heb' is by definition related to the equilibrium value of the free energy difference per unit volume, we have Where a current flows through a superconductor, we assume that the same relationship applies, but we must add the kinetic energy of the electrons to the energy balance.
Microscopically, the interpretation of Equations II.10 and II.11 is that at higher velocities it becomes energetically favorable for some electrons to escape from the ground state, thus reducing the kinetic energy term, albeit slightly reducing the gap . We should further note that although the form of the equations is based on general physical arguments, it is possible that more precise microscopic treatments could change some of the numerical coefficients involved.
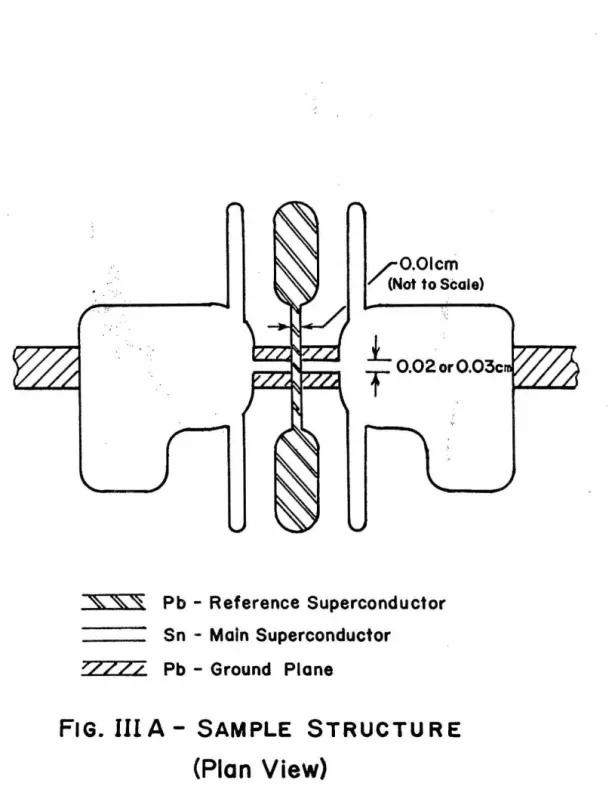
CHAPTER III - EXPERIMENTAL SAMPLES AND APPARATUS
APPARATUS
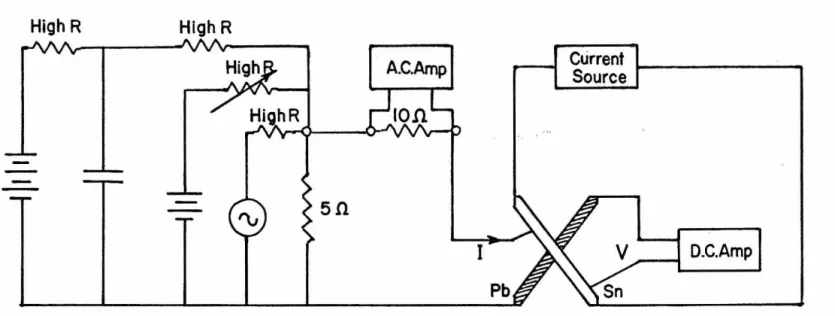
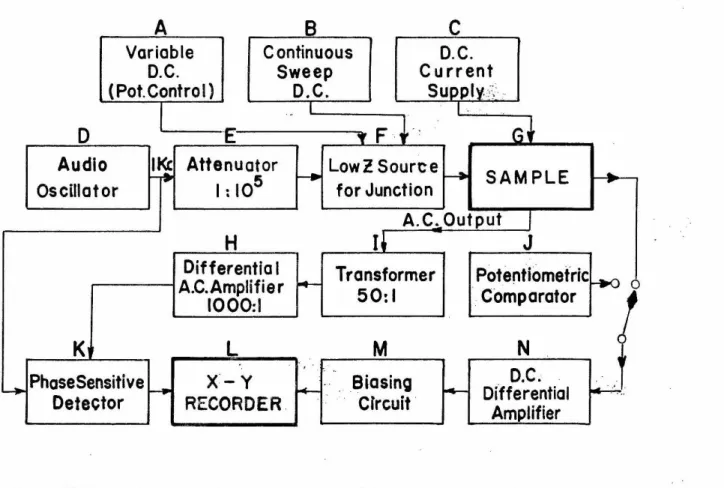
In addition, a Helmholtz coil arrangement around the system allowed the ambient magnetic field in the experimental region to be zeroed to a few milligauss. A block diagram of the electrical system is shown in figure III B, with a detailed list of the main components in Table Illa. Basically, the electrical system is seen to consist of five main blocks, three "sources" and two sensing systems.
Of the former, one, a current source, supplies the long tudinal current to the main superconductor; while operated in a. J - Potentiometric Comparator (0-3mV, 100 µV steps) K - Phase Sensitive Detector (Electronics, . Missiles and Communications, Model RJB) L - X-Y Recorder (Moseley, Model 2D2). An adjustable bias volt_age allows substantial zero suppression of the recorder scale, while a potentiometric divider with 100 µV steps can alternately be connected to DC.
Since both of the above resistances were low compared to the resistance of the tunnel layers in the films used (typically 200 - 300 ohms), the junction is effectively driven with a good approx.
The actual experimental procedure consisted of directly determining the change in the energy gap of the "main" superconductor, with and without longitudinal current, based on the position of the dI/dV vs. voltage intercepts. The results of the entire experiment depended on it. It was especially important that these intercepts were identified by a significant amount. Thus, it was essential to eliminate any instrumental bias in the location of the zero baseline, such as might result from a zero point shift in the phase-sensitive detector or the X-Y recorder.
V characteristic for positive and negative junction voltages and for both polarities of superimposed alternating current. In the region where the dI/dV curve changes quite rapidly, this particular sweep rate is found to be somewhat high for the time constant of the phase detector. In the actual experimental determination, each recorder scale was expanded by a factor of fifty from that of Fig. IV A, while the sweep rate was reduced by a few hundred because only the areas near the interceptors had to be recorded; then the zero crossings were found to match quite well.
It was therefore possible to determine the position of the zero crossings to within a fraction of a microvolt at most and always within one to two microvolts, the ultimate limitation being noise in the recorder input signals. Since an external bias circuit had to be used to achieve sufficient zero damping on the X-axis recorder, the calibration problem was solved by switching the DC input. In a series of measurements, we first located the intersection of zero current in the main superconductor, and then a certain pair of equal and opposite longitudinal values.
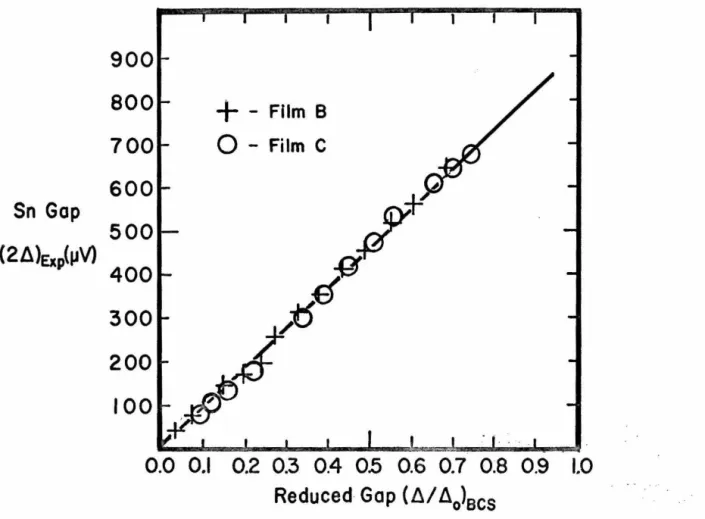
Measurements of the change in the energy gap with lo.ngi tudinal current, for a number of values of current, were carried out at a given temperature. As the temperature is lowered it tends to flatten out significantly.. due to the thermal depopulation of the states above the gap in the superconductor.). It was therefore possible to obtain a direct drift velocity measurement at the lowest temperature, (t = 0.8), at which a gap was measured Strictly speaking, this is only a direct measurement of the "kinetic momentum" mv, and in combination with the corresponding value of current density, of the effective penetration depth.
500 (2/J.)Exp(µV) 400
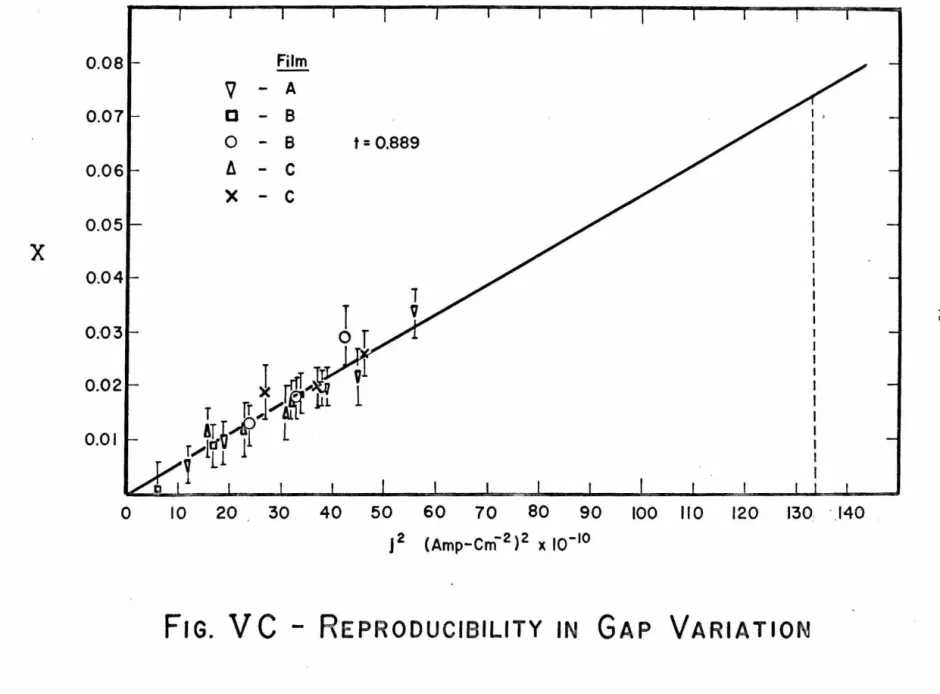
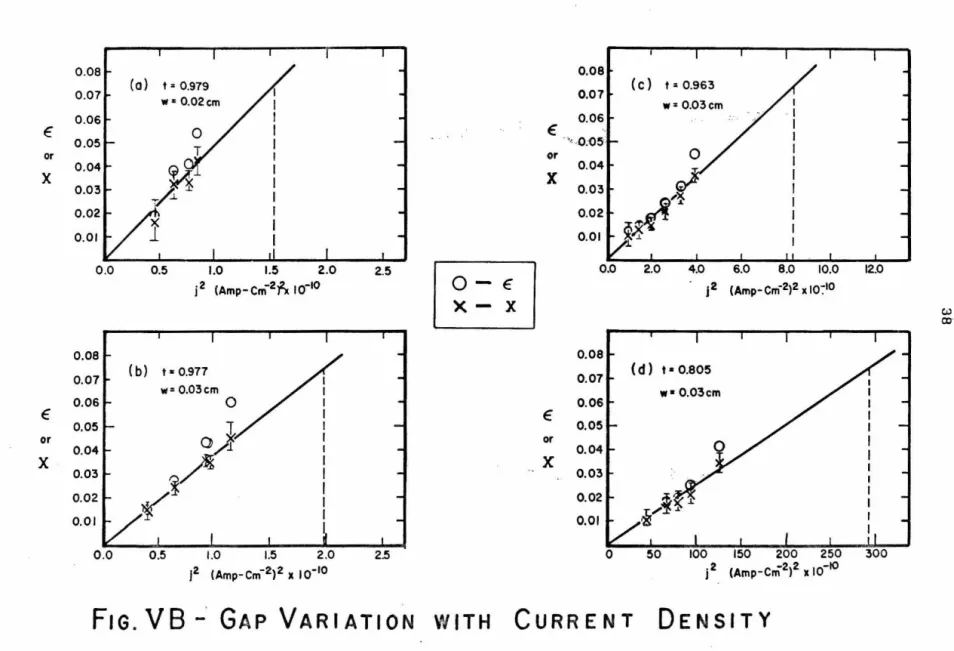
It would therefore be expected that if the predictions of the Ginzburg-Landau theory are valid for our data, E should be a linear function of j 2 . For clarity, .error bars have been omitted from the symbols that represent. the values of E, but they are of the same order as in the. Furthermore, if the value of the critical current is derived from extrapolation to X = 0.074, it is found to correspond to a value that is usually 20 - 30% higher than the "breakdown current" observed experimentally.
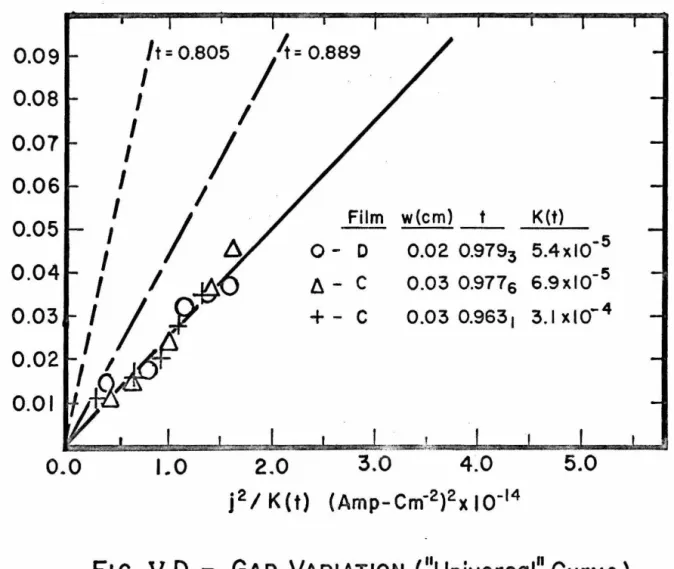
As a check on the reproducibility and stability of the measurements, X data from a number of films at the same reduced temperature are shown in Figure V C. As a further check on the predictions of the theory, Figure V D has been prepared to examine the temperature dependence of experimental results. Two dashed lines are drawn to show the mean position of the data from the lowest temperature measurements - t = 0.89 and 0.81.
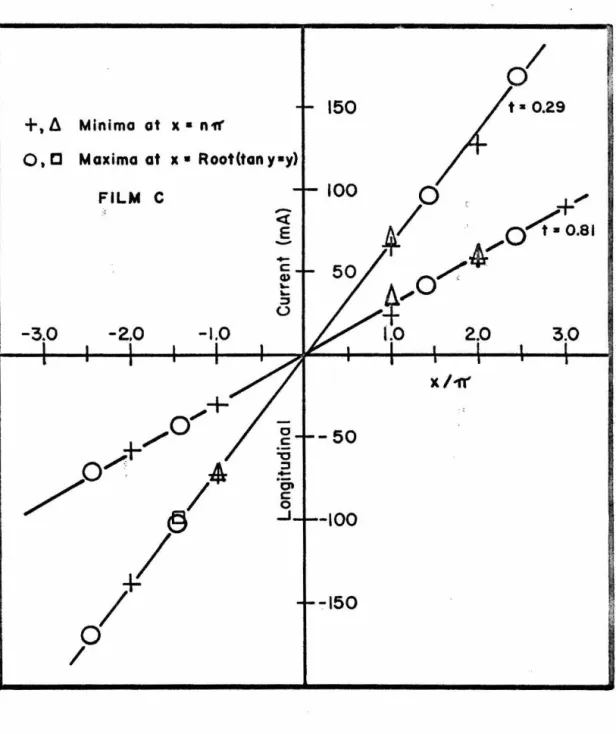
Unfortunately, it is impossible to accurately fit the temperature dependence of the critical currents into the temperature parameter K(t) for the lower temperature data. Since the small Josephson currents observed for the last two samples at t = 0.8 and t = 0.28 were found to have minima and maxima at longitudinal current values in the theoretically predicted ratios, the average current value for the first minimum is I . Rogers, Thesis, University of Illinois Although the actual calculation is too long to include in this work, it is hoped that it will be performed in the near future.
Microscopic theory suggests a correction factor £/~ for the effective number of co-electrons contributing to. the interpretation of the theory also expresses in direct in sense. total critical field and penetration depth A,. It should be emphasized that the use of experimental A in this equation introduces an implicit assumption into the theory:. that where the effective number of carriers has been reduced due to mean free path effects, the effective vm and thus the critical velocity increases above that for the bulk material. An additional assumption is introduced by using the critical field of bulk tin in the above equations.
Fermi level, proportional to the number of electrons per unit volume; the stability of the energy gap implies a stability of Hcb2/N(O) and not of Heb•. Various theoretical expressions for the temperature dependence of the critical current would multiply these values by factors of about 1.2 to 1.4 to give the zero temperature current.
Since the drift velocity is an important microscopic parameter in all theoretical considerations, it seems somewhat disturbing that hers. Finally, it seems feasible, albeit at the cost of considerable further analytical effort, to extend the dI/dV measurements to the entire region of the tunneling characteristic, not just its zero crossings, and thereby obtain some approximation of the actual density of states in a superconductor with current. Only when we have obtained and compared the full shape of the density of states with theoretical predictions (27) will we be justified in feeling that this aspect of superconductivity is fully understood.
Since we are dealing with Fermi particles, g(e:) is the product of the density of states p. The net current across the junction is then the difference between the currents in the two. 2 a constant because the difference term in the integral at low temperatures only contributes significantly over a small range of energies; this fact further allows us to extend the limits to infinity.
The tunnel current is the product of the two densities of state and the difference function [f(E-V) - f(E)] which, as we remember, is a symmetric function centered on V/2 and with area. This is a simple convolution which, due to the peak nature of [-f'(E)] around E = o, will have the general form p. 34;smeared" due to the finite thermal width of [-f'(E)] • Such a curve is illustrated in Figure AB(a) which reproduces an actual experimental trace taken while the tin was still above its transition temperature.
As we increase the voltage age from zero, at finite temperatures, the current increases slowly again, due to. Because of the ·infinities at the edges of the density of states, we will have a sharp discontinuity in the slope at the critical points.' Even if only one of the densities of states had an infinite peak, we would still have a discontinuity provided the other at least went to zero with a vertical slope in the gap. In the "conventional" anodizing method, an oxygen glow discharge is placed in dry oxygen, at a pressure of 50 to 100 µ, between a negative electrode and a mask that covers all but the area of the sample to be anodized.