The mode of failure of GCAF depends on the composition of the fibers and the thickness of the glass coating. Some composite fibers fail catastrophically, while others exhibit high toughness as the glass cladding fails before the metal core. From these measurements, the axial stress released on the metal core due to the removal of the glass cladding was calculated and found to be between 180 and 250 MPa, depending on the fiber.
Manufacture of GCAF
A process for creating glass-coated amorphous metal fibers (GCAF) was invented in the early 1970s by Wiesner and Schneider1 in a process called glass-coated melt spinning. This process itself is derived from an earlier Taylor2 process used to produce fine metal filaments. The main advantage of glass-coated melt spinning is the ability to produce metal cores with small diameters (10–30 µm).
Mechanical properties of GCAF
Composite structure
Provided that the composite is continuously reinforced in the longitudinal direction and all matrix and fiber deformations are elastic, the composite's upper limit for the modulus of elasticity is given by equation 1.7. The bond between the two components can influence the final properties. However, by the time the metal shows plastic deformation, the glass coating should have cracked and no longer contributes to the equation.
Internal stress
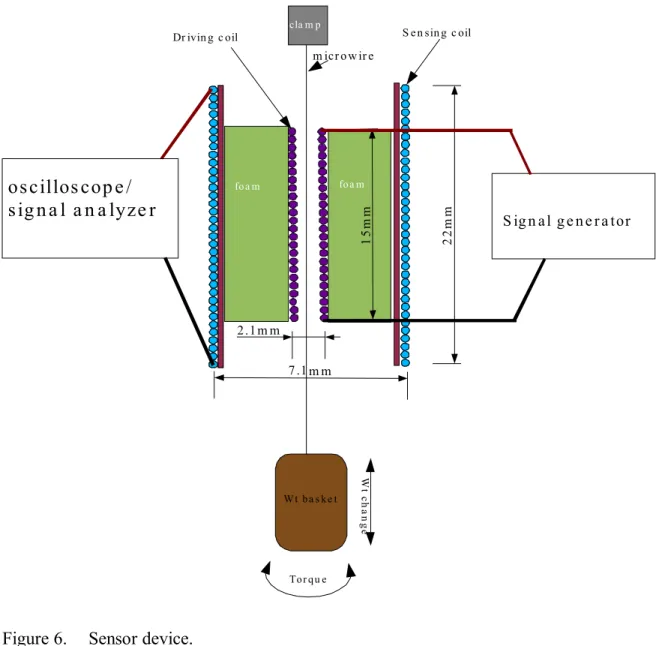
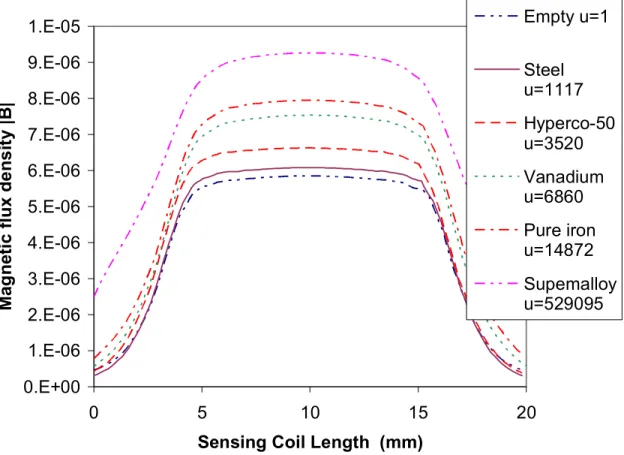
It has been shown that the magnetic permeability of amorphous fibers with a high cobalt concentration changes with changes in the glass coating19 and external forces.4 The permeability changes due to the reorganization of the domain structure in the metal by an external force. The output voltage of the sensor is directly related to the permeability of the material in the sensor. Change in magnetic field |B| along the sensor coil as the permeability of the core material changes.
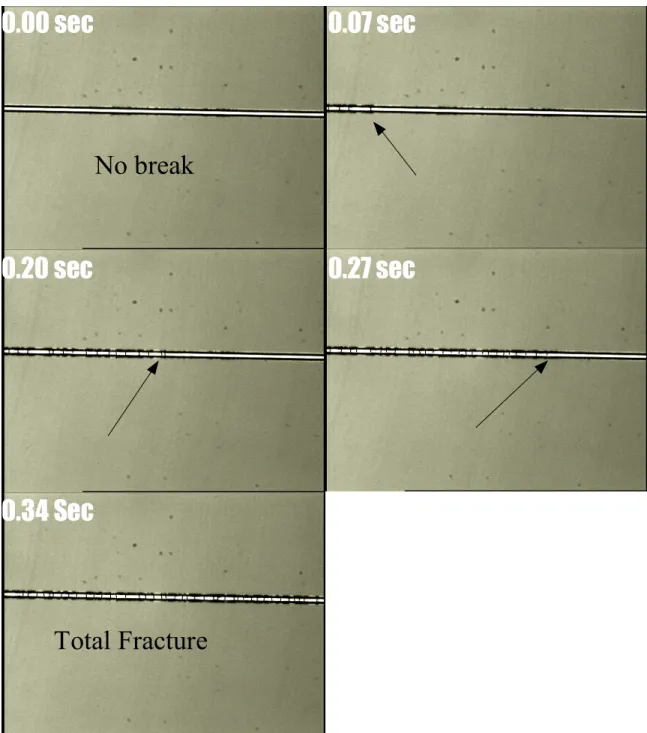
A clamp was then added to the bottom of the fiber and incremental weights were added. The manner in which the GCAF fails depends on the metal composition as well as the thickness of the glass coating. The GCAF is elongated and behaves exactly like behavior 1 until the glass cladding rapidly breaks away from a central point along the length of the fiber.
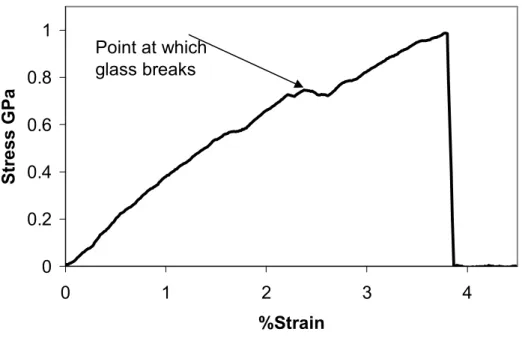
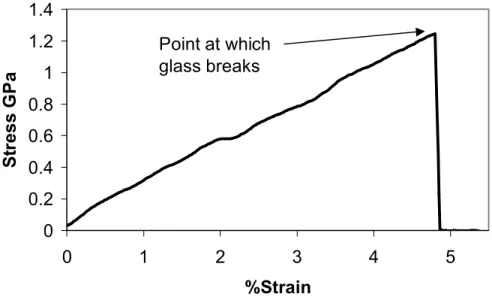
The measured load on the fiber is temporarily relieved by the sudden elongation of the core. The stress strain curve for the CoFeSiB compositions does not show glass cracking artifacts as seen in the CoFeNiSiB samples. The glass crack may not extend to the metal surface.
This is quite different from CoFeSiB, where glass breakage is very slow throughout the fiber. The video does not show the cracking of the glass coating until the failure of the entire composite fiber (catastrophic failure). Crystallization of the GCAF metal core can be achieved by heat treating the samples above 550 °C.
Magnetic properties of and sensing aplications of GCAF
Magnetostriction and MDL
LBE
GMI
Magnetic permeability
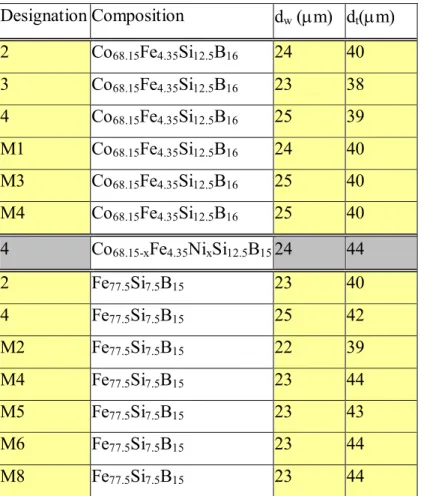
Samples
Sample preparation
The glass coating can be removed either by hydrogen fluoride (HF) acid etching or by HF devitrification was done by immersing the sample fiber in a 50 volume percent HF solution for 2 minutes.
Analysis
- Tensile testing
- Elastic modulus analysis
- Optical microscopy
- SEM
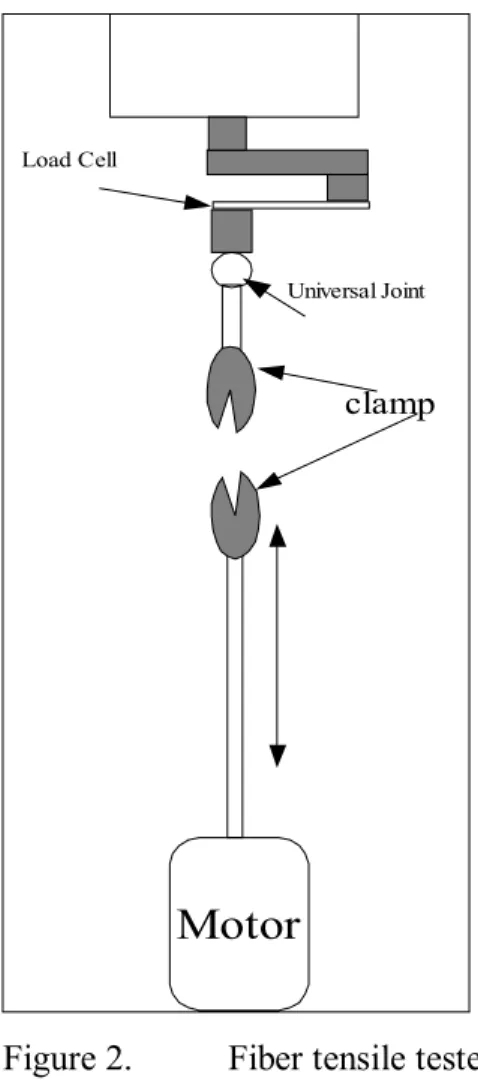
The modulus of elasticity of the fibers was tested using a technique described by Daniel.21 A schematic of the testing apparatus is shown in Figure 4. The deflection of the fiber was measured using a traveling microscope measuring to within a thousand millimeters. Using formulas 15 and 16, the tension and elongation of the fibers can be calculated based on weight and deflection.
Magnetic sensor
- Construction
- Testing
- Finite element analysis
- Tensile
- Elastic modulus
- Mode of failure
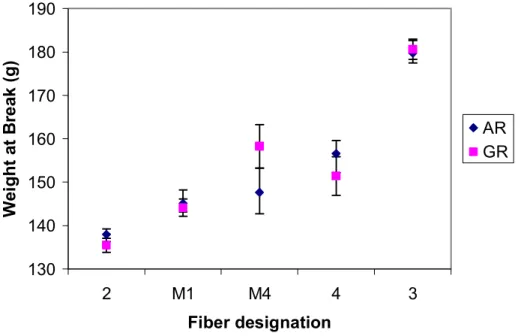
At the beginning of each experiment, the length of the fiber was recorded so that the torque could be calculated. The actual tensile properties cannot be easily calculated due to the way the GCAF behaves. When calculating the breaking strength, the diameter is assumed to be the outer diameter of the GCAF, i.e.
The fibers that exhibit this behavior are the cobalt-based fibers and some of the nickel-doped cobalt fibers. This makes comparing the breaking stress of the GCAF very difficult, because if the glass coating fails, the tensile properties depend only on the tensile strength and diameter of the core. This, together with the fact that the glass cladding breaks before the ultimate tensile strength, shows that the glass cladding has no positive or negative influence on the breaking strength of the core.
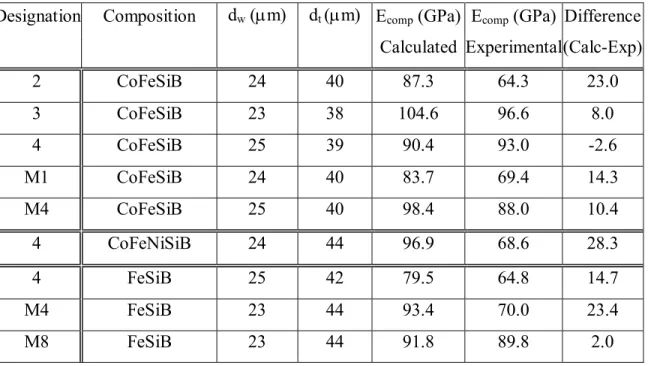
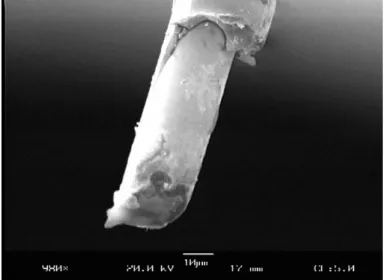
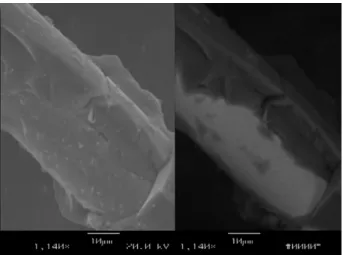
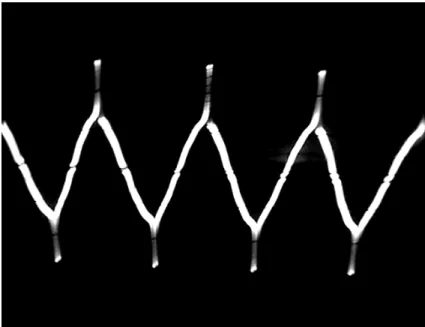
There is a slight correlation between the observed elastic modulus and the diameter of the core, where the samples with the smallest diameter (23um) had a higher modulus than their counterparts. The calculated modulus is higher than the experimental value for all the samples except CoFeSiB 4. The glass cladding almost always broke clean away from the metal core (figure 10) showing that the glass-metal bond was weaker than the intrinsic strength of the metal or glass.
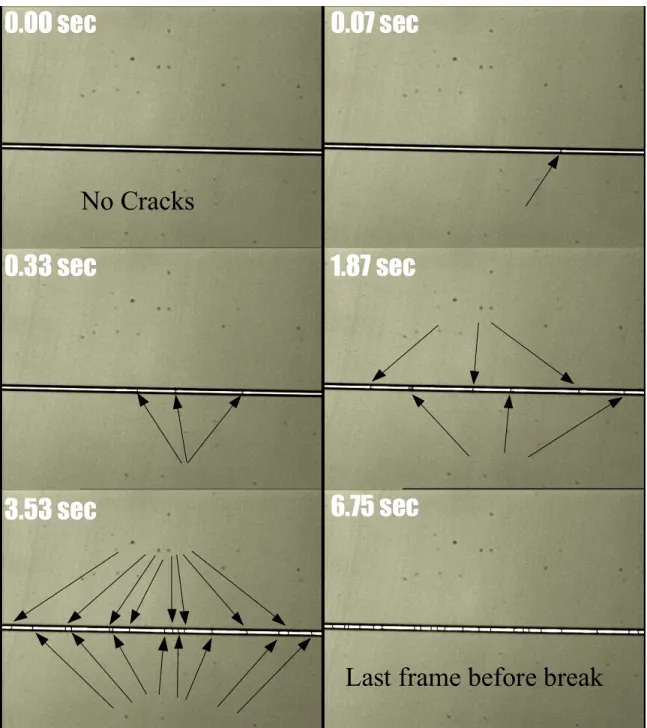
The progress of the cracks is quite slow and the time between the first crack and the final breaking of the fiber is 6.75 seconds. The bluntness of the cracks may explain why the metal core does not break at the tip of initial glass cracks and more cracks occur along the length of the fiber. Part of the CoFeNiSiB fracture mechanism can be seen in its stress strain plots where there is a discontinuity in the slope.
Heat treatments
Magnetic properties
Harmonics
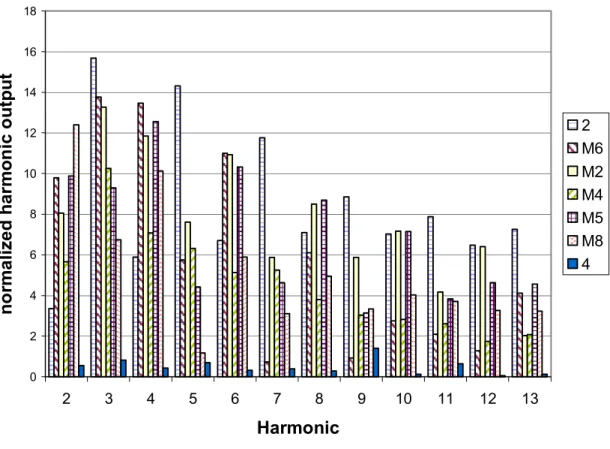
The normalized harmonic is a way to minimize day-to-day variations from external influences on the sensor output, as well as to make the graphs easier to interpret, because the first harmonic is 10 times stronger than the others . The normalized harmonic is calculated by dividing the harmonic of interest by the primary harmonic and multiplying by 100. As seen in the graph, not all fibers show the same harmonic pattern.
M8 still shows a high second harmonic, but the remaining even and odd harmonics are roughly equivalent. The designation M2 has a decrease in harmonic intensity when the glass coating is removed, while the designation M4 has an increase. The harmonic components of CoFeSiB GCAF are very regular compared to the irregularity of the FeSiB composition.
The CoFeNiSiB composition also has strong odd harmonics and is very similar to the CoFeSiB composition in most respects. It can be seen that the pattern of strong odd harmonics does not change upon removal of the glass and the relative strengths of the harmonics are preserved. The difference in the output of the harmonics between the A-R and G-R samples is a function of the voltage the glass coating applies to the metal core.
All the designations follow this trend of the G-R samples having higher outputs than the A-R samples.
Waveform shapes (occiliscope)
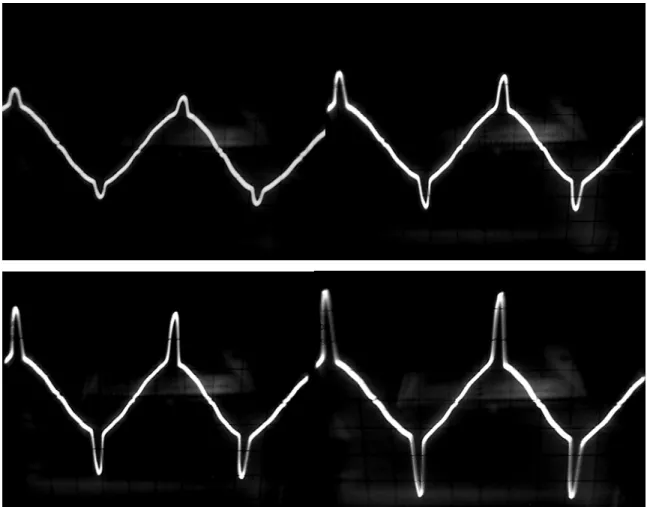
The waveforms of CoFeSiB and CoFeNiSiB are similar and show a peak or hump at peak voltage. When the core is more loaded, the peak amplitude decreases and becomes more rounded. This provides a qualitative measure of the stress exerted by the glass coating on the metal core.
It is seen that the CoFeSiB M3 peak is larger than CoFeSiB 2 and that both are larger than CoFeNiSiB. The stress that the glass places on the metal core using the formula given by Chiriac depending on the ratio of the area of the glass coating to the area of the core follows the same trend.
Multiple fibers and fiber size
The number of fibers ranges from 1 to 4 starting in the upper LH corner and ending in the lower RH corner. Figures 31 and 32 show the effect of multiple fibers on the harmonic oscillations produced. However, the even harmonics are initially very low in this system, so their change is trivial compared to the odd harmonics.
A comparison of the fibers shows that although the designations behave similarly, they can still be distinguished in the way the harmonic output is scaled with additive fibers. The percentage increase for each harmonic is the same; it is just a factor of the initial output voltage, i.e. change in output voltage for different harmonics as more CoFeSiB M1 fibers are added to the sample.
Comparison of two different CoFeSiB samples with respect to additional fibers (up to 4) in the sensor. The effect of fiber length on sensor output was first modeled by finite element analysis, and then the experimental results were compared. Until the length of the fiber reaches the length of the outer coil (felting), it has a linear relationship of length to output, while for longer fibers the average output is constant.
Figures 34 and 35 are the experimental results of using different lengths of CoFeSiB samples in the sensor.
Mechanical and magnetic coupling
Tension
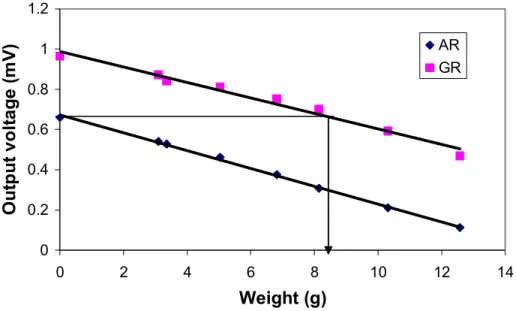
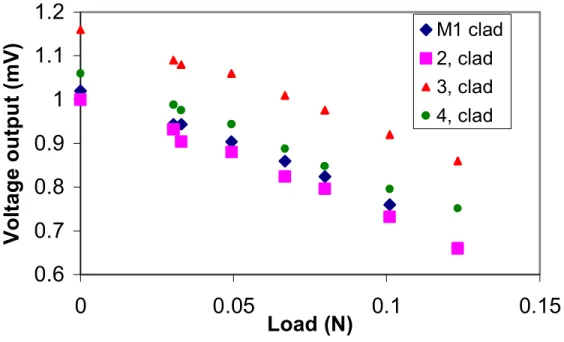
The largest difference in slope occurs at the lowest harmonic where CoFeSiB M1, 3 and 4 G-R fibers have larger slopes than their A-R counterparts. During testing it was found that the maximum weight that each harmonic could feel varied. The maximum weight that any harmonic can feel linear scales for all compositions.
With this linearity it is possible to predict how the primary harmonic should behave and what is the maximum weight that the primary harmonic can measure. Changes in the slope of CoFeSiB before (clad) and after (core) glass removal for different harmonics.
Torsion
Stress relief
The process is shown graphically in figure 40 where the arrow indicates the amount of force placed on the core by the glass cladding. Strengths on the order of 1-1.5 GPa were found for as-received GCAF and strengths on the order of 2 to 4 GPa were found for the devitrified fibers. The glass coating on the GCAF can fail in three ways, with the core, slowly as the core stretches, or break quickly at a specific stress.
GCAF with thicker glass overlays may have improved ultimate shatter resistance if the glass is in pristine condition. This added advantage comes from the fact that the glass is compressed and the glass has a greater proportion of the applied load than the inner metal core. The tensile strength of GCAF decreased by 10 to 40% after crystallization, depending on the composition and thickness of the glass coating.
Stress applied axially to GCAF or the metal core reduced the permeability and harmonic oscillations of the fibers. The axial stress relieved on the metal core by removing the glass cladding was calculated from sensor measurements and found to be between 180 and 250 MPa depending on the GCAF. More work needs to be done on the production of GCAF using different glass compositions and on finding the mechanical relationships between the glass and the metal.
Understanding the bonding between glass and metal that occurs during the fiber formation process may lead to fibers with better reinforcing properties or higher toughness.