sustainability
Article
The Dynamic Evolution of the Ecological Footprint and Ecological Capacity of Qinghai Province
Jing Guo1,2,3, Jun Ren4, Xiaotao Huang1, Guifang He5, Yan Shi6and Huakun Zhou1,*
1 Key Laboratory of Restoration Ecology for Cold Regions in Qinghai, Northwest Institute of Plateau Biology, Chinese Academy of Science, Xining 810008, China; [email protected] (J.G.);
[email protected] (X.H.)
2 Research Department of Ecological Environment, Qinghai Academy of Social Sciences, Xining 810000, China
3 University of Chinese Academy of Sciences, Beijing 100049, China
4 Graduate School of Qinghai University, Qinghai University, Xining 810016, China; [email protected]
5 College of Ecological and Environmental Engineering, Qinghai University, Xining 810016, China;
6 Planning Department, Xining Urban Planning Research Center, Xining 810001, China; [email protected]
* Correspondence: [email protected]
Received: 9 March 2020; Accepted: 8 April 2020; Published: 10 April 2020 Abstract:Based on the ecological footprint (EF) model, the dynamic changes in the per capita EF and per capita ecological carrying capacity (EC) in Qinghai Province from 2007 to 2017 were quantitatively analysed. The grey GM(1,1) prediction model was used to predict the per capita EF, per capita EC, and EF of ten thousand yuan of GDP. Additionally, the spatial change characteristics of the sustainable development status of the study area in four time periods were analysed using GIS technology. The results showed the following. (1) In the 11-year study period, Qinghai Province’s EF per capita grew gradually, increasing from 2.3027 hm2in 2007 to 2.9837 hm2in 2017. (2) The EC per capita in Qinghai Province remained a slight linear upward trend. (3) The environmental sustainability in Qinghai Province deteriorated over time. (4) According to the spatial characteristics, the overall sustainable development state changed markedly in the eastern region but was stable in the central and western regions. This paper proposes some countermeasures and suggestions to help Qinghai Province work towards sustainable development, such as controlling the population, adjusting the industrial structure, developing a low-carbon circular economy, and implementing ecological engineering.
Keywords: ecological footprint; ecological carrying capacity; sustainable development;
Qinghai Province
1. Introduction
In recent decades, with the rapid economic development and population expansion, the impacts of human activities on the earth’s ecosystem have been increasing; conflict among natural resources, the environment, and the economy has been increasing; and the risk of ecosystem degradation has been growing [1,2]. Sustainable development has gradually become a development goal of society [3]. How to balance the relationships among natural resources, society, and economic development and promote both sustainable development and the economy have become hot topics in ecological economics research [4]. Ecological sustainability refers to the sustainable development of society, and sustainability assessment has always been an important component of sustainable development [5]. Sustainable ecological conditions at the regional level have important practical significance for coordinating the relationships among economic development, social development and resource protection. Therefore, it
Sustainability2020,12, 3065; doi:10.3390/su12073065 www.mdpi.com/journal/sustainability
is especially important to study the ecological environment at the regional level and monitor its carrying capacity with respect to human demand and consumption. Employed as a sustainable planning tool, the concept of the ecological footprint (EF) refers to the area of biologically productive land required to support a given population (country, city, or individual) [6]. The concept and analysis method of EF was first proposed and developed by the ecological economists Rees [7] and Wackernagel [8] in 1992 and introduced into China in 1999 [9]. The EF model can be employed to assess human consumption at various spatial scales within the range of the biosphere’s regenerative capacity, thereby enabling quantitative assessment of ecological sustainability [10,11]. Because of its intuitive and clear calculation and regional comparability, EF has been widely used as an indicator of sustainable development [12].
The study of regional EF can be used to improve people’s awareness, offset human pressure on the environment [13] and promote ecological civilization [14,15].
To date, EF research has focused mainly on the concept, theory, and evaluation of EF. For example, Ayres [16] commented on the utility of the EF concept. Bastianoni et al. [17] studied the consistency of the relationships between different types of indicators and subjects within the EF framework. Zhang Xuehua et al. [18] proposed an urban ecological evaluation method based on the emergy-EF integration model and analysed the development of Tianjin from multiple perspectives, such as biological products.
Liu Weijie [19] combined GIS with EF to analyse the spatial distribution of ecological carrying capacity (EC), ecological deficit, and the ecological stress index in Northeast Asia. Li Wenlong et al. [20]
used an improved emergy-EF model to quantitatively study the sustainability of Tibet from 2005 to 2014. The scope of EF research involves the EF of specific countries or regions, some industries or resources, etc. For example, Wackernagel and others calculated the EFs of 52 countries and regions around the world [21]. Cuadra and others used EF and emergy analysis methods to evaluate the economic feasibility, EC, and sustainability of tropical crop production in Nicaragua [22]. Based on EF assessment, Holden et al. concluded that there is great potential to reduce the EF within 10 years by using alternative fuels [23]. Yao Jie [24] applied the concept of EF and a metric of forestry EF to analyse time series changes and the characteristics of forestry EF in Shaanxi Province. Wu Yi [25]
analysed the energy value evaluation of sustainable development of ecotourism and established a comprehensive scientific indicator of sustainable development by building an improved tourism EF model. Jia Chenzhong et al. [26] used a water EF model to explore the temporal and spatial characteristics of the sustainable use of water resources in Shanxi Province and analysed the factors driving changes in the EF of water resources.
At the provincial level, sustainability characteristics vary among municipalities, provinces, and autonomous regions [27]. For example, Sichuan Province [28], Tibet Autonomous Region [29], Ningxia Autonomous Region [30] and other provinces are in a sustainable development state. However, the EFs of Beijing [31], Guangzhou [32], Tianjin [33], Chongqing [34], Hubei [35], Shaanxi [36], Gansu [37], Heilongjiang [38], Xinjiang Autonomous Region [39], and other places have gradually increased, and these regions are in a state of ecological deficit. Although the development status of Beijing is unsustainable, the unsustainability is weakening [31]. Not all economically developed areas are necessarily highly sustainable, nor are underdeveloped areas necessarily unsustainable, because sustainability is affected by many factors, such as scientific and technological advances, policy implementation, and environmental conditions.
Qinghai Province is an important part of the Qinghai Tibet Plateau and has a unique geographical location. Due to its location and important ecological functions, the province plays an irreplaceable role in promoting the sustainable development of China’s economy and society [40]. Because of the wide coverage of Qinghai Province and the large variation in economic and environmental factors among areas, an evaluation of the overall sustainability of Qinghai Province is necessary. In recent years, the province has experienced continuous economic and societal changes. Time-series analysis of EF changes can not only reveal the evolution of regional sustainable development [41] and help predict future development [42] but also reveal the responses of the environment to social and economic changes. Based on this, this article focuses on Qinghai Province and uses the EF analysis method
Sustainability2020,12, 3065 3 of 26
to analyse the EF and EC of Qinghai Province from 2007 to 2017. The goals of this study are to evaluate the state of sustainability and existing problems in the process of coordinated development in Qinghai Province and to reveal the sustainability of ecological, economic, and social development in Qinghai Province. Additionally, this study provides a reference for promoting regional environmental protection and sustainable development.
2. Methodological Approach
2.1. Study Area
Qinghai Province (31◦39’-39◦19’ N, 89◦35’-103◦04’ E) is located in the northeast of the Qinghai-Tibet Plateau, the “roof of the world”. It is adjacent to Gansu to the north and east, Xinjiang to the northwest, Tibet to the south and southwest, and Sichuan to the southeast. This area features the headwaters of the Yangtze River, the Yellow River, and the Lancang River and is therefore known as “China’s water tower”. The land area is 72.12×10⁴km2and accounts for 7.5% of the total national area [4,43].
Regarding its administrative divisions, it governs two prefecture-level cities, Xining and Haidong, and six national autonomous prefectures: Yushu, Guoluo, Huangnan, Hainan, Haixi, and Haibei. Qinghai, as one of the important areas in western China in terms of the Belt and Road Initiative, features the Sanjiangyuan National Ecological Protection Comprehensive Experimental Zone, a valuable repository of genetic resources for plateau biodiversity. The importance of Qinghai’s ecological strategic position is becoming increasingly recognized [43,44]. Ecosystem functioning in the province is strong as a result of sustainable social and economic development and provides an ecological barrier to degradation elsewhere in Asia. In 2017, the GDP of Qinghai Province was 264.28 billion yuan, representing an increase of 7.3% over the value in 2016 [45]. This increase was mainly due to a strong increase in the proportion of tertiary industries, especially the service industry, in 2017. The contribution rates of the three major industries to GDP in the province are 9.08%, 44.29%, and 46.63%, respectively [45].
Economic growth in Qinghai Province is rapid, and the industrial structure is gradually changing from
“two, three, one” to “three, two, one” [46]. In 2017, the permanent population of Qinghai Province was 5.983 million, of which the urban population was 3.175 million, accounting for 53.07% of the total population [45]. Qinghai is a multi-ethnic settlement, and it is known for its unique culture [47]. In 2017, the population of ethnic minorities in the province was 2.854 million, accounting for 47.71% of the total population [45]. The province is inhabited mainly by Tibetan, Hui, Tu, Salar, Mongolian, and other ethnic minorities. Among them, the Tibetan and Hui nationalities account for the largest proportions and represent 47.71% and 25.23%, respectively, of the province’s permanent population, while the Tu, Salar, and Mongolian nationalities account for small proportions, representing 14.78%, 3.55%, and 1.93%, respectively, of the permanent population. It has formed the distribution pattern of
“large mixed residence, small concentrated residence” [43].
Qinghai Province, with an average altitude of more than 3500 m, features a typical plateau continental climate, with strong solar radiation, a dry and cold climate, abundant wind and scarce rain, and average annual sunshine hours of more than 2700 h, all of which are more extreme than the national average values. The transition of vegetation types from east to west is pronounced, with vegetation spanning forest and grassland, grassland, alpine meadow, alpine grassland and desert [48].
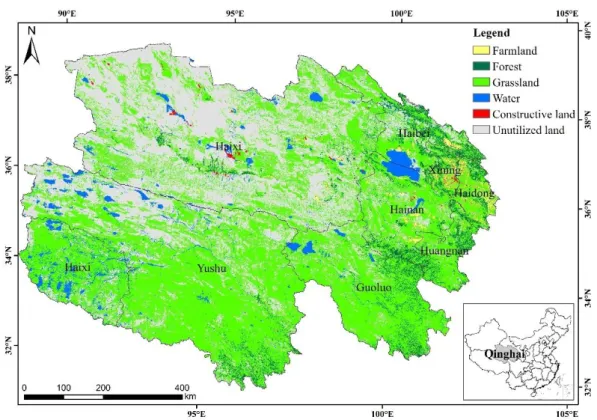
It has abundant animal and plant resources and many endemic species, such as the Tibetan antelope (Pantholops hodgsonii), snow leopard (Panthera uncia), black-necked crane (Grus nigricollis), Chinese caterpillar fungus (Ophiocordyceps sinensis), and sea buckthorn (Hippophae rhamnoides) [43]. The land types are diverse (Figure1) and mainly comprise cultivated land, forest, grassland, water area, built-up land, and unutilized land.
Sustainability 2020, 12, x; doi: FOR PEER REVIEW www.mdpi.com/journal/sustainability Figure 1. Land cover types in Qinghai.
2.2. Data Sources
To objectively reflect the characteristics of sustainable changes in the ecological environment of Qinghai Province, based on the availability of the data itself, this study chose to analyse the changes in EF and EC of Qinghai Province during the period of 2007 to 2017. This research on the consumption of biological resources mainly focuses on cereals, beans, potatoes, oilseeds, vegetables, fruits, milk, pork, beef, lamb, wool, cattle plush, poultry eggs, honey, fruits, and aquatic products. Additionally, due to the difficulty in obtaining some data, the energy consumption research mainly focuses on coal, oil, and electricity, which have accurate statistics. The above two resource data sets are derived from the Statistical Yearbook of Qinghai from 2008 to 2018.
The statistical data on the average world production of biological resources published most recently by FAOSTAT (statistics of the Food and Agriculture Organization of the United Nations, 2007–2017) is more accurate and reasonable than the data published by FAOSTAT in 1993 (for a full list of global average production, see Table A1 in Appendix A), which was referenced in previous studies. When energy consumption is converted into production area, the average heat output per unit of fossil fuel-producing land area in the world is used as the standard for conversion [49].
Because the productivity levels of the six types of biologically productive land differ in different areas, the areas of the six types of land with different productivity levels are multiplied by an equilibrium factor to convert the data into areas with the same ecological productivity, and the EF is calculated based on these results [50]. For the actual situation in Qinghai Province, this study refers to the equilibrium factors proposed by the World Wildlife Fund for Nature (WWF) in 2006: arable land 2.21, grassland 0.49, woodland 1.34, water areas 0.36, built-up land 2.21, and fossil fuel land 1.34 [51].
The yield factor reflects the difference between the ecological production capacity provided by land resources per unit area and the overall average ecological supply capacity and is a key parameter in calculating the EC of land. The ecological endowment caused by the natural geographical conditions of a region determines its value, but differences in economic development and the mode of labour can also cause differences in the production capacity among similar geographical environments. Experts and scholars have fully considered the impact of humans on the operation of ecologically productive land and have revised the production factors for China's provinces,
Figure 1.Land cover types in Qinghai.
2.2. Data Sources
To objectively reflect the characteristics of sustainable changes in the ecological environment of Qinghai Province, based on the availability of the data itself, this study chose to analyse the changes in EF and EC of Qinghai Province during the period of 2007 to 2017. This research on the consumption of biological resources mainly focuses on cereals, beans, potatoes, oilseeds, vegetables, fruits, milk, pork, beef, lamb, wool, cattle plush, poultry eggs, honey, fruits, and aquatic products. Additionally, due to the difficulty in obtaining some data, the energy consumption research mainly focuses on coal, oil, and electricity, which have accurate statistics. The above two resource data sets are derived from the Statistical Yearbook of Qinghai from 2008 to 2018.
The statistical data on the average world production of biological resources published most recently by FAOSTAT (statistics of the Food and Agriculture Organization of the United Nations, 2007–2017) is more accurate and reasonable than the data published by FAOSTAT in 1993 (for a full list of global average production, see TableA1in AppendixA), which was referenced in previous studies.
When energy consumption is converted into production area, the average heat output per unit of fossil fuel-producing land area in the world is used as the standard for conversion [49].
Because the productivity levels of the six types of biologically productive land differ in different areas, the areas of the six types of land with different productivity levels are multiplied by an equilibrium factor to convert the data into areas with the same ecological productivity, and the EF is calculated based on these results [50]. For the actual situation in Qinghai Province, this study refers to the equilibrium factors proposed by the World Wildlife Fund for Nature (WWF) in 2006: arable land 2.21, grassland 0.49, woodland 1.34, water areas 0.36, built-up land 2.21, and fossil fuel land 1.34 [51].
The yield factor reflects the difference between the ecological production capacity provided by land resources per unit area and the overall average ecological supply capacity and is a key parameter in calculating the EC of land. The ecological endowment caused by the natural geographical conditions of a region determines its value, but differences in economic development and the mode of labour can also cause differences in the production capacity among similar geographical environments. Experts and scholars have fully considered the impact of humans on the operation of ecologically productive
Sustainability2020,12, 3065 5 of 26
land and have revised the production factors for China’s provinces, municipalities, autonomous regions, and special administrative regions based on the net primary productivity of the land. The land production factor values of Qinghai Province are as follows: arable land 0.46, grassland 1.13, woodland 0.50, water areas 1.13, built-up land 0.19, and fossil energy land 0.00 [52]. In addition, according to “Our Common Future” published by the World Commission for Environment and Development (WCED), approximately 12.0% of land is allocated to biodiversity conservation [53,54]. Therefore, in the calculation of EC in this study, 12.0% of land is deducted as land under regional ecological protection, and the remaining land is considered as land with available biological resources.
The data on the areas of different EF-related land types in this study (arable land, grassland, woodland, water areas, built-up land) are derived from the 2008–2018 Qinghai Statistical Yearbook, China Land and Resources Statistics Yearbook, China Water Statistics Yearbook, Qinghai Province National Geographic Survey Bulletin, Department of Natural Resources of Qinghai Province, public data on the website of the People’s Government of Qinghai Province, and field survey data from the relevant government departments, enterprises and institutions in Qinghai.
3. Study Methods
3.1. EF
TheEFof a region refers to not only the intensity of resource consumption of individuals or populations but also the size of the resource supply and the total amount of resource consumption in that region. Additionally, it also reveals the ecological threshold of sustainable human survival [55].
EFresearch studies the field of natural capital consumption from the perspective of specific biophysical quantities, compares the resource and energy consumption of a region or country with its ownEC, and determines whether the development of a country or region is within the range of theEC[56]. The formula is as follows:
EF=N×e f =N×rj× X6
i=1
Ci
Pi (1)
whereEFis the totalEF;Nis the total population;ef is theEFper capita;iis the type of consumer goods and inputs;rjis an equivalence factor;jis the type of biologically productive land, wherej= 1, 2, 3, 4, 5, 6;Ciis the per capita resource consumption for thei-th commodity; andPiis the global average yield for thei-th consumer good.
3.2. EC
TheECreflects the maximum population that a limited resource can support without damaging regional productivity [57] as follows:
EC=N×ec=N×rj×yj× X6
j=1
aj (2)
whereECis the totalEC,ecis theECper capita,yjis the yield factor, andajis the per capita ecologically productive land area.
3.3. EF of Ten Thousand Yuan GDP
TheEFof ten thousand yuan GDP (EFG) refers to the amount ofEFneeded by a region to produce ten thousand yuan GDP. It can reflect the resource utilization rate of the region. The larger the value is, the lower the benefit of using resources. The lower the value is, the higher the benefit of using resources [58,59]. To some extent, theEFGcan reflect the relationship between the level of regional economic development and the level of land use, as well as the impact of the level and mode of
economic development on the utilization rate of land resources and the consumption of biomass [60].
The formula is as follows:
EFG=e f/GDP (3)
whereEFGis theEFof ten thousand yuan GDP,ef is Regional per capitaEF, GDP is Regional per capita GDP (ten thousand yuan).
3.4. EF Index
In the EF model, the ecological profit and loss (surplus and deficit) are first used to measure the sustainable development of a region. Wu [61] proposed using the EFindex (EFI) to measure the sustainable development of a region, as this model resolves the irrationality of the horizontal comparison of the ecological profit and loss indexes and makes the results comparable among different regions. TheEFIrepresents the percentage of the difference between theECand theEFdivided by the ECand reflects the sustainable development status of a certain area. The formula is as follows:
EFI= EC−EF
EC ×100% (4)
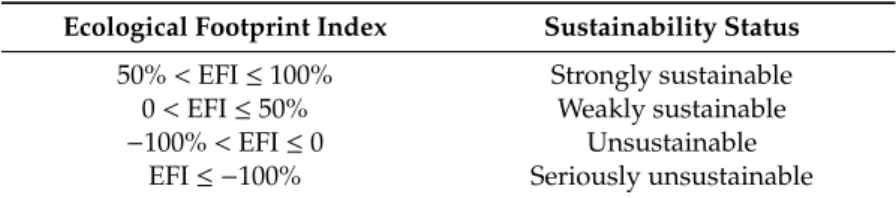
whereEFIis theEFindex. A value ofEFI=0 represents the boundary between unsustainability and sustainability. WhenEFI<0, the lower the value is, the stronger the unsustainability. WhenEFI>0, the higher the value is, the stronger the sustainability. The levels of sustainability [61,62] are presented in Table1.
Table 1.Levels of sustainability.
Ecological Footprint Index Sustainability Status 50%<EFI≤100% Strongly sustainable
0<EFI≤50% Weakly sustainable
−100%<EFI≤0 Unsustainable
EFI≤ −100% Seriously unsustainable
3.5. The Grey GM(1,1) Model
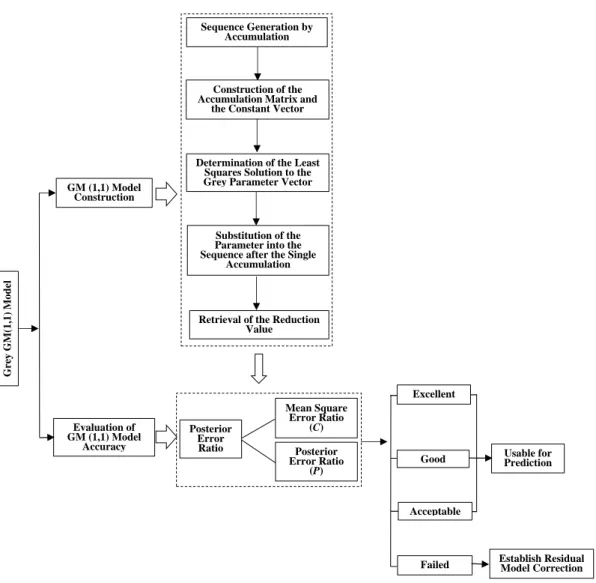
Grey system theory was founded in the 1980s and was developed by Deng Julong, a famous mathematician in China [63]. As the basic model of grey prediction theory, GM(1,1) essentially performs index fitting based on application of the least square method to the original data series from the second beginning to realize a quantitative prediction of the future changes in the system [64,65]. The model can predict short-term theoretical target values well, and the model has high precision. The data requirements are low, and the model is able to make predictions from small sample sets of poor information, so it is widely used in the prediction of the ecological safety index. The modelling process is illustrated in Figure2and includes the following steps:
(1) Sequence generation by accumulation
Sustainability2020,12, 3065 7 of 26
Sustainability 2020, 12, x FOR PEER REVIEW 9 of 30
Sustainability 2020, 12, x; doi: FOR PEER REVIEW www.mdpi.com/journal/sustainability
Figure 2. Flow chart of the construction of the grey GM(1,1) model.
4. Results and Analysis
4.1. Dynamic Changes in EF and EC in Qinghai
This paper calculates the EF and EC of Qinghai Province from 2007 to 2017. The calculation includes two components, namely, biological resource consumption and energy consumption.
Biological resource consumption includes agricultural products, animal products, forest products, aquatic products, and 16 other biological consumption indicators (for a full list of consumption of biological resources, see Table A2 in Appendix A). Energy consumption includes coal, oil, and electricity (for a full list of energy consumption, see Table A3 in Appendix A) (as shown in Tables 3 and 4).
From 2007 to 2017, the per capita EF of Qinghai Province showed an overall upward trend, from 2.3027 hm2 in 2007 to 2.9837 hm2 in 2017, an increase of 29.58% (as shown in Table 3). Among the components of the per capita EF, arable land showed a decreasing trend year by year, with a decrease
GM (1,1) Model Construction
Grey GM(1,1) Model
Mean Square Error Ratio
(C)
Usable for Prediction Evaluation of
GM (1,1) Model Accuracy
Good Sequence Generation by
Accumulation
Construction of the Accumulation Matrix and
the Constant Vector
Determination of the Least Squares Solution to the Grey Parameter Vector
Substitution of the Parameter into the Sequence after the Single
Accumulation
Retrieval of the Reduction Value
Posterior Error
Ratio Posterior
Error Ratio (P)
Establish Residual Model Correction Failed
Excellent
Acceptable
Figure 2.Flow chart of the construction of the grey GM(1,1) model.
The accumulation generation number 1-AGO (the first-order accumulating generation) stands for a single operation. The original sequence isX(0)={x(0)(1),x(0)(2),. . .,x(0)(n)}, and the sequence after the single operation is as follows:
X(1)={x(1)(1),x(1)(2),. . .,x(1)(n)} (5)
where
x(1)(k) =
k
X
i=0
x(0)(i) =x(1)(k−1) +x(0)(k) (6) Then, the mean series is calculated as follows:
z(1)(k) =0.5x(1)(k) +0.5x(1)(k−1),k=2, 3,. . .n. (7) (2) Construction of the accumulation matrixBand the constant vectorYn
B=
−z(1)(2) 1
−z(1)(3) 1
. . . .
−z(1)(n) 1
Yn =
x(0)(2) x(0)(3)
. . . x(0)(n)
(8)
where
z(1)(k) =0.5x(1)(k) +0.5x(1)(k−1) (9) (3) Determination of the least squares solution to the grey parameter vector∧α
Using this series, the first-order differential equation based on a single variable is established and used as the prediction model (that is, the GM(1,1) model). The standard form of the grey difference equation is as follows:
x(0)(k)+az(1)(k) =b,k=2, 3,. . .,n. (10) The corresponding whitening differential equation is as follows:
dx(1)(t)
dt +ax(1)(t) =b (11)
where a and b are the development coefficient of the system and endogenous control grey scale, respectively.
The estimation formula for the parameter vector ab can be written in the following form:
∧α= (BTB)−1BTYn
(4) Substitution of the parameter into the sequence after the single accumulation The time-response function of the GM(1,1) model is as follows:
ˆ
x(1)(k+1) =
"
x(0)(1)−b a
#
e−ak+b
a k=1, 2,. . .,n (12)
(5) Retrieval of the reduction value
The recovered datax(0)(k+1)can be retrieved by the inverse accumulated generating operation:
ˆ
x(0)(k+1) =xˆ(1)(k+1)−xˆ(1)(k); ˆx(0)(1) =x(1)(1) (13) or ˆx(0)(k+1)=−aX(0)(1)−b
a
!
e−ak (14)
(6) Calculation of the residual error and the relative error
ε(0)(k) =X(0)(k)−Xˆ(0)(k) (15)
e(k) =ε(0)(k)/X(0)(k) (16) whereε(0)(k)is the residual error ande(k)is the relative error.
(7) Evaluation of model accuracy
A normal method to evaluate the grey model is the posterior error test. This method tests the statistical characteristics of the residual error distribution, and the posterior error ratio C and the small error p are involved to evaluate the model.
Posterior error ratio:C= SS2
1, small error probability: p=pn
e(k−e)o<0.6745S1where
S21= 1 n
Xn
k=1
x(0)(k)−x−(0)
2
(17)
Sustainability2020,12, 3065 9 of 26
S22= 1 n
Xn
k=1
(e(k)−e)
2
(18)
x−(0)= 1 n
Xn
k=1
x(0)(k) (19)
e= 1 n
Xn
k=1
e(k) (20)
The levels of model accuracy are presented in the following table (Table2).
Table 2.Accuracy levels of the GM(1,1) model [20,66].
Accuracy Level p C
Excellent p≥0.95 C≤0.35
Good 0.80≤p<0.95 0.35<C≤0.50 Accepted 0.70≤p<0.80 0.50<C≤0.65
Failed p<0.70 0.65>C
(8) Evaluation of model accuracy
The grey model is typically evaluated by the posterior error method. The posterior error test is used to test the statistical characteristics of the residual distribution. Crepresents the mean square error ratio, andPrepresents the small error probability. The formulae are as follows:
C= SS2
1,p=pn
ε(k)−ε
o<0.6745S1; S21 = 1n Pn
k=1
x(0)(k)−x(0)2
, S22 = 1n Pn
k=1
(ε(k)−ε)
2
whereS21 is the variance ofX(0)andS22is the residual variance ofX(0).
4. Results and Analysis
4.1. Dynamic Changes in EF and EC in Qinghai
This paper calculates the EF and EC of Qinghai Province from 2007 to 2017. The calculation includes two components, namely, biological resource consumption and energy consumption. Biological resource consumption includes agricultural products, animal products, forest products, aquatic products, and 16 other biological consumption indicators (for a full list of consumption of biological resources, see TableA2in AppendixA). Energy consumption includes coal, oil, and electricity (for a full list of energy consumption, see TableA3in AppendixA) (as shown in Tables3and4).
Table 3.Ecological footprint per capita in Qinghai from 2007 to 2017.
Land Type Equivalent Factor Year
2007 2008 2009 2010 2011 2012 2013 2014 2015 2016 2017
Arable land 2.21 0.2095 0.2207 0.2133 0.2146 0.2085 0.2022 0.1934 0.1800 0.1866 0.1823 0.1668
Grassland 0.49 0.8365 0.8520 0.8665 0.8949 0.9531 0.9833 1.0028 1.0148 1.0406 1.0613 1.0857
Woodland 1.34 0.0005 0.0005 0.0006 0.0005 0.0005 0.0005 0.0005 0.0005 0.0006 0.0005 0.0005
Waters 0.36 0.0040 0.0048 0.0018 0.0035 0.0072 0.0098 0.0129 0.0192 0.0223 0.0252 0.0337
Fossil energy land 1.34 1.2128 1.2481 1.2295 1.0991 1.1636 1.3160 1.3776 1.3777 1.5267 1.6961 1.6217 Build-up land 2.21 0.0393 0.0414 0.0441 0.0615 0.0692 0.0707 0.0787 0.0880 0.0821 0.0704 0.0755
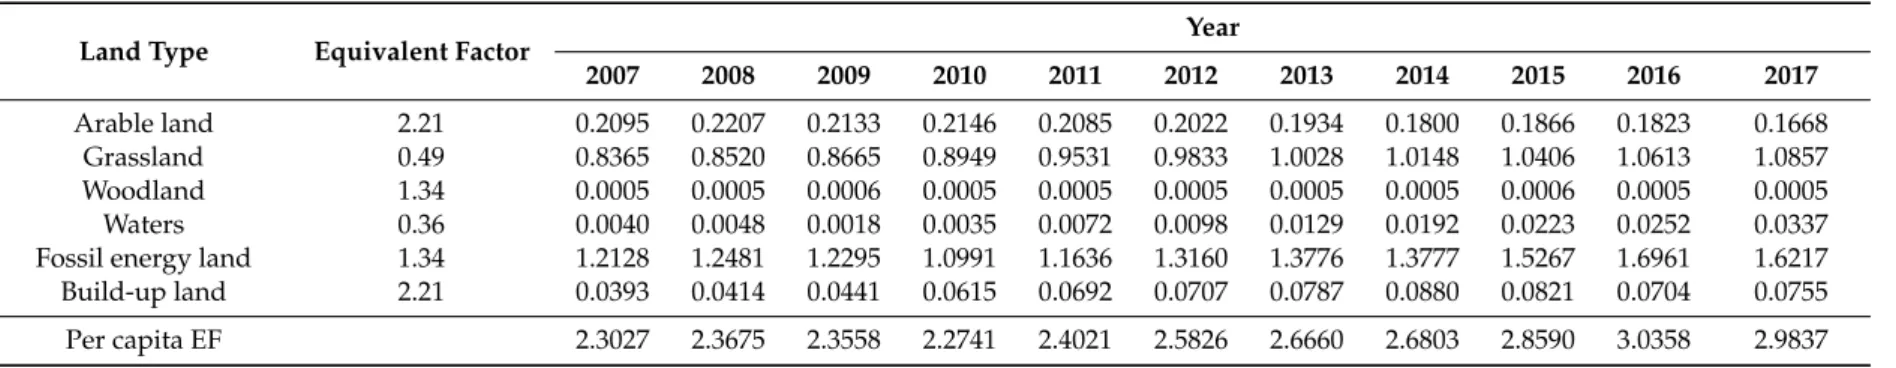
Per capita EF 2.3027 2.3675 2.3558 2.2741 2.4021 2.5826 2.6660 2.6803 2.8590 3.0358 2.9837
Table 4.Ecological carrying capacity per capita in Qinghai from 2007 to 2017.
Land Type Yield Factors Equivalent Factors Year
2007 2008 2009 2010 2011 2012 2013 2014 2015 2016 2017
Arable land 0.46 2.21 0.0921 0.0930 0.1016 0.1024 0.1035 0.1044 0.1052 0.1057 0.1073 0.1081 0.1088
Grassland 1.13 0.49 0.2462 0.2486 0.3335 0.3364 0.3397 0.3424 0.3453 0.3481 0.3519 0.3537 0.3553
Woodland 0.50 1.34 4.5179 4.5551 4.6505 4.6900 4.7343 4.7721 4.8130 4.8533 4.9061 4.9315 4.9551
Waters 1.13 0.36 0.1916 0.1932 0.1948 0.1965 0.1984 0.2000 0.1629 0.1643 0.1661 0.1670 0.1678
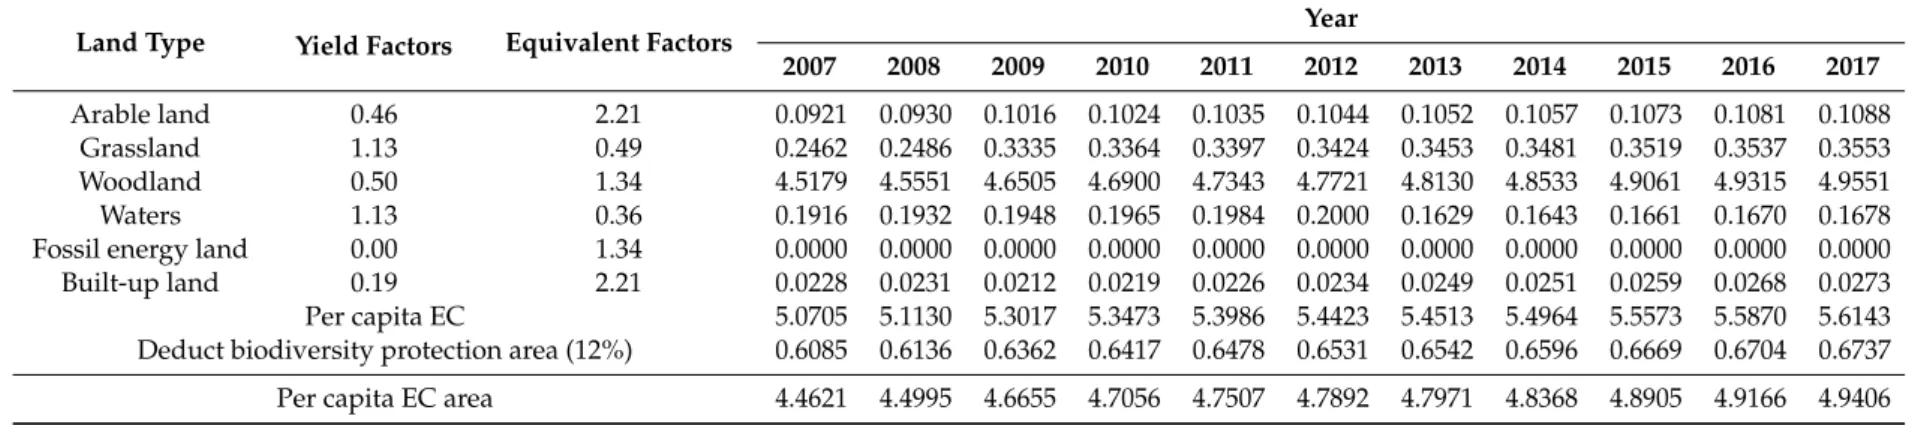
Fossil energy land 0.00 1.34 0.0000 0.0000 0.0000 0.0000 0.0000 0.0000 0.0000 0.0000 0.0000 0.0000 0.0000 Built-up land 0.19 2.21 0.0228 0.0231 0.0212 0.0219 0.0226 0.0234 0.0249 0.0251 0.0259 0.0268 0.0273 Per capita EC 5.0705 5.1130 5.3017 5.3473 5.3986 5.4423 5.4513 5.4964 5.5573 5.5870 5.6143 Deduct biodiversity protection area (12%) 0.6085 0.6136 0.6362 0.6417 0.6478 0.6531 0.6542 0.6596 0.6669 0.6704 0.6737 Per capita EC area 4.4621 4.4995 4.6655 4.7056 4.7507 4.7892 4.7971 4.8368 4.8905 4.9166 4.9406
Sustainability2020,12, 3065 11 of 26
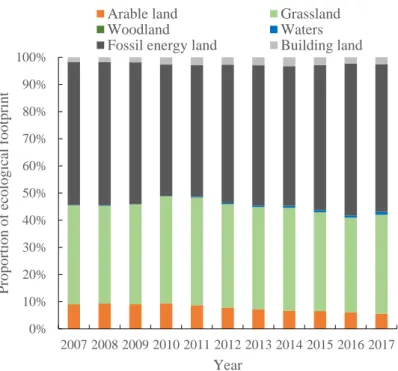
From 2007 to 2017, the per capita EF of Qinghai Province showed an overall upward trend, from 2.3027 hm2in 2007 to 2.9837 hm2in 2017, an increase of 29.58% (as shown in Table3). Among the components of the per capita EF, arable land showed a decreasing trend year by year, with a decrease of 20.41% and a per capita contribution rate of the EF of 7.77%. Annual fluctuation in the EF of woodland was not obvious, remaining stable at 0.0005–0.0006 hm2, but because the contribution rate of woodland to the overall per capita EF was relatively low and the average annual occupation rate was 0.02%, the impact on the per capita EF was small. The other components show an increasing trend to varying degrees. Among them, the increase in water was the highest, reaching 740.07%. The increase in water is mainly due to the substantial increase in aquaculture production. TheEFof built-up land increased by 92.17% after an initial decrease. However, the contributions to the per capitaEFof water and built-up land were low, at 0.48% and 2.51%, respectively. TheEFof fossil fuel land showed a trend of first decreasing and then increasing slightly, with a final increase of 33.71%. Grassland showed an obvious linear increase, reaching 29.78%. Additionally, the percentage contributions of fossil fuel land and grassland to the per capitaEFwere high, at 52% and 37.22%, respectively, and therefore had pronounced impacts on the per capitaEF(Figure3). The economic development of Qinghai is mainly supported by the consumption of natural resources and energy resources.
Sustainability 2020, 12, x FOR PEER REVIEW 10 of 30
Sustainability 2020, 12, x; doi: FOR PEER REVIEW www.mdpi.com/journal/sustainability
of 20.41% and a per capita contribution rate of the EF of 7.77%. Annual fluctuation in the EF of woodland was not obvious, remaining stable at 0.0005–0.0006 hm2, but because the contribution rate of woodland to the overall per capita EF was relatively low and the average annual occupation rate was 0.02%, the impact on the per capita EF was small. The other components show an increasing trend to varying degrees. Among them, the increase in water was the highest, reaching 740.07%. The increase in water is mainly due to the substantial increase in aquaculture production. The EF of built- up land increased by 92.17% after an initial decrease. However, the contributions to the per capita EF of water and built-up land were low, at 0.48% and 2.51%, respectively. The EF of fossil fuel land showed a trend of first decreasing and then increasing slightly, with a final increase of 33.71%.
Grassland showed an obvious linear increase, reaching 29.78%. Additionally, the percentage contributions of fossil fuel land and grassland to the per capita EF were high, at 52% and 37.22%, respectively, and therefore had pronounced impacts on the per capita EF (Figure 3). The economic development of Qinghai is mainly supported by the consumption of natural resources and energy resources.
Figure 3. The proportion of ecological footprint per capita in different types of biologically productive land.
0%
10%
20%
30%
40%
50%
60%
70%
80%
90%
100%
2007 2008 2009 2010 2011 2012 2013 2014 2015 2016 2017
Proportion of ecological footprint
Year
Arable land Grassland
Woodland Waters
Fossil energy land Building land
Figure 3.The proportion of ecological footprint per capita in different types of biologically productive land.
As shown in Table4, from 2007 to 2017, Qinghai Province’s per capitaECbasically remained stable at 4.4621–4.9406 hm2(Correlation data for the Biologically Productive Area used in the study are reported in TableA4that appear in AppendixA), exhibiting an increase of only 10.72%, corresponding to a slight upward trend. The change inECof each type of biologically productive land in the selected area is relatively small. The contribution rate of woodland toECis the largest, with an average annual contribution rate of 185.08%, followed by grassland, with a contribution rate of 12.67%. Among the land cover types, water areas, arable land, built-up land, and fossil energy land have the lowest contribution percentages, ranging between 0.93% and 0%. The increase rates and contribution rates of grassland and woodlandEChave the greatest impact on the sustainable development of the ecosystems in Qinghai.
Figure4shows that the per capitaECof Qinghai from 2007 to 2017 generally showed a slowly rising trend without obvious fluctuations. Although the per capitaEFdecreased slightly in 2009–2010 and 2017, it still showed an upward trend as a whole. This pattern was observed mainly because the per capitaEFof fossil energy land in 2009–2010 and 2017 was significantly lower than that of the previous
Sustainability2020,12, 3065 12 of 26
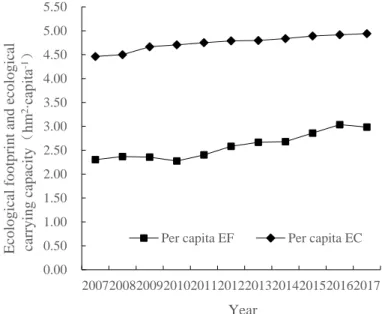
year and because of the large proportion of per capitaEFcontributed by fossil energy land, which directly affected the per capitaEF. During the 11-year study period, the per capitaECof Qinghai was significantly higher than the per capitaEF, with an average of more than 2.1788 hm2. This shows that the consumption of natural resources by human beings increased year by year and that the pressure on the ecological environment increased day by day. However, the resource consumption did not exceed the overall carrying capacity of the environment, and with the enhancement of environmental awareness, the quality of the ecological environment also improved year by year, providing a strong guarantee for human production and life.
Sustainability 2020, 12, x; doi: FOR PEER REVIEW www.mdpi.com/journal/sustainability
Figure 4 shows that the per capita EC of Qinghai from 2007 to 2017 generally showed a slowly rising trend without obvious fluctuations. Although the per capita EF decreased slightly in 2009–2010 and 2017, it still showed an upward trend as a whole. This pattern was observed mainly because the per capita EF of fossil energy land in 2009–2010 and 2017 was significantly lower than that of the previous year and because of the large proportion of per capita EF contributed by fossil energy land, which directly affected the per capita EF. During the 11-year study period, the per capita EC of Qinghai was significantly higher than the per capita EF, with an average of more than 2.1788 hm2. This shows that the consumption of natural resources by human beings increased year by year and that the pressure on the ecological environment increased day by day. However, the resource consumption did not exceed the overall carrying capacity of the environment, and with the enhancement of environmental awareness, the quality of the ecological environment also improved year by year, providing a strong guarantee for human production and life.
Figure 4. Comparison of changes in ecological footprint and ecological carrying capacity per capita in Qinghai.
4.2. EFI of Qinghai Province
Figure 5 shows that the overall EFI of Qinghai Province generally decreased from 2007 to 2017, indicating that the sustainability of the ecological environment in Qinghai weakened over time.
During the 11-year study period, the EFI decreased slowly in 2010 and 2014 and then increased slightly in 2017, but overall, the sustainability decreased over time. The EFI decreased by 18.16% over the 11 years. According to the levels of sustainability (Table 1), Qinghai was in a weakly sustainable state in 2007–2017, and it was in a strongly sustainable state in 2015. These data show that although the current growth of the EF did not exceed the EC, the decrease in the EFI indicates that the unsustainability increased over time.
0.00 0.50 1.00 1.50 2.00 2.50 3.00 3.50 4.00 4.50 5.00 5.50
20072008200920102011201220132014201520162017 Ecological footprint and ecological carrying capacity(hm2∙capita-1)
Year
Per capita EF Per capita EC
Figure 4.Comparison of changes in ecological footprint and ecological carrying capacity per capita in Qinghai.
4.2. EFI of Qinghai Province
Figure5shows that the overallEFIof Qinghai Province generally decreased from 2007 to 2017, indicating that the sustainability of the ecological environment in Qinghai weakened over time. During the 11-year study period, theEFIdecreased slowly in 2010 and 2014 and then increased slightly in 2017, but overall, the sustainability decreased over time. TheEFIdecreased by 18.16% over the 11 years. According to the levels of sustainability (Table1), Qinghai was in a weakly sustainable state in 2007–2017, and it was in a strongly sustainable state in 2015. These data show that although the current growth of theEFdid not exceed theEC, the decrease in theEFIindicates that the unsustainability increased over time.
Sustainability2020,12, 3065 13 of 26
Sustainability 2020, 12, x FOR PEER REVIEW 15 of 30
Sustainability 2020, 12, x; doi: FOR PEER REVIEW www.mdpi.com/journal/sustainability
Figure 5. Ecological footprint index of Qinghai Province.
4.3. EF of Ten Thousand Yuan of GDP in Qinghai
Figure 6 depicts the EF of ten thousand yuan of GDP in Qinghai (for a full list of EF of ten thousand yuan of GDP, see Table A5 in Appendix A), which shows a fluctuating downward trend, from 1.5873 hm2 in 2007 to 0.6774 hm2 in 2017. The per capita GDP of Qinghai increased over the same time period, from 14,507 yuan in 2007 to 44,047 yuan in 2017, with an average annual growth rate of 11.75%. This shows that during the study period, the economic development speed of Qinghai accelerated, the industrial structure was optimized to a certain extent, the goals of energy conservation and emission reduction were promoted, the utilization efficiency of resources and energy continuously improved, and the production efficiency per unit land area continuously improved. As a result, the EF of ten thousand yuan of GDP decreased significantly.
Figure 6. Ecological footprint of ten thousand yuan of GDP in Qinghai Province.
4.4. Prediction Analysis of Per Capita EF, Per Capita EC, and EF of Ten Thousand Yuan of GDP in Qinghai.
The data on the EF per capita, EC per capita and EF per 10000 yuan of GDP in Qinghai Province from 2007 to 2017 and the GM(1,1) model, in conjunction with data analysis software, were used to perform multiple residual sequence analysis and construct the following prediction formulas: x(t + 1)
= 66.7770e0.3641 − 64.4743, x(t + 1) = 4.4640e0.0957 − 0.0019, and x(t + 1)= −14.8670e−0.9273 − 16.4543. Refer to Table 2 for comparison of forecast results. Figure 7a-c and the prediction error test data in Table 5 show that the accuracy levels of the per capita EF (p = 0.9091 C = 0.2897), per capita EC (p = 0.8182 C
= 0.2979), and EF of ten thousand yuan of GDP (p = 0.9091 C = 0.3952) are good and that the
0 10 20 30 40 50 60
2007 2008 2009 2010 2011 2012 2013 2014 2015 2016 2017
EFI(%)
Year
0.0 0.2 0.4 0.6 0.8 1.0 1.2 1.4 1.6 1.8
2007 2008 2009 2010 2011 2012 2013 2014 2015 2016 2017 Ecological footprint of ten thousand yuan(hm2∙10-4)
Year
Figure 5.Ecological footprint index of Qinghai Province.
4.3. EF of Ten Thousand Yuan of GDP in Qinghai
Figure6depicts the EFof ten thousand yuan of GDP in Qinghai (for a full list ofEFof ten thousand yuan of GDP, see TableA5in AppendixA), which shows a fluctuating downward trend, from 1.5873 hm2in 2007 to 0.6774 hm2in 2017. The per capita GDP of Qinghai increased over the same time period, from 14,507 yuan in 2007 to 44,047 yuan in 2017, with an average annual growth rate of 11.75%. This shows that during the study period, the economic development speed of Qinghai accelerated, the industrial structure was optimized to a certain extent, the goals of energy conservation and emission reduction were promoted, the utilization efficiency of resources and energy continuously improved, and the production efficiency per unit land area continuously improved. As a result, theEF of ten thousand yuan of GDP decreased significantly.
Sustainability 2020, 12, x FOR PEER REVIEW 15 of 30
Sustainability 2020, 12, x; doi: FOR PEER REVIEW www.mdpi.com/journal/sustainability
Figure 5. Ecological footprint index of Qinghai Province.
4.3. EF of Ten Thousand Yuan of GDP in Qinghai
Figure 6 depicts the EF of ten thousand yuan of GDP in Qinghai (for a full list of EF of ten thousand yuan of GDP, see Table A5 in Appendix A), which shows a fluctuating downward trend, from 1.5873 hm2 in 2007 to 0.6774 hm2 in 2017. The per capita GDP of Qinghai increased over the same time period, from 14,507 yuan in 2007 to 44,047 yuan in 2017, with an average annual growth rate of 11.75%. This shows that during the study period, the economic development speed of Qinghai accelerated, the industrial structure was optimized to a certain extent, the goals of energy conservation and emission reduction were promoted, the utilization efficiency of resources and energy continuously improved, and the production efficiency per unit land area continuously improved. As a result, the EF of ten thousand yuan of GDP decreased significantly.
Figure 6. Ecological footprint of ten thousand yuan of GDP in Qinghai Province.
4.4. Prediction Analysis of Per Capita EF, Per Capita EC, and EF of Ten Thousand Yuan of GDP in Qinghai.
The data on the EF per capita, EC per capita and EF per 10000 yuan of GDP in Qinghai Province from 2007 to 2017 and the GM(1,1) model, in conjunction with data analysis software, were used to perform multiple residual sequence analysis and construct the following prediction formulas: x(t + 1)
= 66.7770e0.3641 − 64.4743, x(t + 1) = 4.4640e0.0957 − 0.0019, and x(t + 1)= −14.8670e−0.9273 − 16.4543. Refer to Table 2 for comparison of forecast results. Figure 7a-c and the prediction error test data in Table 5 show that the accuracy levels of the per capita EF (p = 0.9091 C = 0.2897), per capita EC (p = 0.8182 C
= 0.2979), and EF of ten thousand yuan of GDP (p = 0.9091 C = 0.3952) are good and that the
0 10 20 30 40 50 60
2007 2008 2009 2010 2011 2012 2013 2014 2015 2016 2017
EFI(%)
Year
0.0 0.2 0.4 0.6 0.8 1.0 1.2 1.4 1.6 1.8
2007 2008 2009 2010 2011 2012 2013 2014 2015 2016 2017 Ecological footprint of ten thousand yuan(hm2∙10-4)
Year
Figure 6.Ecological footprint of ten thousand yuan of GDP in Qinghai Province.
4.4. Prediction Analysis of Per Capita EF, Per Capita EC, and EF of Ten Thousand Yuan of GDP in Qinghai.
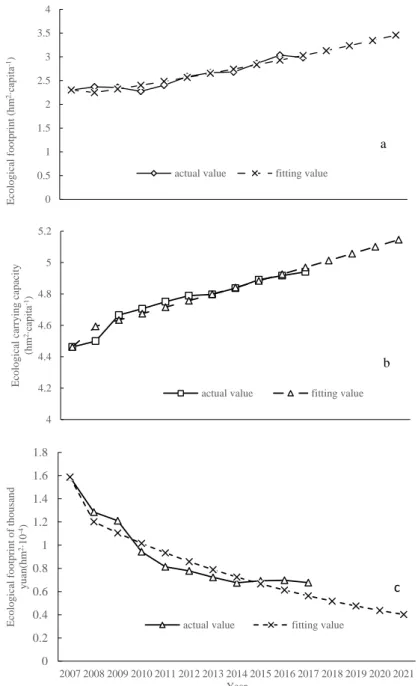
The data on theEFper capita,ECper capita andEFper 10000 yuan of GDP in Qinghai Province from 2007 to 2017 and the GM(1,1) model, in conjunction with data analysis software, were used to perform multiple residual sequence analysis and construct the following prediction formulas: x(t+1)= 66.7770e0.3641−64.4743, x(t+1)=4.4640e0.0957−0.0019, and x(t+1)=−14.8670e−0.9273−16.4543. Refer to Table2for comparison of forecast results. Figure7a-c and the prediction error test data in Table5show that the accuracy levels of the per capitaEF(p=0.9091C=0.2897), per capitaEC(p=0.8182C=0.2979), andEFof ten thousand yuan of GDP (p=0.9091C=0.3952) are good and that the discrimination is
in line with requirements. Finally, according to the model, the per capitaEFvalues for 2018–2021 are 3.1448, 3.2521, 3.3631, and 3.477. The per capita EC values are 4.9798, 5.0141, 5.0487, and 5.0835. TheEF values of ten thousand yuan of GDP are 0.5175, 0.4757, 0.4372, and 0.4019. Therefore, with the economic development of Qinghai Province, the living standard of residents is expected to gradually improve, and consumption is expected to increase, which will lead to a continuous increase in the per capitaEF.
Additionally, the per capitaECis also expected to gradually increase, which shows that although the impact of humans on the surrounding environment will increase, people’s awareness of environmental protection will also deepen. However, judging from the predicted value, the per capita ecological surplus value has decreased over time, from 2.1594 hm2in 2007 to 1.9569 hm2in 2017, and it is predicted that it will continue to decrease to 1.6057 hm2in 2021, with an average annual decrease of 2.094%. This shows that although ecological pressure has been alleviated to some extent, the prospect for improvement is poor.Sustainability 2020, 12, x FOR PEER REVIEW 17 of 30
Sustainability 2020, 12, x; doi: FOR PEER REVIEW www.mdpi.com/journal/sustainability
Figure 7. The agreement between actual values and fitting values and the forecast results. (a) is EF per capita, (b) is EC per capita, (c)is EF of Ten Thousand Yuan GDP.
4.5. Spatial Evolution Characteristics of the Sustainable Development State in Qinghai Province
Due to the uneven distribution of natural resources and economic activities, the sustainability of cities at various levels in Qinghai Province varies(Correlation data for the EFI of cities (prefectures) in Tables A6 that appear in Appendix A). As evidenced by the spatial distribution characteristics (Figure 8), in Qinghai Province in four periods (2007, 2012, 2017, and 2021), the eastern region has undergone pronounced changes in sustainable development status, while the central and western regions are in a stable state. (The state of sustainable development in 2021 is based on the results predicted by the GM(1,1) model above.)
In general, in the study area, there is a seriously unsustainable area concentrated around the eastern two cities of Xining and Haidong, which exhibits a seriously unsustainable state in all four
0 0.5 1 1.5 2 2.5 3 3.5 4
Ecological footprint (hm2∙capita-1)
actual value fitting value
a
4 4.2 4.4 4.6 4.8 5 5.2
Ecological carrying capacity (hm2∙capita-1)
actual value fitting value
b
0 0.2 0.4 0.6 0.8 1 1.2 1.4 1.6 1.8
2007 2008 2009 2010 2011 2012 2013 2014 2015 2016 2017 2018 2019 2020 2021 Ecological footprint of thousand yuan(hm2∙10-4)
Year
actual value fitting value
c
Figure 7.The agreement between actual values and fitting values and the forecast results. (a) isEFper capita, (b) isECper capita, (c) isEFof Ten Thousand Yuan GDP.
Sustainability2020,12, 3065 15 of 26
Table 5.GM(1,1) prediction error test.
Type Model Accuracy Model Accuracy Level
Per capita EF p=0.9091 C=0.2897 Good
Per capita EC p=0.8182 C=0.2979 Good
EF of Ten Thousand
Yuan of GDP p=0.9091 C=0.3952 Good
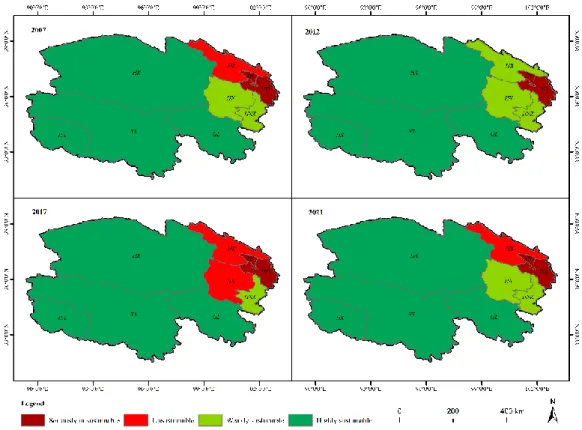
4.5. Spatial Evolution Characteristics of the Sustainable Development State in Qinghai Province
Due to the uneven distribution of natural resources and economic activities, the sustainability of cities at various levels in Qinghai Province varies (Correlation data for the EFI of cities (prefectures) in TableA6that appear in AppendixA). As evidenced by the spatial distribution characteristics (Figure8), in Qinghai Province in four periods (2007, 2012, 2017, and 2021), the eastern region has undergone pronounced changes in sustainable development status, while the central and western regions are in a stable state. (The state of sustainable development in 2021 is based on the results predicted by the GM(1,1) model above.)
Sustainability 2020, 12, x FOR PEER REVIEW 18 of 30
Sustainability 2020, 12, x; doi: FOR PEER REVIEW www.mdpi.com/journal/sustainability
time periods. Unsustainable areas generally surround the severely unsustainable regions, and Haibei was classified an unsustainable, weakly sustainable, unsustainable, and unsustainable in the four time periods. Hainan was generally weakly sustainable, except for a period of being classified as unsustainable in 2017. In all four periods, Huangnan exhibited a weakly sustainable state, while Guoluo, Yushu, and Haixi exhibited strongly sustainable states.
However, the overall EFI of the prefecture-level cities in Qinghai Province has fluctuated, first increasing, then decreasing, and then increasing again, indicating that the sustainability of the whole Qinghai Province has fluctuated greatly. However, overall, there is a change towards a good trend in the future.
Figure 8. Sustainable development status of cities (prefectures) in Qinghai Province. Note: Xining is abbreviated as "XN", Haidong is abbreviated as "HD", Haibei is abbreviated as "HB", Hainan is abbreviated as "HN", Huangnan is abbreviated as "HNZ", Guoluo is abbreviated as " "GL", Yushu Prefecture is abbreviated as "YS", and Haixi Prefecture is abbreviated as "HX".
5. Discussion
5.1. Advantages and Applicability of the Method
A social ecosystem is a complex system composed of biological, geological, and physical units and their related social roles [67], with numerous uncertain and uncertain factors [68]. Because the study of sustainable development involves multiple disciplines, objective scientific evaluation of sustainable socioeconomic development is a challenge for researchers. In this study, an EF model was used to evaluate the sustainable development of the ecosystem in Qinghai Province. This method not only can accurately reflect the supply capacity and human resource consumption of the ecosystem in the study area but also allows comparisons of the carrying capacity and EF results of the area. In this study, the world average production value of biological resources was calculated based on recent data. In contrast to a previous study [69] that used data published by FAOSTAT (FAO Statistics of 1993[70]), the present study used the latest data on the average world production of biological resources for each year from 2007 to 2017. With regard to the selection of the equilibrium factor, this
Figure 8.Sustainable development status of cities (prefectures) in Qinghai Province. Note: Xining is abbreviated as “XN”, Haidong is abbreviated as “HD”, Haibei is abbreviated as “HB”, Hainan is abbreviated as “HN”, Huangnan is abbreviated as “HNZ”, Guoluo is abbreviated as “GL”, Yushu Prefecture is abbreviated as “YS”, and Haixi Prefecture is abbreviated as “HX”.
In general, in the study area, there is a seriously unsustainable area concentrated around the eastern two cities of Xining and Haidong, which exhibits a seriously unsustainable state in all four time periods. Unsustainable areas generally surround the severely unsustainable regions, and Haibei was classified an unsustainable, weakly sustainable, unsustainable, and unsustainable in the four time periods. Hainan was generally weakly sustainable, except for a period of being classified as unsustainable in 2017. In all four periods, Huangnan exhibited a weakly sustainable state, while Guoluo, Yushu, and Haixi exhibited strongly sustainable states.
However, the overall EFI of the prefecture-level cities in Qinghai Province has fluctuated, first increasing, then decreasing, and then increasing again, indicating that the sustainability of the whole Qinghai Province has fluctuated greatly. However, overall, there is a change towards a good trend in the future.
5. Discussion
5.1. Advantages and Applicability of the Method
A social ecosystem is a complex system composed of biological, geological, and physical units and their related social roles [67], with numerous uncertain and uncertain factors [68]. Because the study of sustainable development involves multiple disciplines, objective scientific evaluation of sustainable socioeconomic development is a challenge for researchers. In this study, an EF model was used to evaluate the sustainable development of the ecosystem in Qinghai Province. This method not only can accurately reflect the supply capacity and human resource consumption of the ecosystem in the study area but also allows comparisons of the carrying capacity and EF results of the area. In this study, the world average production value of biological resources was calculated based on recent data. In contrast to a previous study [69] that used data published by FAOSTAT (FAO Statistics of 1993 [70]), the present study used the latest data on the average world production of biological resources for each year from 2007 to 2017. With regard to the selection of the equilibrium factor, this study is based on the actual situation of Qinghai Province and refers to the equilibrium factor proposed by the World Wide Fund for Nature (WWF) in 2006. These two features of the present study enhance the accuracy of the results. Moreover, the combination of the EF model and grey GM(1:1) prediction model can be used to predict ecosystem degradation and changes in environmental quality caused by human activities in the next few years. Furthermore, it has important reference value for promoting the sustainable and healthy development of the regional social economy. In addition, the method is simple, adaptable, and intuitive and has room for improvement. The method is convenient for investigating the sustainable development of social ecosystems and can be used in different regions. It can improve the quantitative evaluation of sustainable development.
5.2. Comparison and Discussion of Results
The per capita EF of Qinghai Province is increasing, having an average annual growth rate of 2.38%. This value indicates that the area of ecological land be appropriated for human activities is increasing, but at a slow rate. The per capita EC of Qinghai Province remained between 4.4621 hm2 and 4.9406 hm2and showed an upward trend. These results indicate that the overall level of EC during the study period was high and can accommodate the pressure from local human activities. These findings differ from those of Su Wenliang [4], Wang Xiaopeng [40], and Zhong Rongfeng [43] because Su Wenliang employed different kinds of renewable energy for calculation, while the latter two authors adopted global average productivity, equilibrium factor and yield factor without considering regional specificity. Among the six land use types considered in this study, fossil fuel land accounted for more than half of the total eco-environmental footprint in Qinghai Province in the 11 years under study. This result shows that the economic growth of Qinghai Province is highly dependent on resources. The leading industries, which include oil and gas exploitation, water conservancy and power generation, and the salt industry, are all resource-based industries [71]. The resource endowment of Qinghai Province has promoted the province’s economic and social development [72]. However, the land types that mainly consume energy place enormous pressure on the environment. The average EF of grassland, with the second-highest contribution rate, reached nearly 38%. Qinghai Province is one of the five pastoral areas in China, and the grassland area accounts for approximately 1/2 of the total land area of the province [73]. Animal husbandry in region is developed. In 2017, the total output value of animal husbandry in Qinghai Province was 18.298 billion yuan, accounting for 51.13% of the total output value of the agriculture, forestry, animal husbandry, and fishery sectors [45]. Animal
Sustainability2020,12, 3065 17 of 26
husbandry is the main industry in Qinghai, and many residents make their living by grazing livestock.
Therefore, there are many EFs in grassland. In addition, the proportions of land use types indicate that the distribution of equal employment opportunities is far from balanced. Furthermore, they show that with the economic changes and improved living standards, human consumption of biological resources and fossil energy is increasing [73,74].
Qinghai’s EFI has been within the range of 0–50% for 11 years. It reached a strong sustainable state in 2010 (51.7%). These results indicate that the resources and environment of Qinghai Province are in a sustainable state as a whole. This sustainable state is due to Qinghai’s geographical location and intact ecosystem functions. Compared with that in other parts of the country, the carrying capacity of natural resource systems in this province is strong [75]. However, as shown in Figure5, its EFI has been decreasing yearly. The EFI is determined by both the EC and the EF; thus, as the EC of Qinghai Province changed little, decline in its EFI can be attributed to the increase in EF. The findings indicate that the economic and social development of Qinghai Province consumes a large amount of resources and is increasing rapidly and that the pressure on the environment is increasing daily. From 2007 to 2015, the growth of both the population and GDP in Qinghai Province was too rapid, which reduced the environmental carrying capacity. Furthermore, the tourism industry in Qinghai Province has developed rapidly in recent years. The total income of the local tourism industry has increased by more than five times over the period 2008–2017. Although this increase has promoted the local economy, it has led to the overuse of local resources and the environment and an increase in regional EF. These factors are the main factors leading to the decline of the EFI in Qinghai Province. In addition, during 2007–2017, the temperature in Qinghai Province increased by 0.3–0.5◦C [45]. Some studies have shown that increasing temperature can not only promote the growth of forage but also cause grassland degradation due to increased soil water evaporation and transpiration loss [76]. However, the main cause of grassland degradation is overgrazing [77,78]. The degradation of grassland and grassland environmental quality will weaken the EC of Qinghai Province and directly affect the sustainability of the local environment. In summary, under the combined effects of socioeconomic factors and environmental factors, the sustainability of Qinghai Province will decline yearly, and the conflict between socioeconomic development and environmental resource management will become increasingly prominent.
The overall EF of ten thousand yuan GDP in Qinghai Province shows a downward trend, indicating that the utilization rate of resources in Qinghai Province is improving, consistent with the results of Yu Cui [79] and Ma Li [44]. However, compared with other provinces in China, including Sichuan Province [28] and Jiangxi Province [80], the EF of ten thousand yuan GDP in Qinghai Province is still at a high level. Since the development in the west and with the implementation of the policy of returning farmland to grassland, Qinghai Province has made progress in transforming the mode of economic growth, but it remains underdeveloped in science and technology and management, resulting in a large amount of resource waste [3]. In addition, population growth; urbanization acceleration; and economic, social, and industrial development and many other factors have led to increased resource demand and consumption. In general, there is opportunity for improvement in the utilization rate of resources in Qinghai Province. Based on the current economic development mode and population growth rate of the province, the GM(1,1) model was used to predict the future sustainability of the study area. The forecast results indicate that from 2018 to 2021, the per capita EF and per capita EC will increase yearly and that the ten thousand yuan GDP EF will decrease yearly. These findings indicate that Qinghai will remain sustainable in the near short term but that the available ecological surplus will gradually decrease, with an expected average annual reduction rate reaching 3.39%. The results indicate that Qinghai will become unsustainable in the near future if the development mode is not changed. However, as the economic development of Qinghai is in the middle stage of industrialization, large-scale urban construction and upgrading of the consumption structure of residents will inevitably lead to the sustained growth of some energy intensive industries. It remains a challenge to accelerate the structural adjustment and change the mode of production in the short term.
![Table 2. Accuracy levels of the GM(1,1) model [20,66].](https://thumb-ap.123doks.com/thumbv2/123dok/12171215.0/9.892.378.516.130.296/table-2-accuracy-levels-gm-model-20-66.webp)