Cactus Crater, one of the smallest of the blast craters formed in the test program, is the subject of several chapters here. The determination of the high to low Mg calcite transition (Chapter 5) as an abrupt discontinuity (outside the crater area) was not a. deliberate effort, but is an important contribution to the field of carbonate diagenesis.
CHAPTER 2
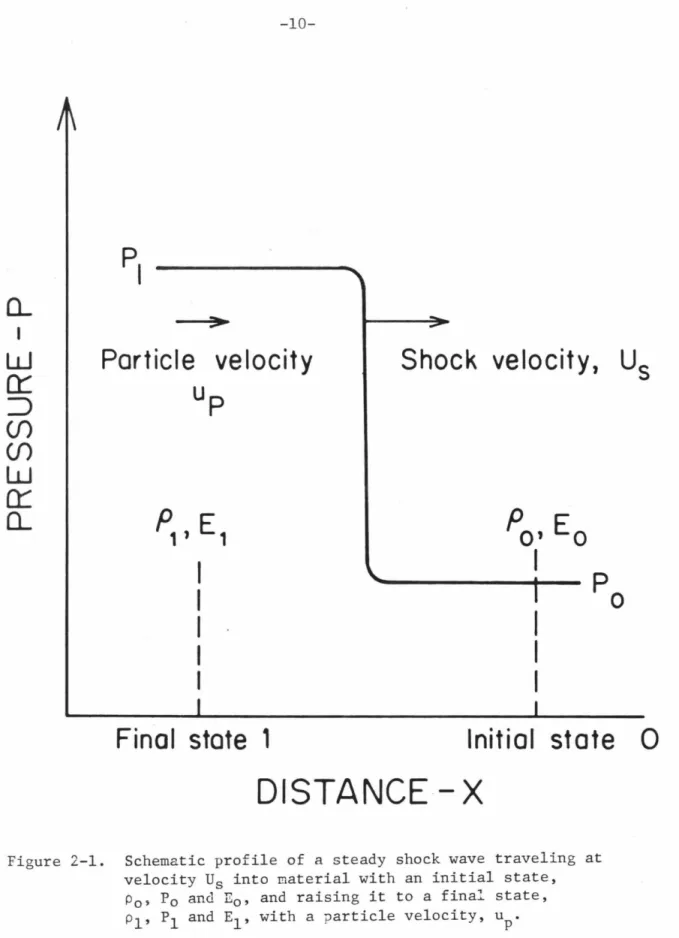
Particle velocity up
Final state 1
Shock velocity, Us
Initial state 0
Assuming that the material behind the shock front behaves hydrodynamically, conservation equations of mass, momentum, and energy can be used to determine. Although the shock compression process is adiabatic, it involves irreversible work and is therefore not isentropic.
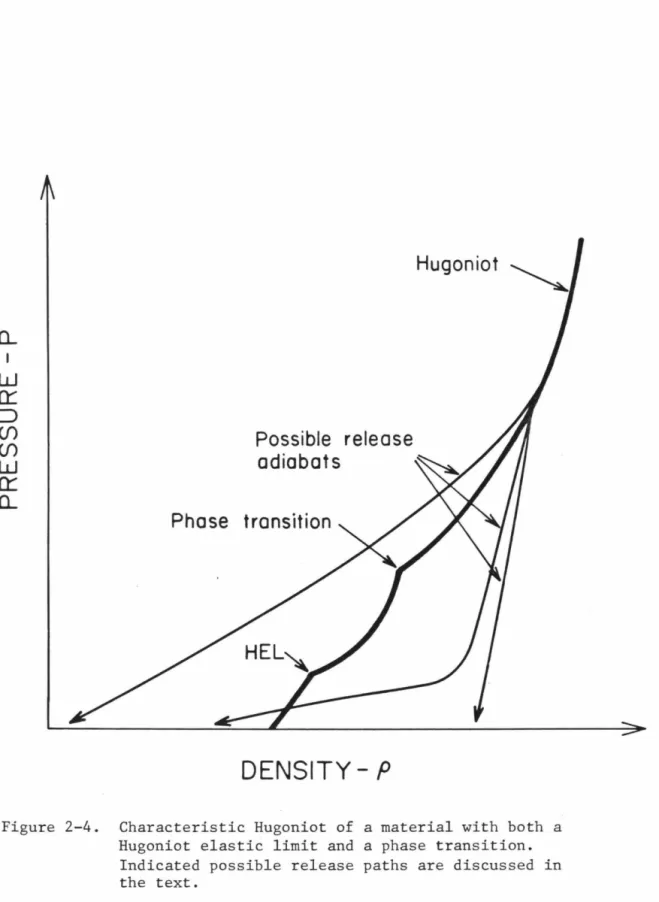
Hugoniot
DENSITY-P
2-3, the transition from elastic to plastic is characterized by a kink in the Hugoniot that separates the lower-pressure elastic regime, governed by a linear stress-strain relationship, from the higher-pressure plastic regime. Note that these velocities are proportional to the slope of the Rayleigh lines in the elastic and plastic regions.
HEL I /
Elastic Hugoniot
DENSITY - P
Plastic Hugoniot
The integrated area, PdV, under these release adiabats represents energy absorbed by the material. The methods used to estimate temperatures along the Hugoniot and entropies along the release adiabats are presented in Chapter 6 and will not be repeated here.
Possible release
Phase transition
DENSITY- P
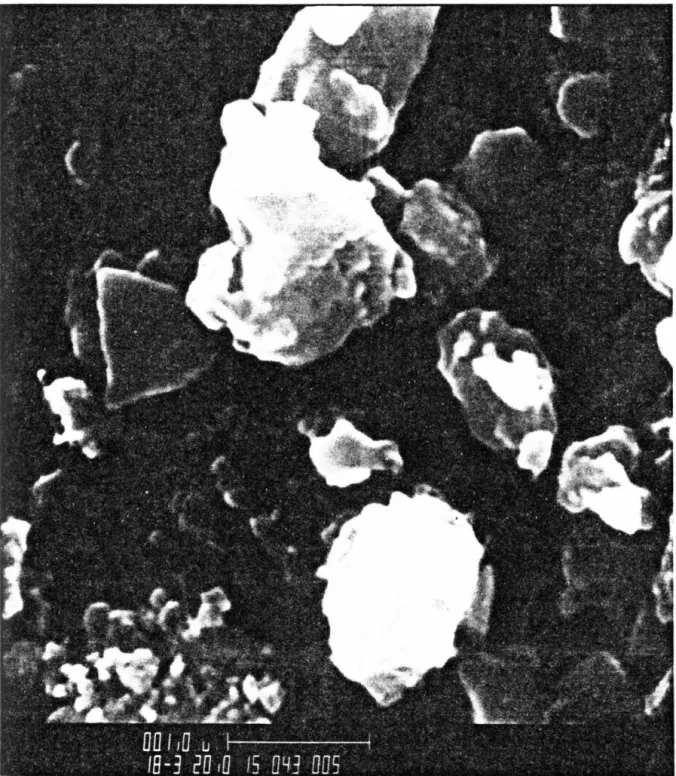
SEM photo of the 11.1 m sample from the central core of Cactus Crater (XC-1) showing the fragmented nature of the fine particles. It is also the lithology comprising the highest level of XRU-1, located just outside Cactus Crater (Fig. 3-2); although not observed at the top of core XC-1, this rock type was probably present in
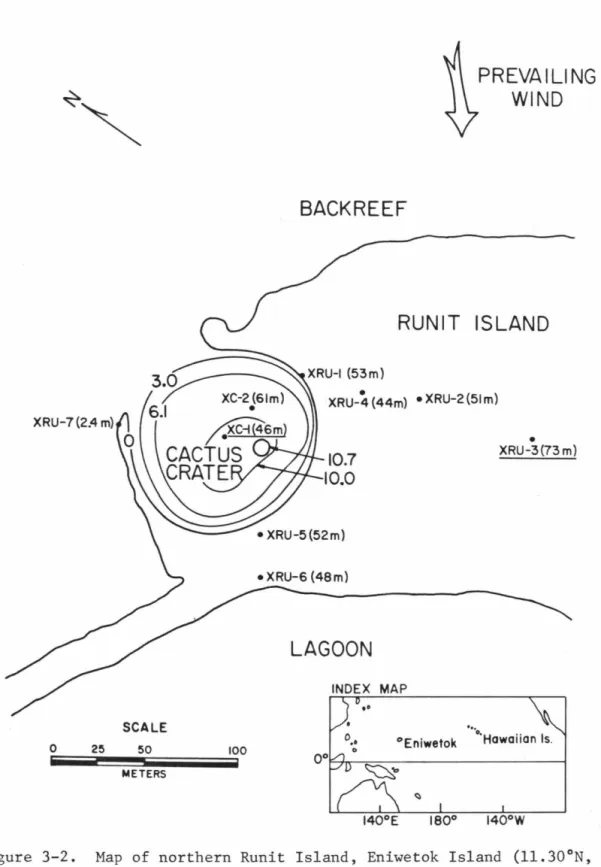
BACK REEF
PREVAILING WIND
RUNIT ISLAND
LAGOON
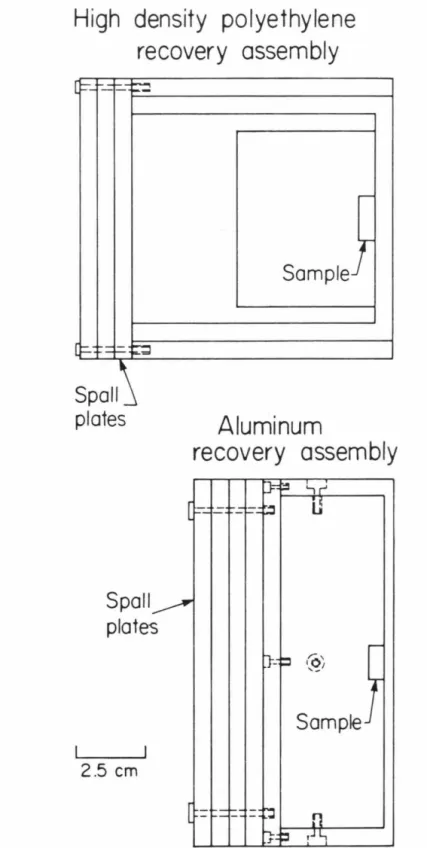
The water saturation was performed to simulate conditions present in the immediate subsoil of the test site. Lexan flyer sheets, 6.3 mm thick, were used to impinge specimens in all HDPE and in an aluminum unit.
High density polyethylene recovery assembly
Spall plates
Aluminum
Sample
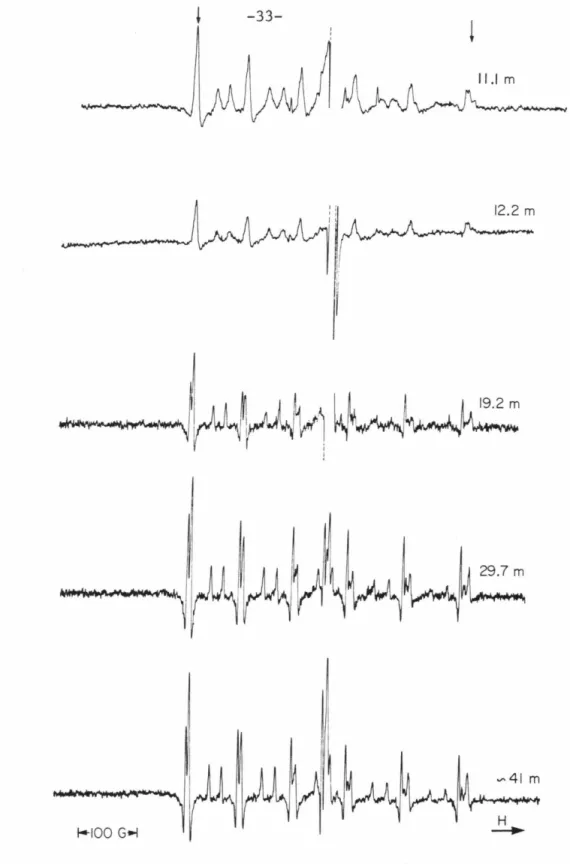
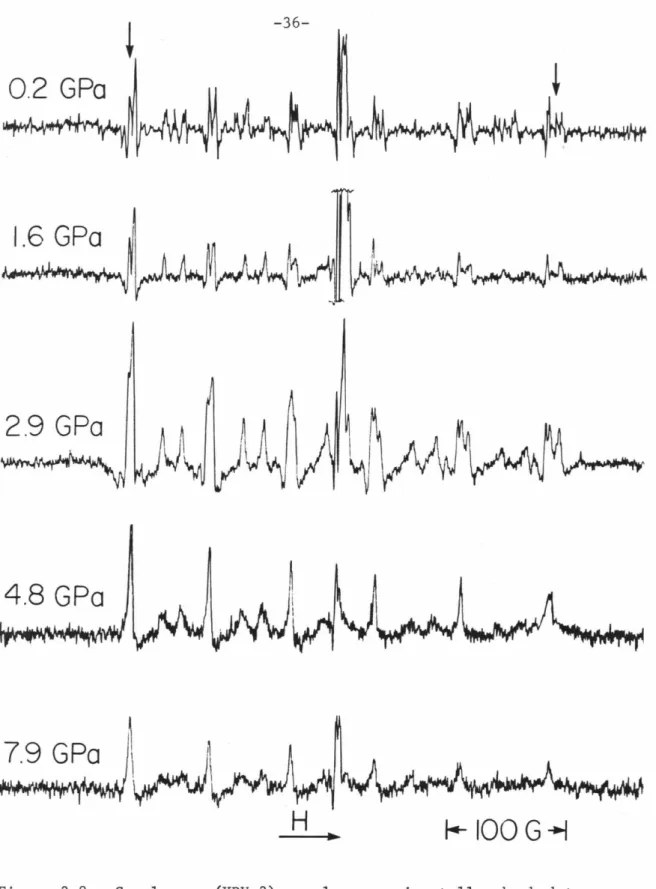
Note the consistent variation with depth in the splitting amplitude of the central transition hyperfine component peaks, especially the highest and lowest field peaks (indicated by arrows). Note the variation with pressure in the splitting of the central transition hyperfine component peaks.
DEFORMATIONAL MODES
MOSAICISM
STRAIN
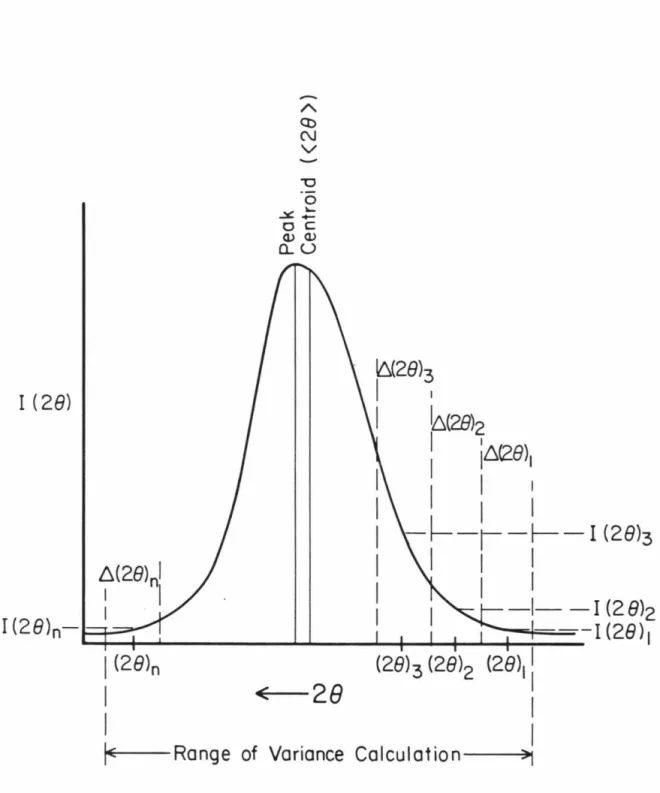
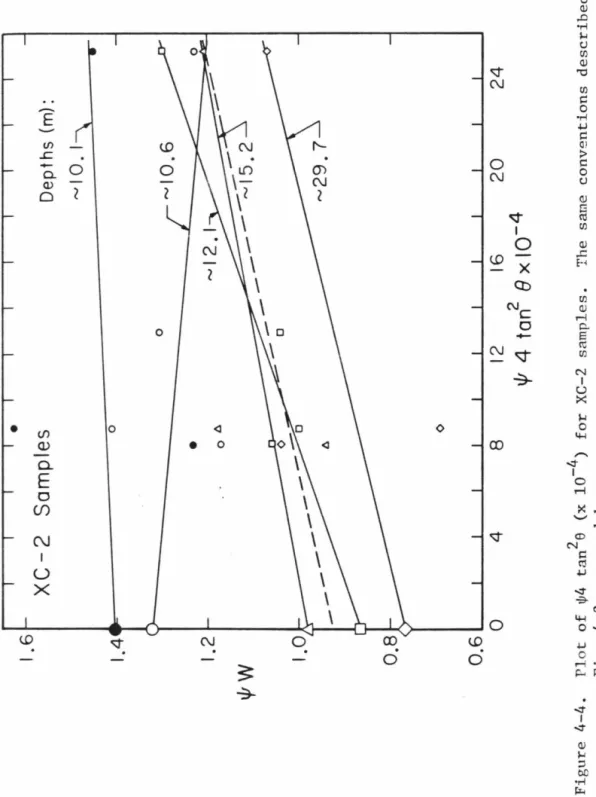
The Warren-Averbach (1950) method, using a Fourier series representation of the peak profile, allows to resolve magnitude and voltage effects based on a single reflection; The angular magnitude of the variance. the calculation was typically 1° 28, although the three samples with the highest lab shock had very broad reflections requiring a 1.5° 28. In this figure, the numbers in the right part of the graph indicate the experimental shock pressures in GPa; the mean fit to unshocked coral data (Fig. 4-5) essentially coincides with that to the 0.2 GPa shocked sample.
Therefore, when determining shock pressure versus crystallite size and strain curves, the porosity and initial grain size of the shocked samples being compared must be taken into account. Given the differences in the nature of the samples used and the experimental methods (thermodynamic paths in recovery and comparison of state-shock experiments differ slightly), these two pressure estimates can be considered to correspond to the same phase transition. As noted in Table 4-2, the crystallite sizes calculated for the shallowest XC-1 and XC-2 samples are comparable to those of the 4.4 GPa laboratory shock sample (350 to 350 to 4.4 GPa).
CRYSTALLITE SIZE
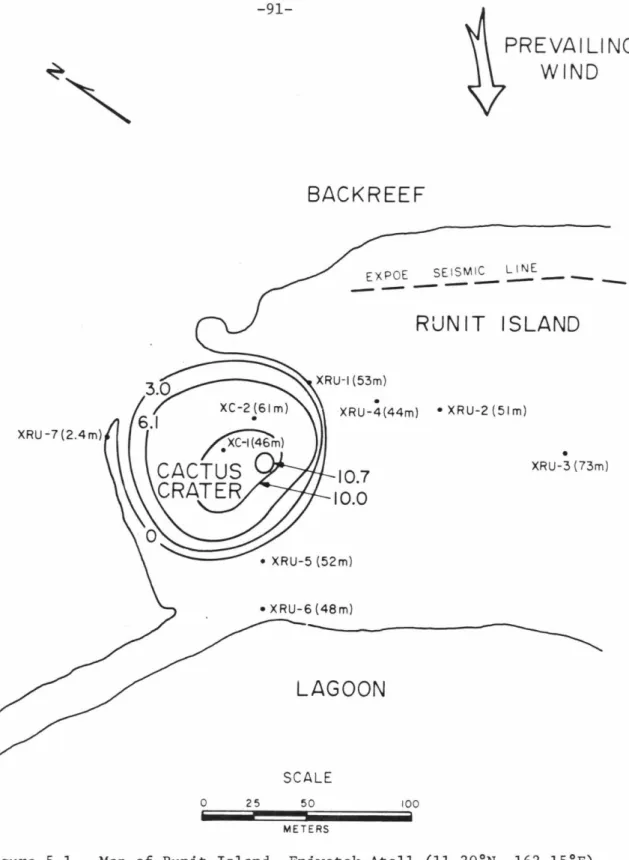
Using E = 90.7 GPa, v = 0.177 (from Simmons and Wang, 1971) and an aragonite density of 2.93 g/cc, a calculated strain energy of 1.4 X 10⁻³ kjoule/g for the most stressed 7.1 GPa laboratory shocked sample; this value is about 2% of the energy input in shocking the sample to this pressure, as calculated by Eq. This section presents important aspects of the mineralogy, formation, and alteration history of organically precipitated carbonate minerals. Map of Runit Island, Eniwetok Atoll (11.30°N, 162.15°E) showing well positions in the cratered (XC) and non-cratered (XRU) parts of the island.
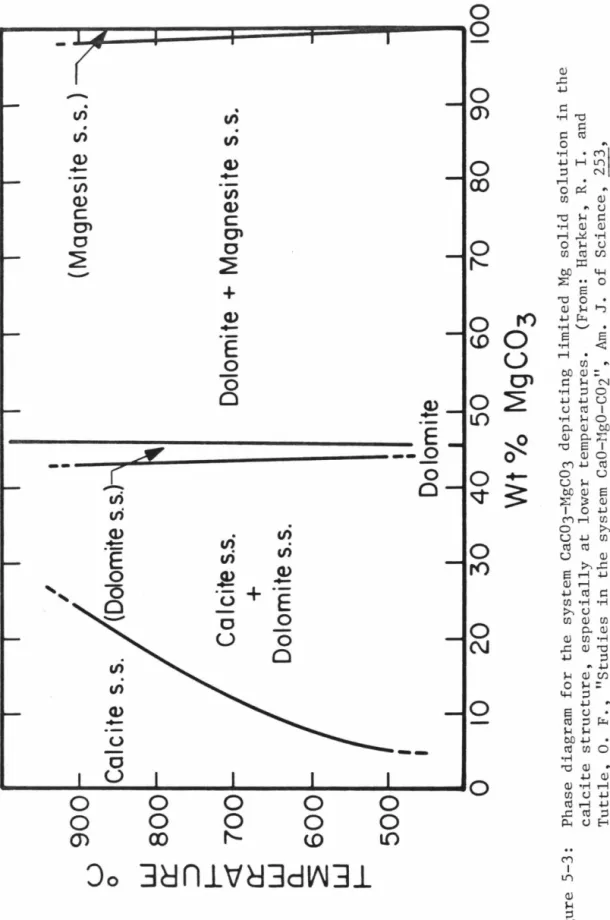
Calcite, on the other hand, undergoes a significant change in its major element, especially magnesium, in this interval, the chemistry, discussed below, and it is this diagenetic transition that serves as a stratigraphic control in the delineation of Cactus's structure. Crater. In that study, MgCO3 concentrations determined by chemical analysis were compared to X-ray diffraction spectra of the same samples. 5-2 indicate a continuous decrease in the (104)d spacing of the calcite lattice with increasing MgCO3, up to the.
High Mg calcite samples
Direction of Diagenetic Transition
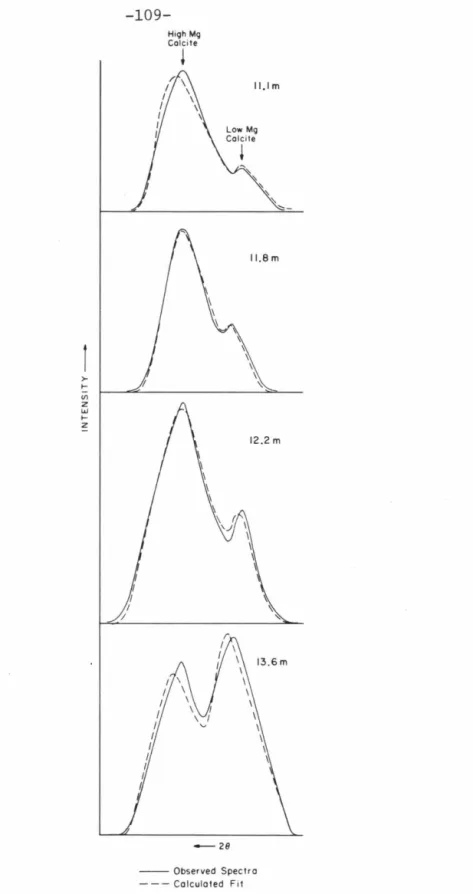
The significant observation to be made in the Runite core studies is the nature of the high- to low-Mg calcite transition. Both high and low Mg calcite X-ray diffraction peaks were observed in several samples from shallow (above 20 m) levels in the XC-1 and XC-2 cores. 5-5 show a similar pattern of consistently decreasing high Mg calcite and increasing low Mg calcite peak intensities.
-ray diffractometer spectra of these standard samples were then processed as described in the previous section, and intensities of the high- and low-Mg calcite components were obtained. Gaussian curve fitting parameters are listed in Table 5-2. The intensity of the high Mg calcite peak relative to the sum of high and low Mg calcite peak intensities is plotted against the known weight percentage of high Mg calcite in Fig. Due to the extremely low intensity of the high Mg calcite peak in the 1:9 standard sample, a satisfactory fit to the data could not be obtained.
From these values and equation (5-8), a theoretical curve can be determined between the fractional intensity of the high Mg calcite peak and its concentration. As previously described, the transition from high to low Mg calcite is a micro-dissolution process where texture is present. These variations in the microstructures of high and low Mg calcites may contribute to the deviation from the empirically derived values.
Whatever the feature of the high Mg calcite responsible for the discrepancy between the two curves, it is observed to be a feature of the high Mg calcite in samples of cores XRU-2 and 5 , and is therefore believed to be a characteristic of all high Mg calcite. . Calibration of XC-1 and XC-2 samples containing both high and low Mg calcite should therefore use the empirically determined curve. Specifically, information is needed on the nature and positional variation of the transition boundary from high to low Mg-calcite.
ENGEBI ISLAND
SCALE
OCEAN
The observed radiation pattern in Cactus Crater may be the result of the following sequence of events. This interpretation is consistent with the cratering model derived from Mg calcite transition data. Note, however, that the deepest point in the crater is located at an off-center location that is equidistant from XC-2 from the center of the crater, directly opposite the broken part of the island.
Where depth to the base of the breccia lens can be determined, the depth-to-diameter ratio of simple terrestrial craters is 1:3 (Dence et al., 1977). Using geological observations and subsurface geophysical data, Pohl et al. 1977) suggest that the transition cavity of Ries Crater had a similar depth-to-diameter ratio. In the Brent and Lonar lake craters, which were formed in granitic gneiss and basalt, respectively, the melt rocks are concentrated in the upper and basal parts of the excavated cavity (Dence, 1968; Fredriksson et al., 1973).
CRATER MODIFICATION MODELS
CENTRIPETAL SLIDING
REBOUND
The maximum depth of the excavation cavity is 20 m, and consequently the true ratio between the depth and diameter of the crater is 1:5. Most of the breccias filling the excavation cavity are of indigenous origin and the replacement breccia lens, if present, is limited to a maximum thickness of 1 m. The modification of Cactus Crater, based on the study of Mg calcite, is hypothesized to involve a mechanism of dynamic rebound rather than centripetal slip.
Some of the features observed in Cactus have counterparts in terrestrial impact craters and may have been produced by the same processes. Approximately 30% of known or probable terrestrial meteorite impact craters occur at least partially in carbonate rocks (Dence et al., 1977). Due to the irregular shape of the crystal sections used in the experiment, mass density determinations were not performed every time.
Further speculation about the higher pressure half of the aragonite Hugoniot and its relation to that of calcite will be presented in the next section. In addition, two of the zero pressure density values (recordings 393 and 494) are inconsistent with the partially released states. According to Davis (1964), calcite II is not an anion disorder, but a minor variant of calcite I.
The coincidence of a break in the Us-up slope with the intersection of the melting curve and. 8 represents the internal energy change with isentropic compression from the zero pressure density of the high pressure phase, p, to a given density. The numbers in parentheses refer to the transition energy, initial density, bulk modulus, and first pressure derivative, respectively, of the high-pressure phase values used in the high-pressure phase isentropy determinations.
INCIPIENT VAPORIZATION
According to these authors, internal instabilities of shock compression processes result in localized regions of intense deformation and extreme temperature gradients which may persist for some time after the shock wave has passed. Although it is difficult to assess the extent to which adiabatic shear processes and heterogeneous melting affect the Hugoniot results, their effects, at least in a qualitative sense, should be seriously considered in the evaluation of shock compression data. Experiments designed to further investigate carbonate, particularly calcite after decompression are described and the results presented in the next chapter.
Ringwood, Equations of state and crystal structures of high-pressure phases of shocked silicates and oxides, Reviews of Geophysics. Carter, Equation of state of solids from shock wave studies, in High- Velocity Impact Phenomena ed. This chapter presents the results of two equation-of-state experiments on single-crystal calcite.
Hypothetical Release Path
Polystyrene Foam
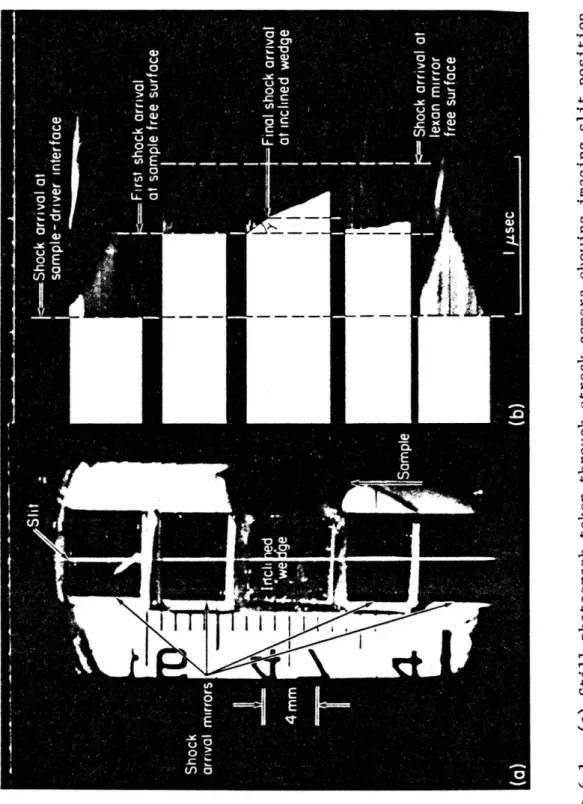
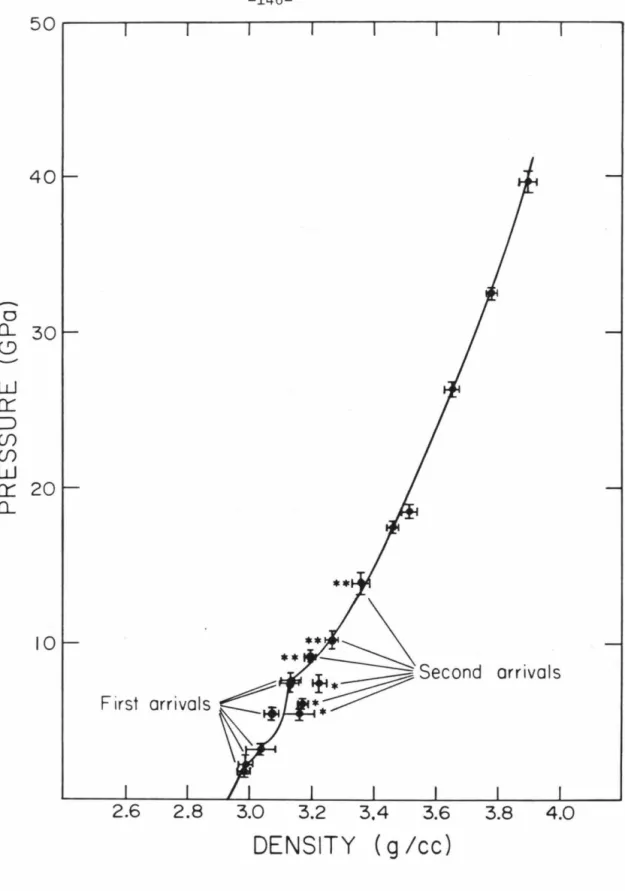
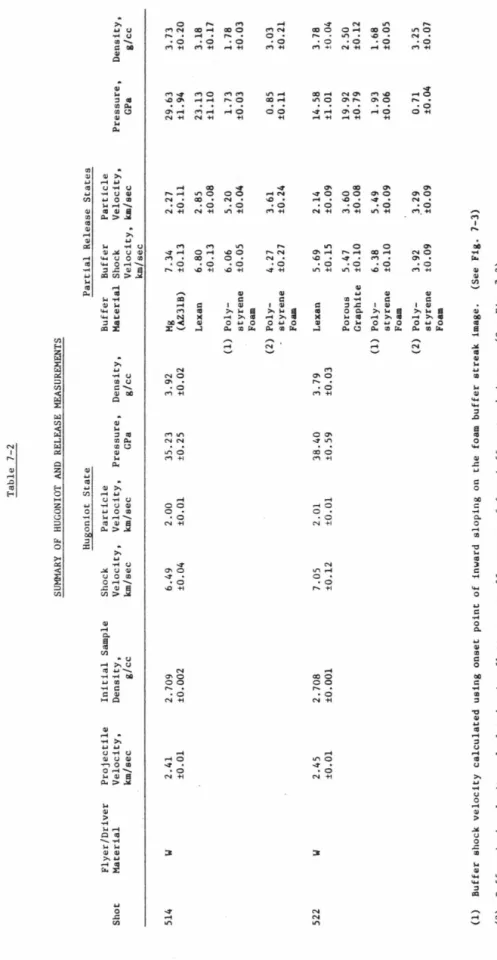
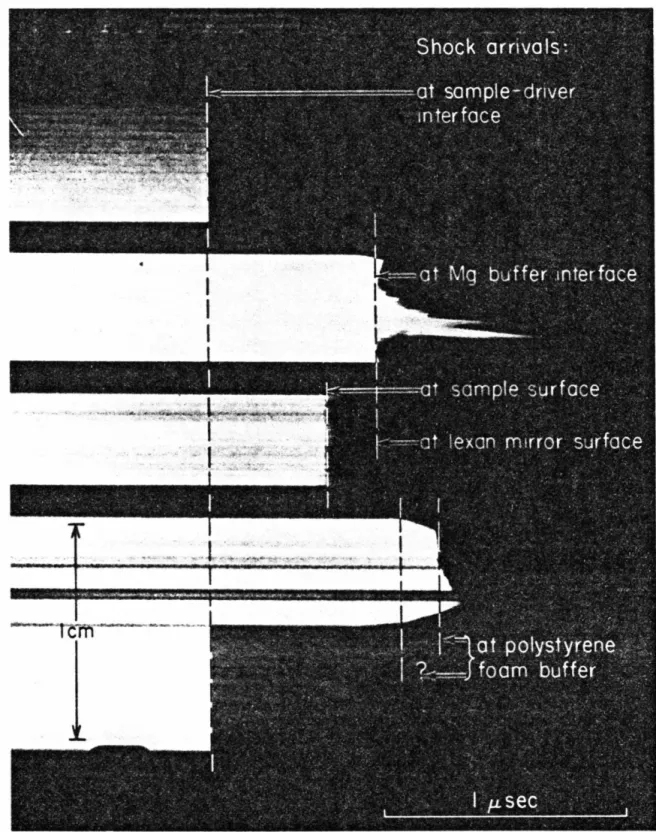
Measured densities and adjustments to the Hugoniot parameters are given in Table 7-1; magnesium and lexan density values are Archimedean, while polystyrene foam and porous graphite are bulk densities. The free surface velocity method, however, is not applicable to calcite release adiabat experiments because no inclined mirrors were used. Experimental results for calcite Hugoniot and partial relaxation states calculated using all buffer material data are presented in Table 7-2.
As discussed in the next section, some of the buffer data, particularly those values calculated using side-mounted buffers. The polystyrene foam values in this graph correspond to treatment (1) in Table 7-2; two different treatments of polystyrene foam data and reasons for preference. Buffer Data Source Po(g/cc) c. a) Received from Union Carbide Co., Chicago, IL (b) Received from Tempo Plastic Co., Burbank, CA. Table 7-2 HUGONIOT AND LAUNCH MEASUREMENTS SUMMARY Hugoniot Projectile Flyer/Driver State Partial Release States Sample Initial Impact Buffer Particle Firing Material Velocity.
DRIVER PLATE
ARRIVAL MIRRORS
Interpretations of the level release adiabats shown in this figure will be presented in the discussion section. All the partial release adiabat conditions determined in the two calcite experiments are listed in Table 7-2. This entire set of release data shows not only extreme overall scatter, but inconsistent partial release conditions determined in the same experiment.
More specifically, it is suggested that the discrepancies in the partial release states from the two calcite experiments are due to the. In addition, the same features were observed in the band recording from a Hugoniot equation of state experiment in polystyrene foam. The partial release states of polystyrene foam determined according to interpretation (1) are consistent with the results of porous graphite shot 514 and graphite shot 522 (both center-mounted buffers).
CaC0 3