In the 1830s, the American economist Henry Carey and the English banker James Gilbart debated the relative merits of the two countries' banking systems (see Sylla 1985). In the modern literature, for comparative discussions regarding later periods of the 19th century, see Lance E. Then, after a brief decline in the depression of the early 1840s, the number of state banks nearly doubled again by 1860.
By 1803, more than half of the government's debt and the Bank's stock, and fully half. A rough measure of the size of securities markets is the number of claims listed there. The Stock Exchange rate also provides enough information to make a rough estimate of the size of the English stock market in 1825.
This was likely a consequence of the United States taking the lead in chartered corporations, especially early period, limited liability banks. The increase in the real value of these assets reflects a wider use of the market economy. Any estimate of the money stock prior to 1850 must necessarily be based on sketchy and incomplete data.
England's population and economy was larger than that of the United States at the time, and the English economy was quite fully commercialized and.
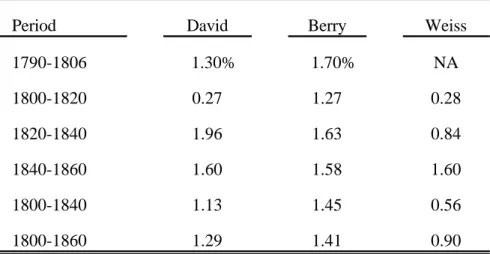
Indicators of Economic Growth in the Early U.S
Much of what is now known about the rate of growth of output (or income) in the US before 1840. Although the annual series is based on a statistical rather than a theoretical model and uses extrapolators that become less numerous as the series continues to decline, the results are broadly consistent with David's conjectures and may at least reflect fluctuations in the level of economic activity. His methodology averages the growth rates of a series of median extrapolators per year (using three series in the 1790s and six series after 1800) to calculate the growth rate of a "consensus pattern." The pattern is then linked to the Commerce Department's concept of annual GNP for 1876.
The broadness of existing GNI estimates, which largely reflect the dominance of agriculture in the early economy, makes it unlikely that their fluctuations reflect activity in the relatively small and presumably more productive "modern" sector. For example, the Panic of 1837 and the subsequent downturn do not cause a sharp drop in the series. Thus, GNI estimates may not indicate, but will not rule out, a "start" of the modern sector at some time before 1820.
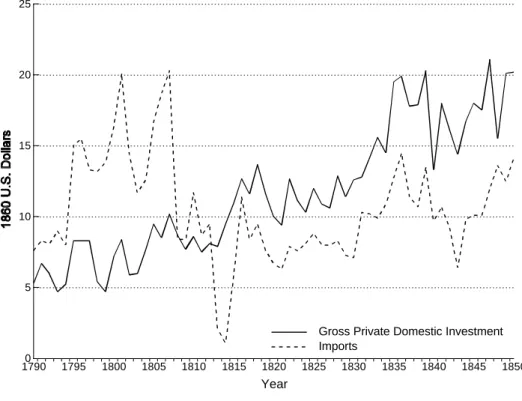
As a narrower concept, investment is likely to reflect developments in the modern sector more effectively than total output and responds to a financial sector capable of mobilizing savings. This series, presented in Figure VI, shows a strong rise between 1799 and 1807, a rise not nearly as pronounced in its GNP series, as well as similar increases in the War of 1812 era and in the decade after 1825. International trade data can still better reflect developments in the modern sector than broad aggregates such as GNP and investment.
These individuals recognized early in the country's history the potential of the corporate form of enterprise for promoting projects that would otherwise remain unstarted or stalled in development due to indivisibility and insufficient opportunities for risk diversification. Handlin (1945) and Pauline Maier (1993), have drawn attention to the peculiarity of corporate development in the United States after the Revolution. In the 1780s, as mentioned earlier in the text, Pennsylvania revoked its charter and then adopted a new charter for the bank after Delaware had granted it a temporary charter.
15 Given that the joint and non-financial corporations index are set to one in the initial year and have different growth rates, it is natural that the two sets occasionally cross. The relative importance of individual sectors in the non-financial series changes over time, during the first wave switchers and manufacturing companies dominate, and in the second, railway and mining companies. In the context of this study, where the focus is on the long-term effect of financial market development, we believe that the stock of ideas reflected in corporate rents, as it accumulates over time, could be related to the size and depth of financial markets (also measures of stocks) more than interannual fluctuations in the flow of creations.
Identifying Links Between Financial Markets and Early U.S. Growth
Real per capita measures of gross private domestic investment and imports substitute for output in the second set of systems. It involves estimating a separate regression equation for each variable on its own lags and those of the other variables in the system. However, the tests must be interpreted with caution, as a rejection of the null hypothesis as a statistical tool does not necessarily imply causality in an economic sense.
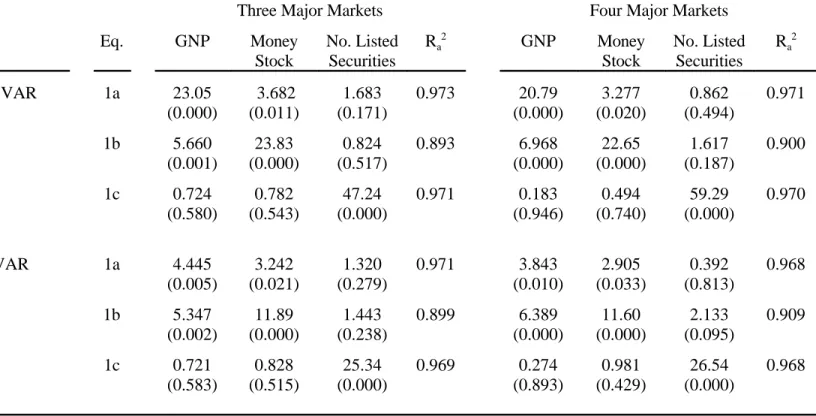
In particular, the validity of the tests is based on the inclusion of the entire information set in the VAR. Since this condition is violated in any finite regression framework, the results are presented below. The VAR system in the top panel imposes a single cointegration relationship and includes four lags.
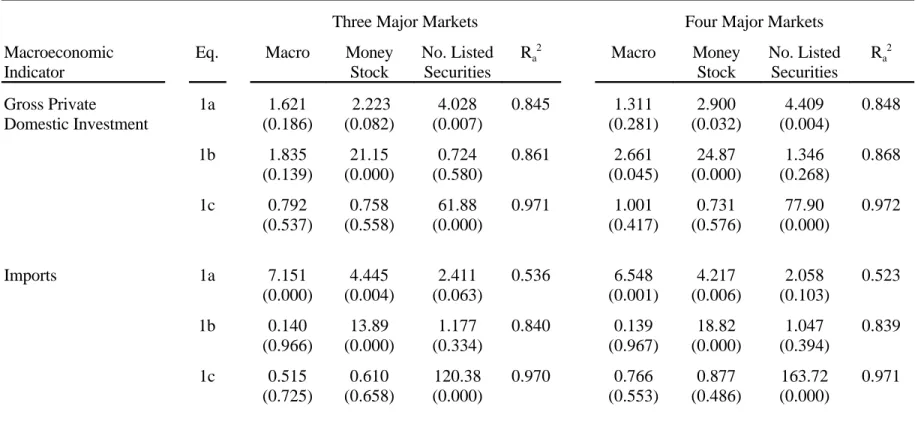
The results shown in the top left panel of Table IV indicate that the number of securities in three cities Granger causes investment at the 1 percent level, and that the money supply Granger causes investment at the 10 percent level, with no evidence of feedback from either the investment or the money supply, depending on the number of listed securities. Note: The impulse responses correspond to the system listed in the top panel of Table IV. For example, the upper left panel of Figure 7 percent after five years. or approximately $0.64 (base 1860) versus the sample mean of $11.29.
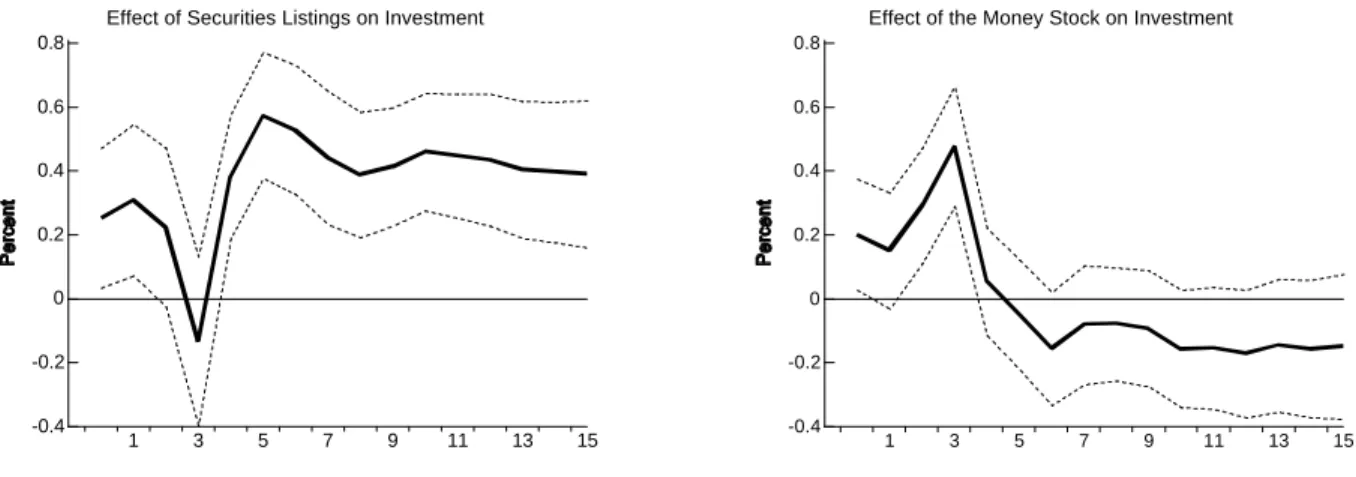
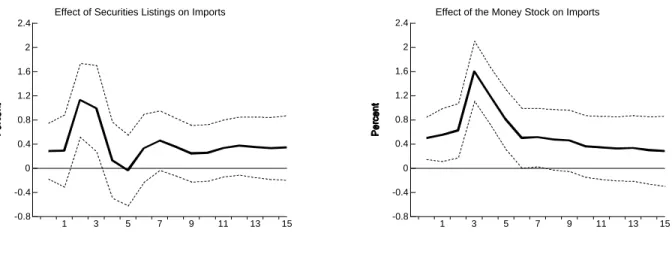
The right panel associates a 10 percent increase in the real per capita money stock, or about $0.90 from its sample mean of $8.98, with a 4.7 percent rise in investment after three years, or about $0 .53 from its sample mean. Specifically, the left panel of Figure XI relates a 10 percent increase in the number of listed securities to an increase in per capita imports of 11.3 percent after two years, or about $1.11 from its sample mean of $9, 84. The right panel relates a 10 percent increase in the real per capita money stock to a 16.1 percent increase in per capita imports after three years, or about $1.58 from its sample mean.
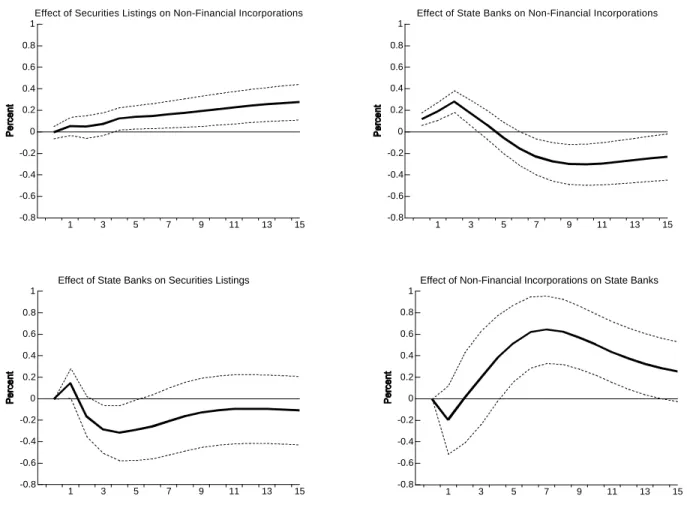
The impulse responses correspond to the system reported in the bottom panel of Table IV. Because the number of state-chartered banks is included in the total number of corporations, collinearity problems may arise in the systems shown in the top panel of Table V. For example, the left panel is associated with a 10 percent increase in the number of securities, or an increase of about 11.6 securities from the sample average, to an increase of 2.1.
The impulse responses correspond to the system reported in the lower left panel of Table V. In the right panel, a 10 percent increase in the number of state-chartered banks, or the establishment of about 22 new banks from its sample mean, is related to an increase in the index for non-financial companies of 2.8 percent after only two years.
Conclusion
We believe that the extraordinary economic growth of the United States is very likely "finance driven." According to the U.S. David, Paul A. and Peter Solar, "A Bicentennial Contribution to the History of the Cost of Living in the United States," Research in Economic History. Gallman, Robert E., "American Economic Growth before the Civil War" : The Testimony of the Capital Stock Estimates," in Stanley L.
Martin, Joseph G., Seventy-Three Years History of the Boston Stock Market (Boston: Published by the Author, 1873). Osterwald-Lenum, Michael, Annotation with fractiles of the asymptotic distribution of the maximum likelihood cointegration rank test statistic: four examples. Bureau of the Census, Historical Statistics of the United States, Colonial Times to 1970 (Washington, DC: Bureau of the Census, 1975).
Wettereau, James O., Statistical Records of the First Bank of the United States, edited by Stuart Bruchey (New York: Garland Publishing, 1985). Our measure of the broad stock of money sums up the total liabilities of banks to the public and personal amounts in the hands of the public. On the strong assumption that the amount of bills discounted by the few chartered banks during this period fluctuated similarly to the liabilities of the Massachusetts bank to the public and staff, we then use the ratio of the capital of the Massachusetts banks to the total bank capital of the United States each year, to “blow up” bills and discounts to a national level.
The 1985 reprint of James Wettereau's Statistics of the First Bank of the United States contains observations for specie holdings, notes in circulation, individual and government deposits, notes of other banks, and balances due to and from other banks at (or around) the end of every year from 1792 to 1801 from balance sheets of the BUS. Temin obtains official estimates of species in public hands from 1830 and uses net species flow to extrapolate the range back to 1820. From this range for species stocks we subtract species holdings by state banks (constructed with Fenstermaker's data as above) and species in the first BUS to obtain an estimate of species in the hands of the public.
We further test for cointegration in each of the ten VAR systems we consider. In the three-variate case, a single cointegrating vector also implies that the system error terms are stationary. Rejection of the null hypothesis of no cointegration ® = 0) coupled with failure to reject the null of at most one .. cointegrating vector ® = 1) provides evidence of a single long-run relationship in a given system.
This result is achieved in all but the first two systems with rejections of the r = 0 hypothesis at the 10% or less level. Johansen regressions also facilitate the test of stationarity of variables in those systems for which the number of cointegrating vectors is clear.