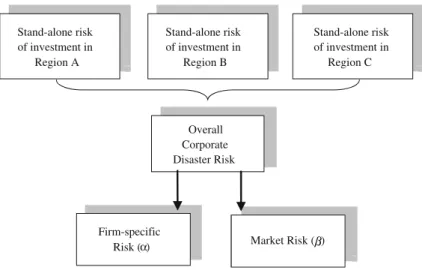
Finally, we discuss the use of business scorecard analysis in the context of enterprise supply chain risk management. Internal risk management is the most direct responsibility of the supply chain organization and its participants. This chapter discusses the importance of risk management in the context of supply chain management.
The financial world is not immune to systemic failures, as evidenced by many stories such as the collapse of Barings Bank in 1995, the failure of long-term capital management in 1998 and a handful of bankruptcies during the current financial crisis, e.g. the government takeover of Fannie Mae and Freddie Mac and the fall of Lehman and Merrill Lynch. For example, in the financial sector, volatility clustering has been observed in many markets by referring to the observation that “large changes are usually followed by large changes of any sign, and small changes are usually followed by small changes.” The characteristics of complexity mainly indicate that individual characteristics can evolve into group characteristics and vice versa. Firm value at risk=f (hazard, vulnerability) (1) From Eq. 1), the value of the firm at risk from natural phenomena is a function of hazard and vulnerability.
Like all governments, the U.S. government devotes significant effort to developing its ability to respond to emergencies.8 The U.S. Department of Homeland Security also has systems in place, including their Critical Infrastructure Protection Decision Support System (CIPDSS).9 A common theme is that we are never adequately prepared, yet society can deal with it, and no matter how successful the responses, critics abound.10. Earthquakes have also had significant political consequences (for example, the 1972 Managua, Nicaragua earthquake is credited with sparking the Sandinista Revolution due to inadequate government relief responses). It's not a perfect science; the purpose of data mining is to gain small benefits, because perfect predictions are impossible.
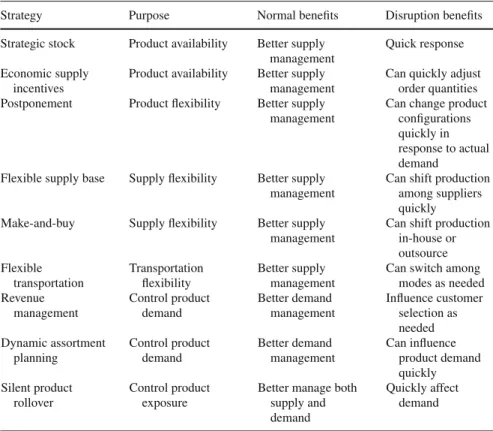
Objective – the preferred direction of movement on a given value metric. Attribute – a measurement dimension. We can start looking for common values, using the input from published sources in Table 7.1. The first focus is on the purpose of the company: the product.
Blackhurst et al. (2008)
We came across five recent cases in supply chain risk management that applied Analytic Hierarchy Process (AHP) models. This approach can provide similar results from simple multiattribute utility models, a linear form of multiattribute utility theory. In this chapter, we review these four cases, taking the original AHP input data and constructing a SMART model, an implementation of value analysis.
Supplier1 is the best in many disaster factors, including fire, flood, labor, supplier bankruptcy, and war and terrorism. Supplier4 is the best in four quality factors, while Supplier3 is the best in three. In this data, supplier1 dominates supplier2 (it is better on all 13 criteria), which means that supplier2 could be rejected.
Note that Supplier1, Supplier3 and Supplier4 all score relatively high, and it would be wise to keep all three under consideration. Supplier2 would probably be eliminated if the decision was to choose one (or more) suppliers.
The original article (Wu et al.) only provided supplier risk scores for the first ten criteria, so that is all we use in this presentation. In Wu et al. high scores represented a risk—we reverse it here so that high scores infer an advantage.). As in all these cases, the original article presented a hierarchical development, but we focus on SMART analysis, which focuses on the lowest-level criteria that form the value function.
Kull and Talluri (2008)
In this case, supplier A scores best, despite deficiencies in its ability to manage material availability risks, on the criterion with the highest weight, where alternative suppliers had different scores. Given that we forced the best score to be 1.0 for each criterion, each supplier's final score can be considered proportional to the ideal. In this case, there were clear differential performance ratings and each of the three supplier candidates had a relative advantage.
Some criteria did not matter in this particular decision (stable currency, quality management, research capabilities) because all alternatives had the same performance score. Interestingly, it includes the top and bottom ranking of the 14 criteria, so this assessment demonstrates that it is not a matter of importance, but context. Supplier A had the highest value score, despite disadvantage on material availability, cost management and information systems.
Relocation could probably overcome risks in the form of natural disasters (and stability of the supply market) and could require expensive investments to improve capacity constraints.
Schoenherr et al. (2008)
These are commensurate with the normalized additives reported by Schoenherr et al., and indicate the advantage of being able to source finished products from China. China had a big advantage because it had the best performance in the two most important measures of product cost and product quality (measured by defect rate). It was weakest in the factors of foreign risk, demand risk, natural disasters/terrorism, on-time/on-budget delivery and supplier management.
The first and third are probably best handled by insurance (the cost of which should be included in product cost, possibly revision of ratings). Action can be taken to improve on-time delivery and supplier management through training or business process redesign.
Gaudenzi and Borghesi (2006)
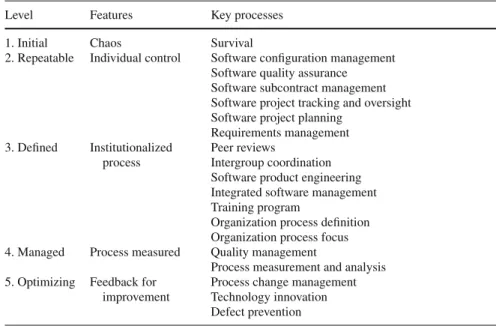
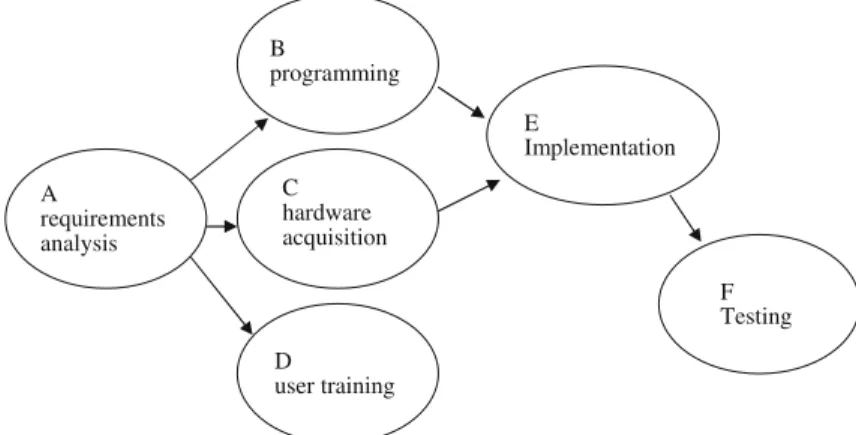
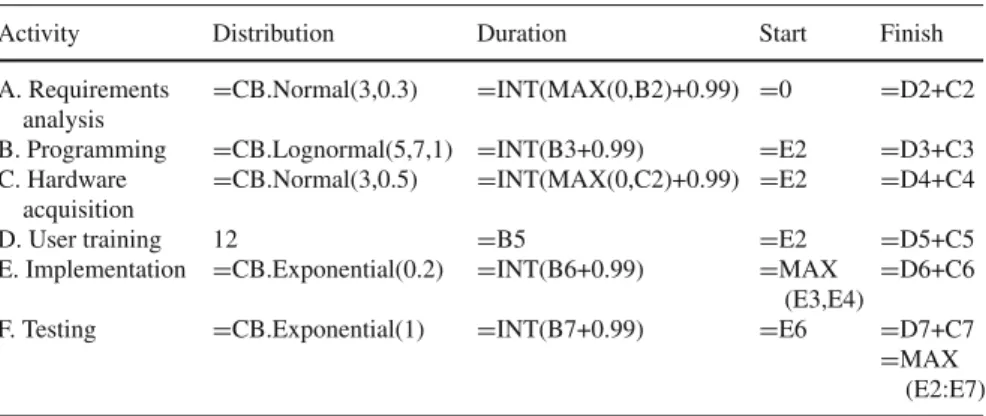
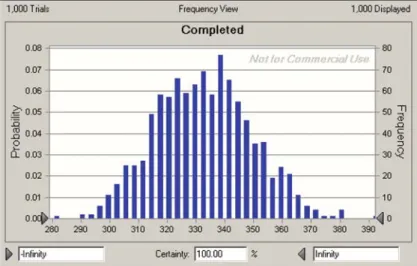
In most inventory models, the cost of materials is the same regardless of the quantity purchased; in this case procurement costs can be ignored. 118 9 Simulation of Supply Chain Risk Profit and shortage are calculated to the right of the base stock model. A continuous simulation model defines equations for relationships between state variables, so that the dynamic behavior of the system over time can be studied.
The central limit theorem can be shown to have effect, since the sum of the five retailer deficits has a normally shaped distribution. Value at risk (VaR) is one of the most widely used models in risk management. However, this violates the generally accepted subadditive rule; that is, the portfolio VaR is not smaller than the sum of component VaR.
The same is the case if α is set to too high a value (for the same reason – the possible region shrinks). In the investor's decision problem (1), the quantity rp to be maximized is a random variable because rpi is a function of the individual securities' rrandom variables. These weights also reflect the scale (here the range for Cost was 60, and for Lost Lives was 110, while the range for the other two criteria was 100 – in this case this difference is small, but the scales need not be equal. The more disparate, the more skewed the weights.) For the other six dominated solutions, no set of weights would make them so possible.
If we weighted the intervals all equally (divide the cost results in Table 12.2 by 0.6, the expected loss results by 1.1), the resulting weights would represent the implied relative importance of each criterion that would yield a solution not dominated. One of the ERM areas of global business that involves high levels of risk is global supply chain management. The parameter λ =1 states that the DM is completely optimistic about the entire maximum value (delegate the maximum possible return).
A fuzzy mean-variance portfolio selection model selection model can be easily obtained by combining mean-variance portfolio selection model and mean-variance portfolio selection model selection model and replacing the exact numbers with fuzzy numbers, e.g. the trapezoidal fuzzy number or triangular fuzzy number. . Suppose the investor invests in n securities, where the weight of the ith (in n) security is xi, then the risk of the portfolio of these securities is . For example, based on probability theory, assume that the mean and standard error (S.E.) of the first security are μ=18% and σ =3%.
Examples are shown by demonstrating the implementation of the feasible mean-variance-security-first portfolio selection model. The spread of data about the means is captured by the variances in the denominator.