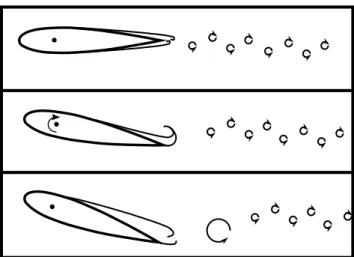
The flapping vane resulted in a continuous coil in the test section, while the flow of the foam sheet only temporarily disturbed the flow. Each of the potential flow methods with wake models provided reasonable estimates of this lift.
NOMENCLATURE
INTRODUCTION AND BACKGROUND
- Introduction
- Gusts in the Wild
- Theoretical Unsteady Aerodynamics
- Studies of Gusts and Unsteady Aerodynamics
- Modeling Freestream Unsteadiness with Body Motion
- Classical Unsteadiness
- Gust Response and Control
- Vortex Interaction
- Summary
Jones et al examined the behavior of the leading edge vortex on rotating wings with finite aspect ratios. Overall, they found that separation distance had the strongest influence on vortex behavior.
ANALYTICAL MODELS AND SIMULATIONS
Introduction
Thin airfoil theory models
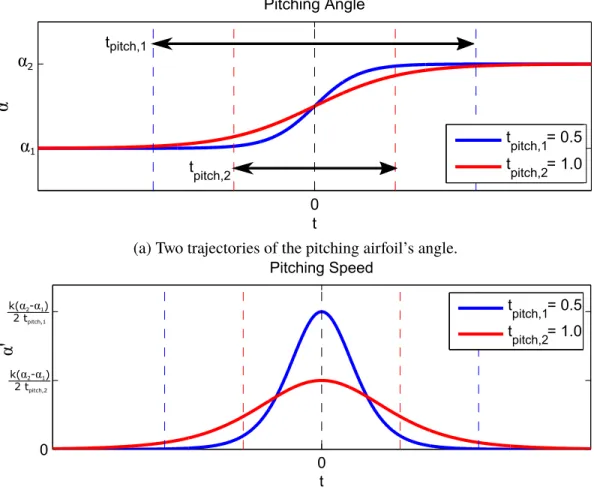
- Pitching Airfoil
- Heaving Plate
- Point Vortex Model of Airfoil-Vortex Interaction
The dotted line is the path of the vortex as it moves across the airfoil. This indicates that the circulation of the shed vortex should scale linearly with the lift speed and plate chord length.
Extension of Tchieu-Leonard unsteady airfoil model
- Tchieu-Leonard unsteady airfoil model
- Extended Tchieu-Leonard model
As before, its maximum buoyancy is proportional to the distance y to the airfoil. In contrast, the lift due to bound vorticity is proportional to the square of this distance.
Unsteady Panel Methods
- Background
- Equations of the Vortex Panel Method .1 Vortex Panels.1Vortex Panels
- Determination of Panel Strengths
- Panel Method Simulations
- Pitching Airfoil
- Heaving Plate
- Airfoil-Vortex Interaction
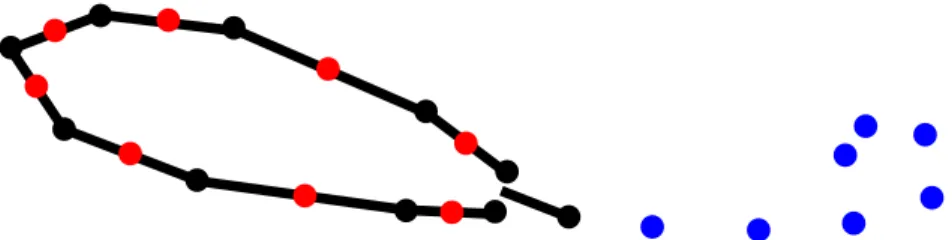
The black lines are the panels that define the body and the start of the wake. At each time step, a new wake element is created near the trailing edge of the airfoil.
Comparison of Analytical Models and Simulations
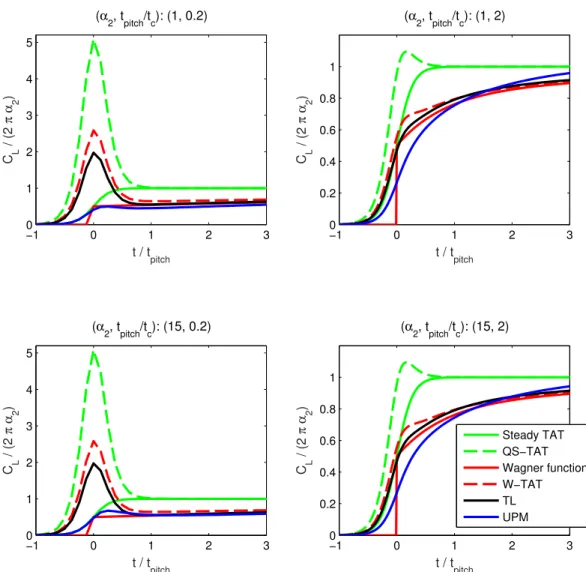
- Pitching Airfoil
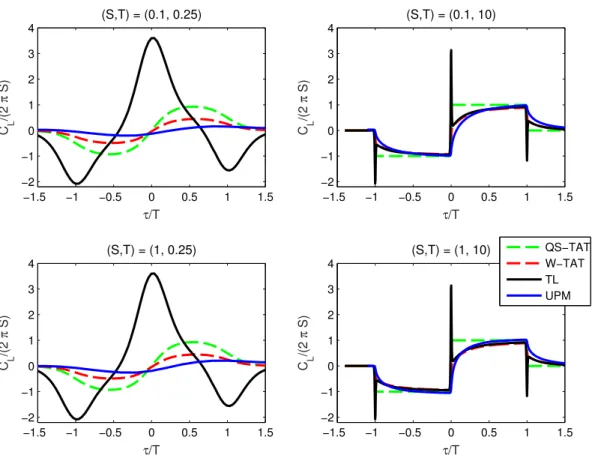
- Heaving Plate
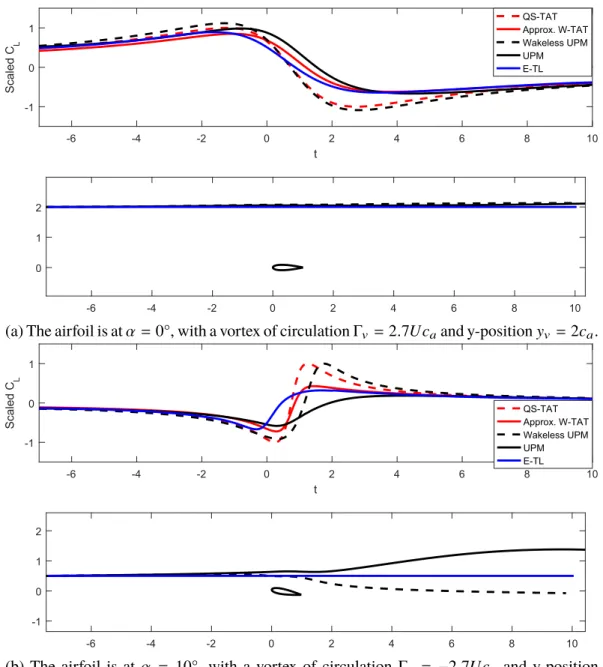
- Airfoil-Vortex Interaction
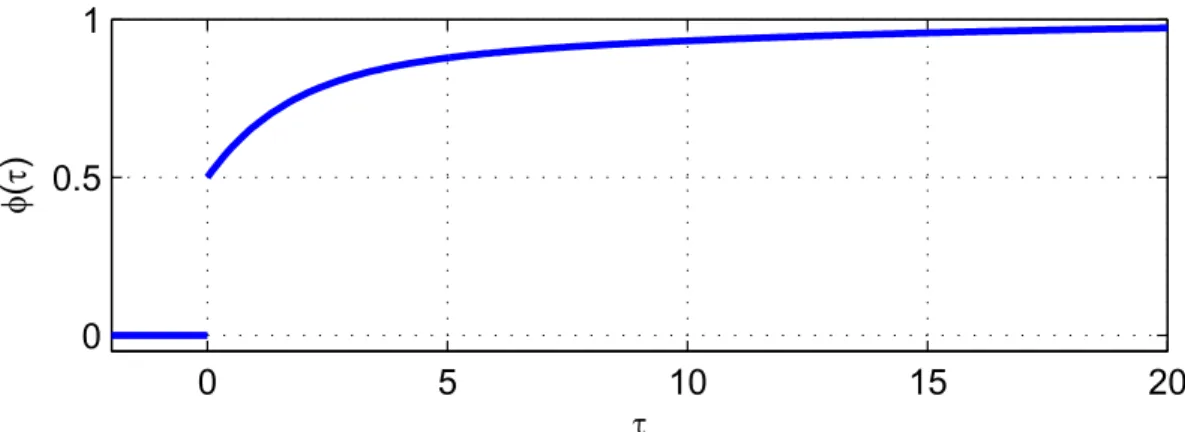
This is expected since each of the other models is linear with the angle of incidence. With the lower speed, all wake modeling methods are similar to the Wagner function.
Summary
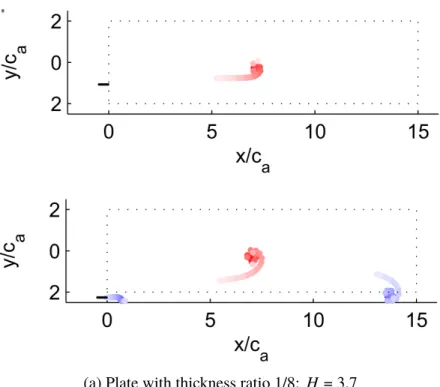
Part of the reason for the disagreement can be seen by examining the paths of the vortices. The bottom plot in each pair shows the paths of the simulated vortices as they move through the airfoil.
Introduction
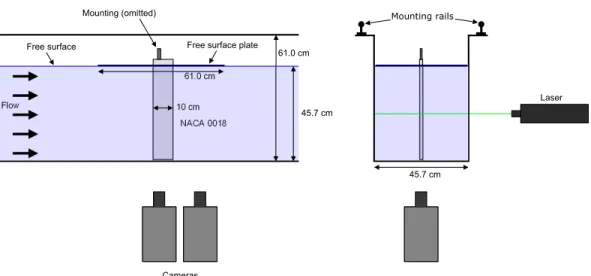
NOAH Water Tunnel
Particle Image Velocimetry
Except for the experiments investigating the three-dimensionality of the flow, the jet was extended to a plate in the x−y plane of the tunnel, at the z-center point of the test section. In those exceptions, the beam was extended to a plate in the x−z plane, at the y-center.
Static Airfoil
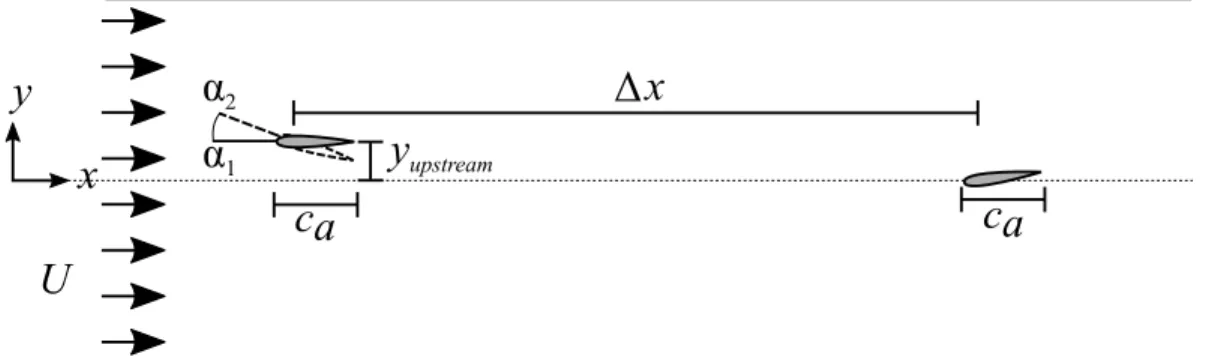
A Newport 481-A rotating table was mounted between the force transducer and the airfoil, allowing precise manual control of the airfoil's angle of attack. The use of a significantly longer distance was not feasible due to the finite length of the test route.
Dynamic Airfoil
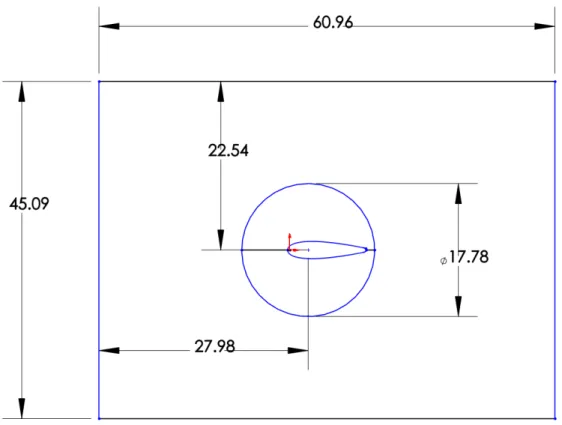
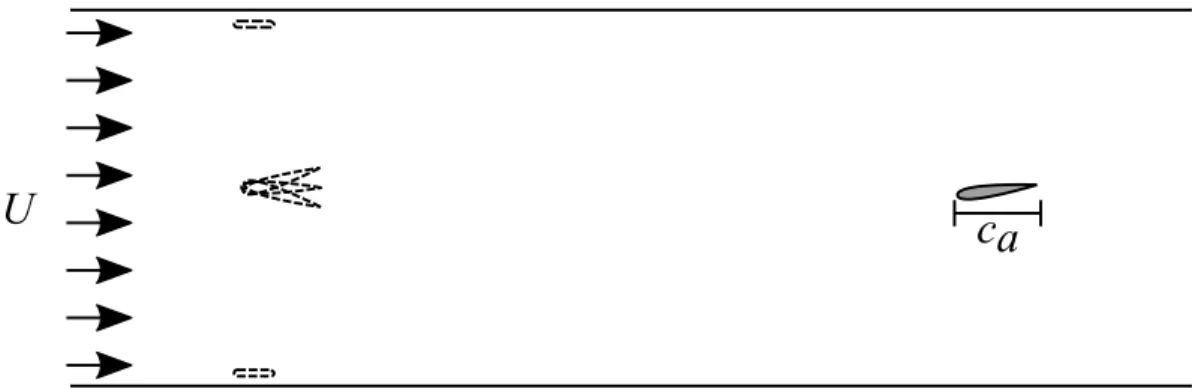
If necessary, the airfoil was mounted 75 cm downstream of the gust generation system to measure the effects of the gusts. The circular part allows rotation of the wing profile, which passes through the wing-shaped hole in the center.
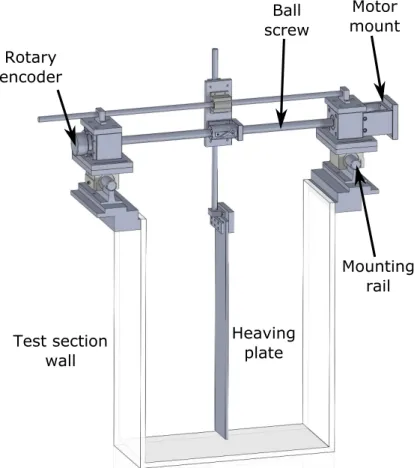
Heaving Plate Apparatus
A scheme of the foam sheet's relative location in the NOAH tunnel is shown in Figure 3.8. When used, the accumulation plate was mounted with its centerline 75 cm upstream of the test article's quarter chord.
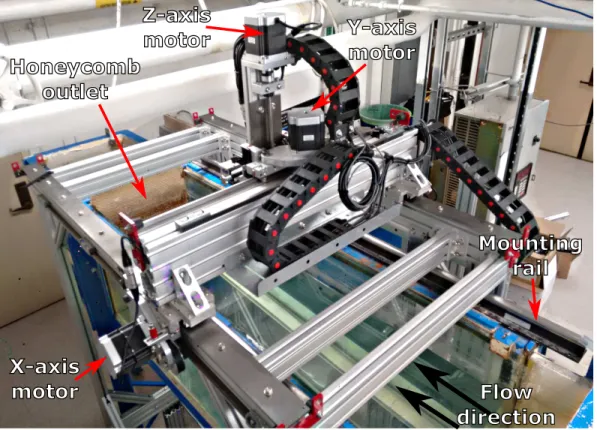
Gantry System
Summary of Experiments
The distance from the test article was ∆x = 75 cm. a) Model of the first mechanism for the lifting plate.
GUST GENERATION
Introduction
Analysis Techniques
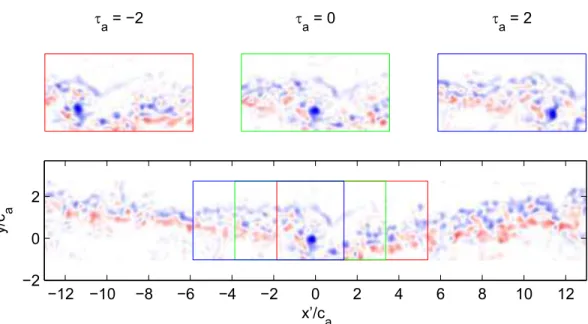
- Gust Unwrapping
- Vortex Identification
The Γ2 function provides an estimate of the location of the center of the vortex: the point with the maximum magnitude of Γ2. This was necessary due to errors in the calculated velocity fields and variation of the flow over time. This chapter also compares how well the theoretical values of the circulation match the experimental measurements.
The de-position of the vortex is reported in a similar way using the distribution of identified vortex center locations.
Experimental Generation of Gusts via Pitching Airfoil
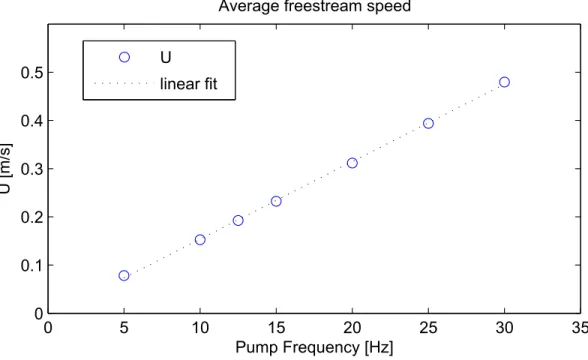
- Perturbation of Freestream
- Characterization of Gusts
- Three-dimensionality of Gusts
- Discussion
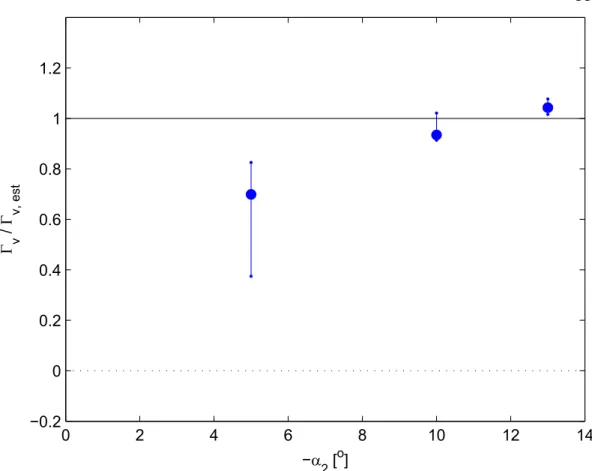
The upper airfoils are shown to scale at both angles on the left. The Γ2 function did not successfully identify the vortex from the α2 =-5° experiments in many frames. This was probably due to the flow around the airfoil adjusting to the new angle.
In Figure 4.8, the PIV plane was not exactly in the plane of the vortex centerline.
Experimental Generation of Gusts via Heaving Plate
- Perturbation of Freestream
- Passing Plate
- Flow around the Heaving Plate
- Effects of H and T
- Three-dimensionality of Gusts
- Discussion
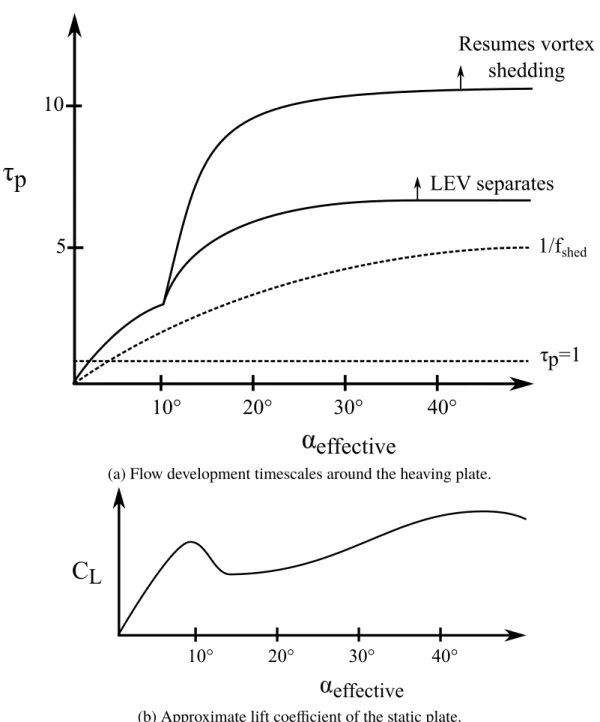
The flow behavior around the riser plate can be divided into phases as shown in Figure 4.13. The normalized circulation of the primary vortices is shown in Fig. 4.24 as a function of plate rise time. The flow around moving plates can be analyzed through the lens of the plate's effective angle of incidence, αe f f = arctan(S).
This starting vortex can be seen in figure 4.22 in the upper right edge of the field of view.
Comparison of Gust Generation Methods
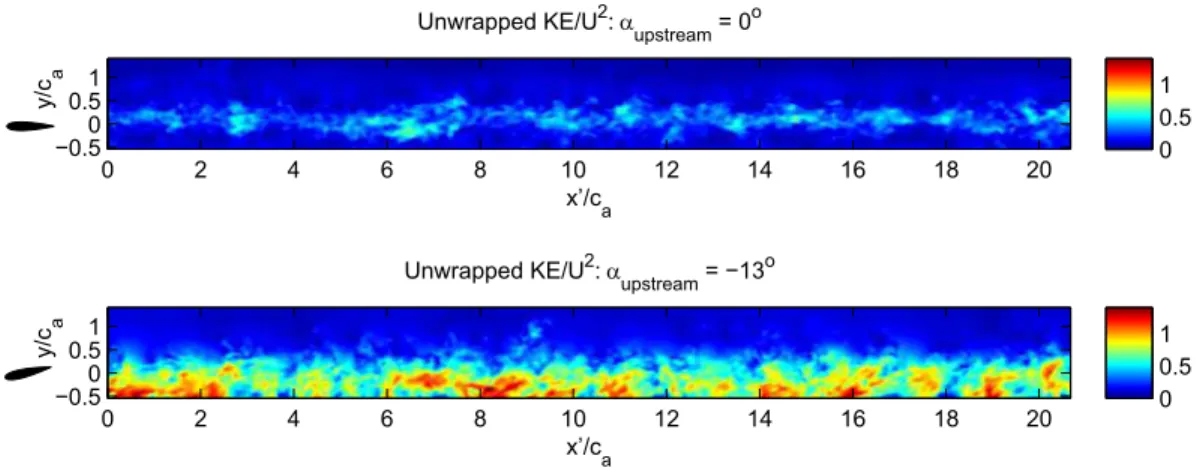
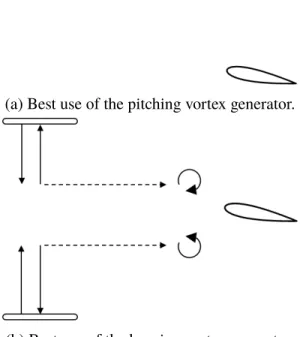
The vortex shed by the airfoil rising at -5° is barely distinguishable from the background flow instability. Other vortices shed by the lifting airfoil are very compact in space compared to those of the lifting plate. Device wakes can be more easily compared on the kinetic energy graph.
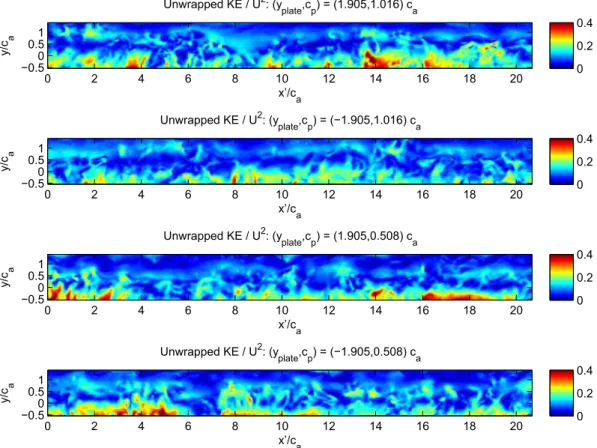
In contrast, the line of the raised slab left the field of view, and thus was no longer disturbing the flow around the centerline of the tunnel.
Summary
The plots shown have not been scaled with respect to the chord lengths of the two units. 7, the wake of the dynamic airfoil at -13° had reached the intensity of the static airfoil at the same angle. In contrast, the wake of the heaving plate left the field of view, and therefore no longer disturbed the flow around the centerline of the tunnel. a) Time scales for flow development around the raised plate.
These are those averaged over unwrapped bursts, for normalized values of horizontal velocity, transverse velocity, vorticity, free-stream removed kinetic energy, and enstrophy.
GUST-WING INTERACTION
Introduction
Experimental Apparatus
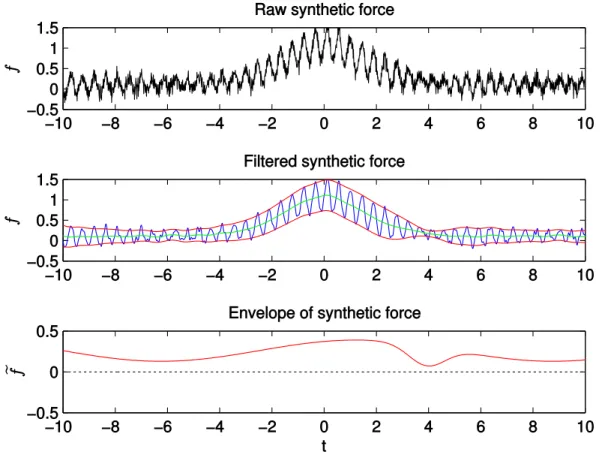
The middle plot shows the denoised data in blue, the underlying low-frequency forces in green, and the force envelope in red. An additional problem with forces is that the small magnitude of the drag force, D, on the lower airfoil meant that its direct measurement was inaccurate. Another option was the estimated drag force, Dest, calculated by dividing the drag moment by the distance between the transducer and the midpoint of the wetted span.
A similar process was used for direct and indirect lift measurements: L and Lest, respectively.
Baseline Forces
- Static Gust Generators
- Forces due to a passing plate
- Discussion
The presence of the upstream plates did not appreciably change the average forces on the test article. For comparison, Figure 4.10 shows the untwisted flow of the plate moving in the negative direction. The slab's wake probably merged into the boundary layers at the sides of the test section.
These small effects did not modify the forces in the underplane at the tunnel centerline.
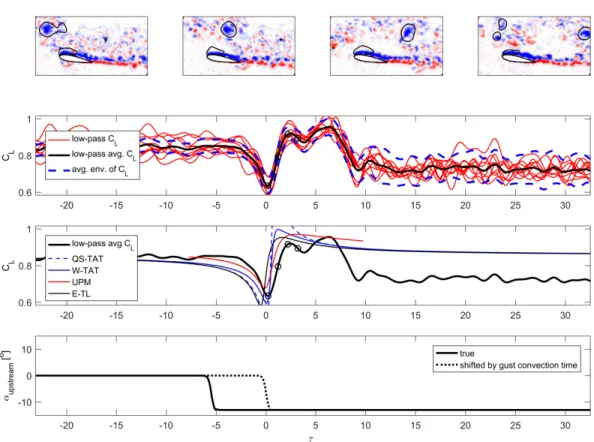
Interaction with Pitching Airfoil Gusts
- Experimental Results
- Comparison with Theory
- Discussion
The Y position of the upstream airfoil had a significant influence on the flow around the test article. Here, the y-distance of the vortex from the airfoil was estimated as the y-position of the quarter-chord point of the pitching airfoil. The aforementioned area of additional vorticity was likely due to the development of the flow around the upstream airfoil.
Afterwards, the viscosity and the change in the flow due to the wake of the gust generator made the estimates less accurate.
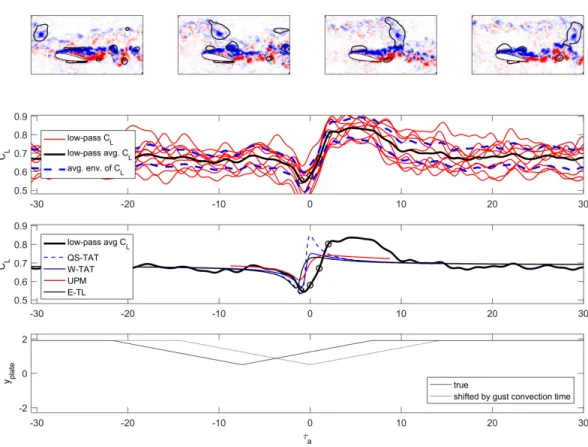
Interaction with heaving plate gusts
- Experimental Results
- Comparison with Theory
- Discussion
In experiments where the heaving plate passed the centerline of the tunnel, the plate's track passed through the airfoil twice. The other factor in the variation of the forces was the track of the plate. Here, the y-position of the vortex was estimated as the peak position of the heaving plate.
These forces were related to two factors: the primary vortex and the plate wake.
Summary
The raised plate also produced a wake which significantly interfered with the test article if the plate moved past the position of the test article. In contrast to the use of the pitching aerofoil, the retraction of the raised plate to the edge of the tunnel meant that the flow around the test article returned to its previous state. The speed deficit in the wake of the generators probably had an effect as well.
The persistent airfoil wake permanently altered the flow around the test article, whereas the raised plate wake significantly interrupted the flow temporarily.
CONCLUSION
Summary
Lift on the airfoil generally followed the trends predicted by simple airfoil theory models, unless the wakes of the generators were significantly perturbed. Having the canted airfoil close to the centerline of the tunnel also reduced coherent vortex shedding from the test article when it was at moderate angles of attack. When the airfoil was at α= 0°, the forces rapidly approached their final state, on a time scale of 5-10 tc, similar to the Wagner function.
When the wakes did not significantly disturb the test object, the theoretical models provided reasonable estimates of the initial lift peak.
Future Work
BIBLIOGRAPHY
Parametric viscous analysis of gust interaction with SD7003 airfoil. 48th AIAA Aerospace Sciences Meeting, including the New Horizons Forum and Aerospace Exposition. Transient aerodynamics of large transverse gusts and geometrically similar maneuvers. 54th AIAA Aerospace Sciences Meeting. The influence of wing kinematics on the formation of leading vortices in bio-inspired flight.
Low Reynolds number wing response to an oscillating freestream with and without feed forward control. 47th AIAA Aerospace Sciences Meeting Including The New Horizons Forum and Aerospace Exposition.
DESCRIPTIONS OF EXPERIMENTS
- Introduction
- Static Airfoil (SA) Experiments
- Experiment SA-1
- Experiment SA-2
- Experiment SA-3
- Experiment SA-4
- Experiment SA-5
- Pitching Gust Generator (PGG) Experiments
- Experiment PGG-1
- Experiment PGG-2
- Experiment PGG-3
- Heaving Gust Generator (HGG) Experiments
- Experiment HGG-1
- Experiment HGG-2
- Experiment HGG-3
- Experiment HGG-4
- Experiment HGG-5
- Experiment HGG-6
- Experiment HGG-7
- Experiment HGG-8
- Experiment HGG-9
- Experiment HGG-10
- Experiment HGG-11
The forces on the airfoil were measured with a 5 cm plate 75 cm upstream, near the side of the tunnel. To compensate for the forces due to rotation of the test rig, the forces on the zero-flow sensor were measured in five-degree increments from -5° to 15° inclusive. To compensate for the forces due to rotation of the test rig, the forces on the zero-flow sensor were measured at each angle of incidence.
The PIV plane was 75 cm downstream of the plates, in the x − z (stream-vertical) plane at the center line (y=0) of the tunnel.
DERIVATION OF EXTENDED TCHIEU-LEONARD UNSTEADY AIRFOIL MODEL
Introduction
Conformal Mapping
- Lifting Cylinder at Angle α
- Rotating flat plate
- External vortex
- Wake vortices
The vorticity on the plate, γ(x), is needed for the calculation of different moments used in the Tchieu-Leonard model. In Tchieu's analysis, the external vortices were in the track, which was constrained to lie on the half-line behind the plate. The position of the external vortex is z0v =r0veiθ0v in the original frame and zv in the transformed coordinates.
The moments are calculated more easily by using the residual calculation in the complex plane.
Review and Extension of the TL model
- Lift on plate
- Moment on plate
The eddy motion assumptions for the wake vortices are also applied to the general external vortex. These assumptions are that the vortex moves only in the +x direction at speedU, and that its circulation does not change over time. Unfortunately, this equation uses the position of the vortex in terms of the original coordinate system, but the vortices move in the transformed coordinates.
The time leads of the vortex position can then be calculated from equation B.3 and the chain rule used to find the required leads.
ADDITIONAL FIGURES
- Simulations
- Heaving plate
- Forces on static airfoil
- Interaction with pitching airfoil gusts
- Interaction with heaving plate gusts
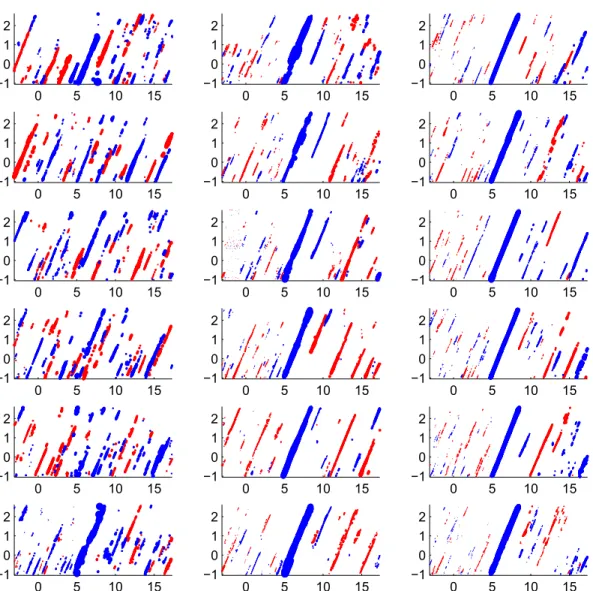
Figures C.8-C.10 show the drag, lift and moment coefficients of the airfoil-wave interactions due to the flapping airfoil, at different angles of attack. Figures C.14-C.16 display the drag, lift and moment coefficients of the airfoil-wave interactions due to the foam plate with S= 0.1, at different angles of attack. Each frame contains traces of a single release position and initial heading, but different wing angles of attack.
Each frame contains traces from a single release position and initial heading, but different airfoil angles of attack.