A study of six vehicles was completed to investigate the impact of changes in the volatility characteristics of unleaded gasoline containing 10% v/v ethanol on regulated exhaust and evaporative emissions and on hot and cold weather vehicle drivability. The volatility requirements for European gasoline are specified in the European Norm EN 228 [2] and include the DVPE and various parameters describing the distillation curve as measured in the laboratory by manual or automatic equipment [3].
![Table 1.1 European emission standards for gasoline passenger cars over the NEDC with emissions stated in grams/kilometre [5]](https://thumb-ap.123doks.com/thumbv2/123dok/11188363.0/10.892.97.766.407.609/table-european-emission-standards-gasoline-passenger-emissions-kilometre.webp)
BEP525 Study
This literature review was later combined with a detailed assessment of the impact of ethanol in gasoline on regulated and unregulated emissions, including particulate emissions [10]. As some of the vehicles in these published studies represented older, non-European technology, questions remained as to whether relaxing the gasoline volatility specification would increase the risk of vehicle performance or customer satisfaction issues in Europe.
10% v/v EtOH
E70 of the
Precision of E70 and E100 Measurements
Therefore, the analysis of repeatability 'r'2 and reproducibility 'R'3 of E70 and E100 given in Appendix 5 of [10] has been further investigated by reanalyzing the data from [10] using the new accuracy statement from [11]. Interestingly, however, the accuracy of the E70 measurement is slightly better for E5 blends than for BOB blends and higher ethanol blends.
CONCAWE’s Proposal for Volatility Relaxation
In addition, a footnote to the E10 volatility table was proposed stating that the volatility limits would be revised in the future based on relevant information brought to the attention of CEN/TC19. This footnote was intended to ensure that new technical and market information could be brought to the attention of CEN/TC19 WG21 following the revision of EN 228.
2 TEST PROGRAMME
TEST VEHICLES
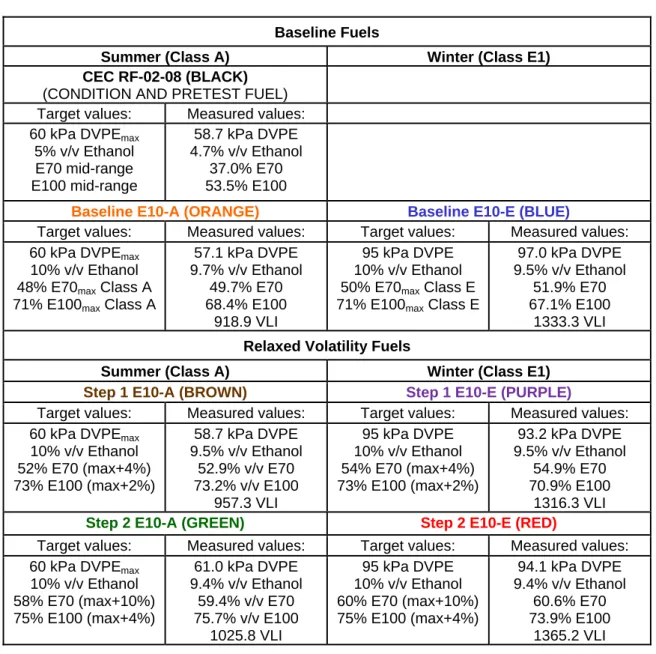
TEST FUELS
Gasolines from "1. a In order to evaluate the more stringent volatilization scenario, most of the vehicle tests in this study were conducted comparing the results for the 'baseline' and '2. steps'.
3 RESULTS AND DISCUSSION
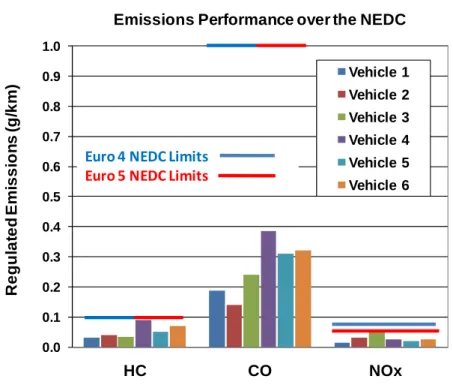
NEDC REGULATED EMISSIONS AT START OF STUDY .1 Results
Vehicle 2
Euro 5 NEDC Limits
- NEDC REGULATED EMISSIONS AT +23°C
- Overview of NEDC regulated emissions at +23°C
- Results
All data are shown in Appendix 2 and fleet averages are shown in this section. All data are included in mean values and there were no statistical outliers.

Fleet Average HC ‐ NEDC (+23C)
Fleet Average CO ‐ NEDC (+23C)
Fleet Average NOx ‐ NEDC (+23C)
Fleet Average CO2 ‐ NEDC (+23C)
Fleet Average FC ‐ NEDC (+23C)
- Conclusions from NEDC regulated emissions testing at +23°C
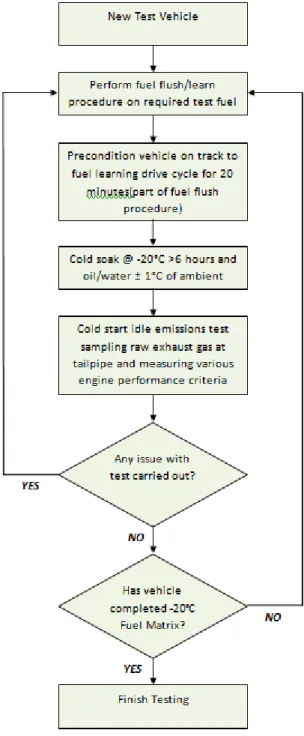
- COLD STARTING PERFORMANCE AT -20°C
- Overview of cold engine starting and idling testing
- Results
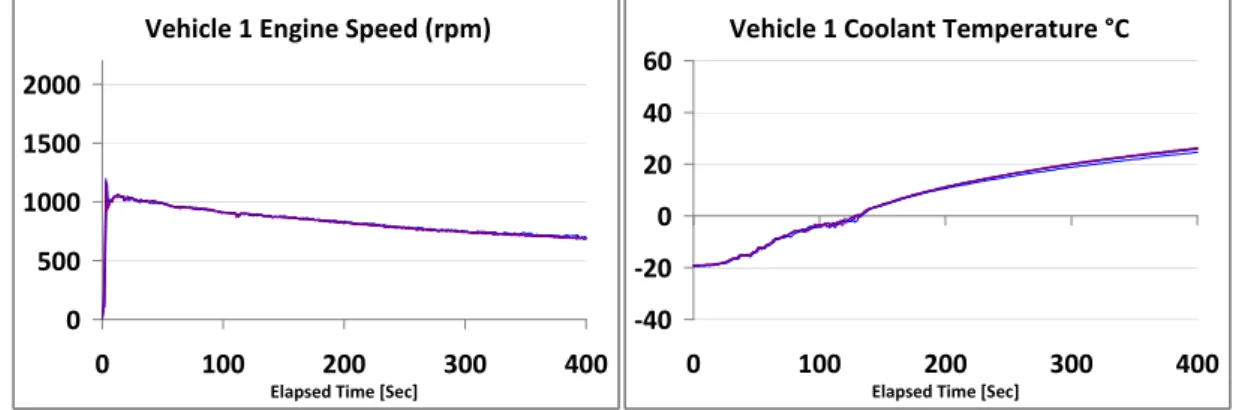
- Vehicle 1 Engine Speed (rpm)
- Vehicle 1 Coolant Temperature °C
- Exhaust Emissions and Lambda
- Vehicle 4 Lambda from UEGO
- Conclusions from cold engine starting performance at -20°C
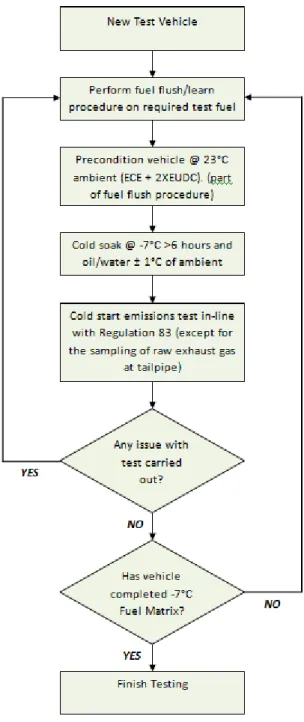
- NEDC REGULATED EMISSIONS AT -7°C
- Vehicle 2
- Conclusions from NEDC regulated emissions testing at -7°C
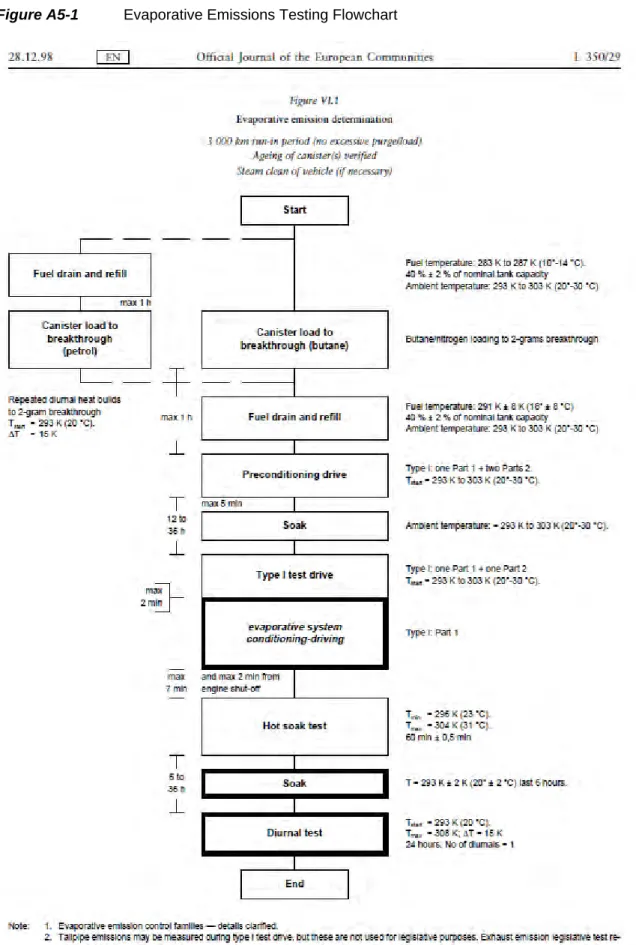
- EVAPORATIVE EMISSIONS
The results for CO bag emissions from the ECE phase of the test are shown in Figure 3.4.2. The results for baghouse NOx emissions from the ECE phase of the test are shown in Figure 3.4.3.
Diurnal emissions Hot soak emissions
Orange: Baseline E-10A Green: Step 2 E-10A
Orange: Baseline E-10A Green: Step 2 E-10A
Conclusions from evaporative emissions testing
Significant differences were found between repeated tests on the same fuel, so the available data was not sufficient to perform statistical analyses. HSL emissions were low in all tests and evaporative emissions results were dominated by daily emissions. Three of the vehicles met the evaporative emissions limit of 2g/test in all tests, but the other three vehicles all consistently exceeded the limit, by up to 100%.
There were no clear differences in emissions for either vehicle between Baseline E10-A (ORANGE) and Stage 2 E10-A (GREEN) fuels. Additional 24-hour experiments with additional carbon canisters connected to vehicle vents showed that the daily emissions were not from canister breakthrough, but from other sources, possibly including permeation.
- Results
- Conclusions from HWD testing at +40°C
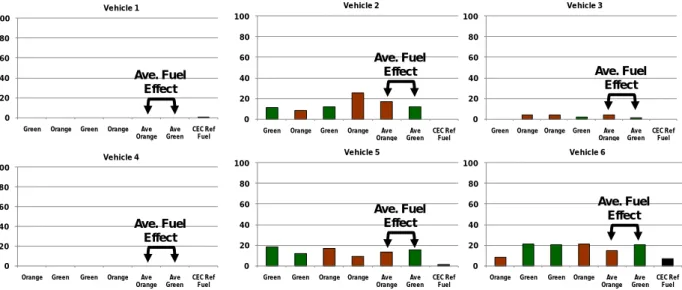
This behavior was not seen in the previous study [7,8] and is considered to be an artifact of the testing procedure with these vehicles while operating on a chassis dynamometer. None of the vehicles showed disadvantages greater than 24 on any of the test fuels, indeed two vehicles showed no disadvantages. However, three of the vehicles showed low disadvantages, below 24, while Vehicle 2 had one test on the Baseline E10-A (ORANGE) fuel with 33 disadvantages.
Five of the vehicles had significantly lower mean handicaps on Stage 2 E10-E (GREEN) fuel, while one (vehicle 3) had very low and similar handicaps on both fuels. 5 of 6 cars showed lower total average disadvantages on Stage 2 E10-A (GREEN) fuel compared to Baseline E10-A (ORANGE) fuel.
4 OVERALL CONCLUSIONS
Although conditions in the combustion chamber cannot be directly measured, the more volatile Stage 2 E10-E (RED) fuel can be expected to give better vaporization and mixing even in a cold combustion chamber. Compared to base fuel E10-E (BLU), the more volatile Stage 2 fuel E10-E (RED) produced more CO, less CO2, and slightly lower levels of unburned HCs in the exhaust. The highest fleet-average CO emissions were measured on Stage 2 fuel E10-E (RED), although the effect was dominated by a DISI vehicle (vehicle 2).
No overall increase in demerits was observed with Step 2 E10-A (GREEN) fuel compared to baseline E10-A (ORANGE) fuel for hesitations, stalls and overloads, and for instability in operation. Overall, the results of this six-vehicle test support the conclusion from previously published studies that a small relaxation of the E70max and E100max volatility parameters in the EN 228 gasoline specification is not expected to increase the risk of regulated emissions or performance problems. driving the vehicle.
5 GLOSSARY
TV/L20 Temperature at which a fuel forms a vapor/liquid ratio of 20 Txx Temperature at which xx% v/v of the sample has evaporated UEGO Universal Exhaust Gas Oxygen (sensor).
6 ACKNOWLEDGMENTS
7 REFERENCES
VEHICLE PREPARATION
In order to ensure the validity of the test work, efforts have been made to ensure that the vehicles used are appropriate. After discussions, it was decided that the vehicles selected should cover a range of model sizes and technologies while fairly representing the share of the current European fleet. The 2009 EU vehicle registration records were used to ensure that the vehicle and engine combinations selected were representative of the current European fleet.
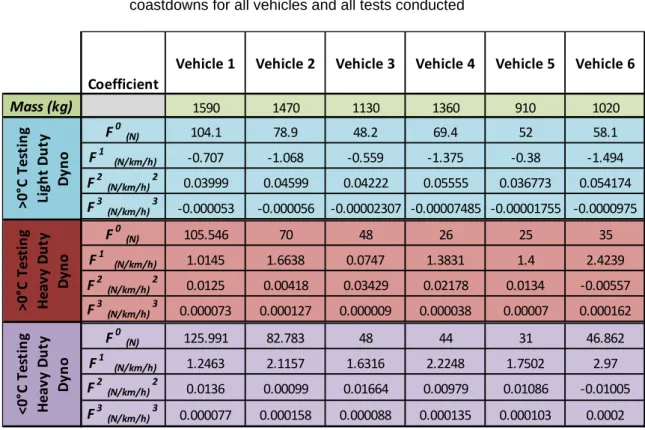
After the vehicle was purchased, each of the test vehicles was weighed and underwent a maintenance and geometry check before being driven on a test track to establish a set of coasting times. These times were used to simulate the vehicle dynamics when running chassis dynamometer tests.
Target speeds
Vehicle 1 Vehicle 2 Vehicle 3 Vehicle 4 Vehicle 5 Vehicle 6
The results of benchmarking emissions tests can be seen in Table A1-4 compared to the relevant Euro standard limit values. It is also worth noting that vehicle 2 had a small catalytic converter tightly coupled to the exhaust manifold, which did not leave enough room for instrumentation - in this case the 'pre-catalyst'. All other tests used the carbon canister fitted to the vehicle at the time of purchase.
Each of the vehicles evaporative emission pipes, leading to and from the carbon canister, are fitted with quick connectors to prevent any damage caused by wear and tear to the vehicle couplers, which are not designed for repeated use. Due to the nature of subjective impairment assessment and the inevitable difference in driver opinion on issues encountered during vehicle operation, each vehicle will be driven by the same driver on all fuels.
REGULATED EMISSIONS AT +23°C
Vehicle 1
Vehicle 3
Vehicle 4
Vehicle 5
Vehicle 6
Vehicle 4
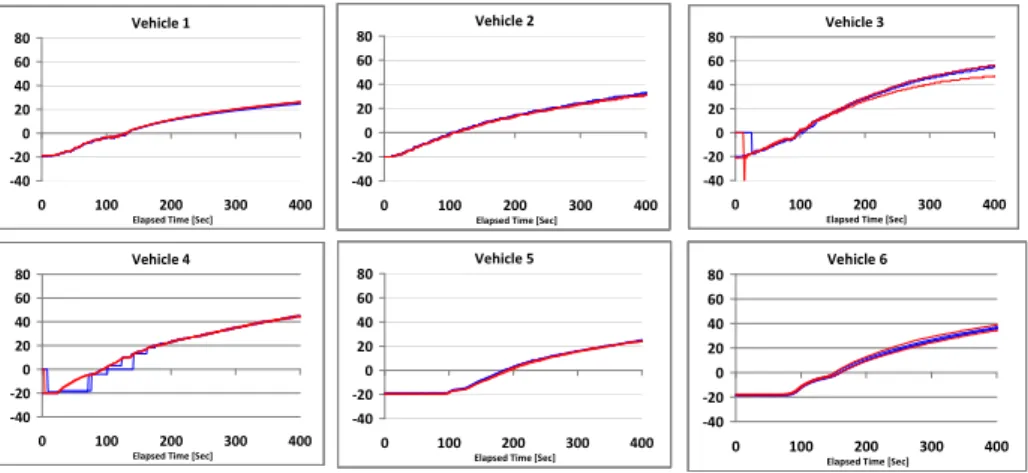
COLD STARTING & IDLING AT -20°C
Coolant thermocouples were located in the upper hose of the test vehicles (ie the .. cold' side of the thermostat). If the amount of fuel injected is the same for the two fuels, and the airflow the same, then the overall air-fuel ratio or lambda in the combustion chamber should also be the same. However, the distribution of fuel in the chamber will be different as evidenced by the compositional differences in the exhaust gases.
RED fuel produces more CO and less CO2 in the exhaust than BLUE fuel, while unburnt hydrocarbon levels are slightly lower in RED fuel. Although we cannot directly measure the conditions in the combustion chamber, we can infer that the more volatile fuel gives better vaporization and mixing.
REGULATED EMISSIONS AT -7°C
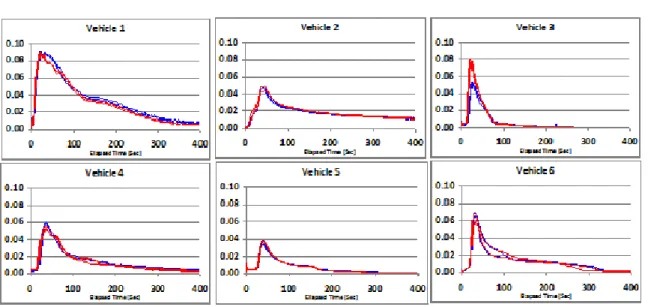
In most cases, these thermocouples registered steadily increasing temperatures throughout the ECE phase of the test cycle, as shown in Figure A4-2. The temperatures at the end of the ECE phases ranked the vehicles in the following order: Vehicles and 1. For the other 5 vehicles, the peak temperature drop across the catalyst is between 250°C and 350°C, which occurs at the end of the first 32 km/h steady state.
All vehicles tend to show two or three peaks in emissions corresponding to the first three acceleration phases of the ECE. Lambda was also calculated from the exhaust measurements, and these traces are shown in Figure A4-12 for two of the vehicles.
EVAPORATIVE EMISSIONS
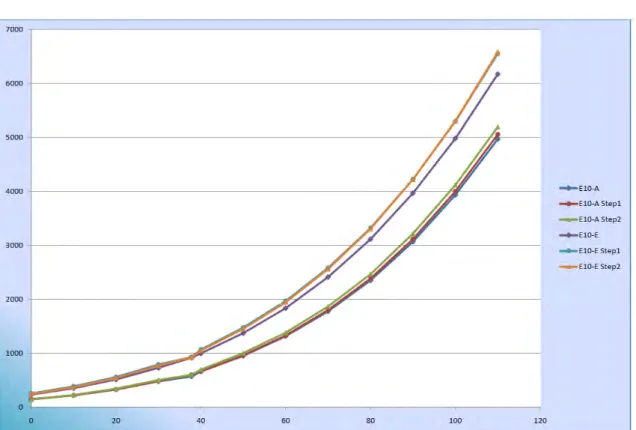
For most vehicles, cleaned and breakthrough weights continued to increase over time as the buses built up “chop” of heavier hydrocarbons and ethanol. The working capacity of the canister is shown in Figure A5-3, which is the difference between the weight of the cleaned and the broken canister. This is because, surprisingly, the breakthrough loaded weight increases over time as the “heel” in the carbon canister builds up, as does the purged weight.
Complete test results for all completed tests are given in Table A5.1, including bus weight data. Evaporative emissions data are discussed in Section 3.5 and shown in Figures 3.5.1 through 3.5.3, with tests arranged in date order.
HOT WEATHER DRIVEABILITY AT +40°C
The GFC procedure was used in the previous CONCAWE study [7,8] and in the absence of more recent developments this program was also chosen.

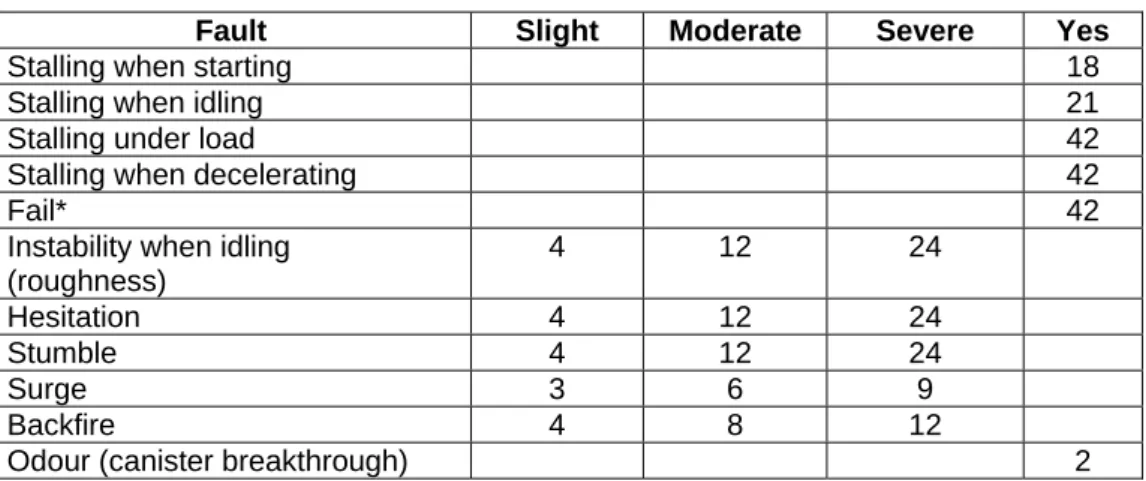
Reference acceleration times were measured (average of at least three accelerations) on CEC RF-02-08 fuel containing 5% Ethanol at +40ºC and are shown in Table A6-4. During testing it became clear that some vehicles were producing a significant number of faults, but these were mainly from increased acceleration times (vehicles 1, 2 and 3) and running instability (particularly vehicle 5). This led to some problems during the two Wide Open Throttle (WOT) accelerations in the test cycle.
This led to longer acceleration times during the tests than when setting the reference acceleration times, and therefore to substantial “acceleration times”. Most of the idling instability occurred during sequence 6 (bus test), especially during repeated idling between part-throttle accelerations up to 20 km/h.
PROPERTIES OF TEST FUELS
The test fuels were blended at Total ACS in Givors, France and shipped in 200 liter drums to Millbrook Proving Ground Ltd. On arrival at Millbrook, the fuel drums were stored in a protected area, avoiding heat and exposure to the elements. A randomly selected barrel of each test fuel was sampled and the fuel sample was sent to Shell Global Solutions UK in Thornton, UK for reanalysis.
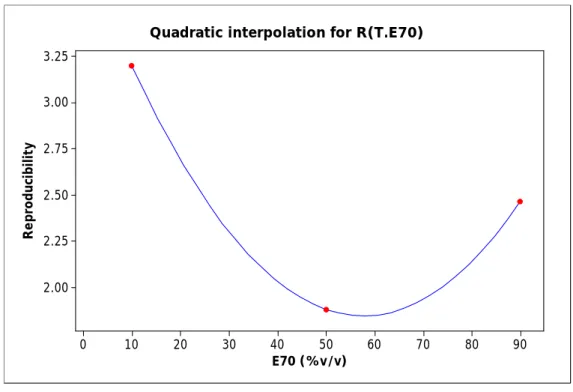
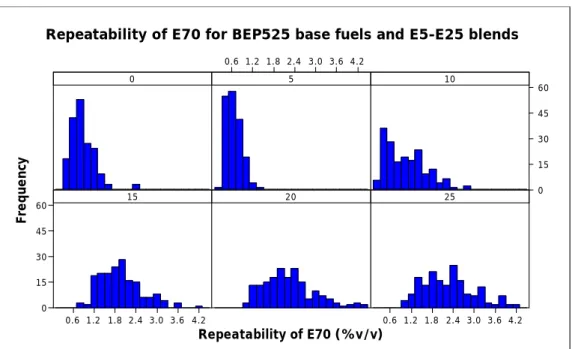
PRECISION OF E70 AND E100 FOR ETHANOL BLENDS
The calculated reproducibility figures for E70 are summarized in the histograms below for the different base fuels and their ethanol blends from 5 to 25% v/v. However, it should be noted that many of the PDOs and ethanol blends examined in that study fell outside the EN 228 limits for one or more specification parameters. Measurements of E70 and E100 are out of range at these ethanol contents. Measurements of E70 and E100 are out of range at these ethanol levels and the estimates of 'r' and 'R' are unreliable16.
However, Appendix C of ISO 3405 states that the method for calculating the repeatability and reproducibility of the Exxx value is not reliable when the dT/dV slope is high. Focusing on the calculation for E10 blends, we can estimate that the reproducibility of E70 averages 2.55, increasing to 7.06% v/v.