O-GlcNAcylation of HIF-1α Protein in Human Breast Cancer Cells
By Joshua Dolsen
A thesis submitted to the faculty of The University of Mississippi in partial fulfillment of the requirements of the Sally McDonnell Barksdale Honors College.
Oxford May 2019
Approved by
____________________________________
Advisor: Dr. Yu-Dong Zhou
____________________________________
Co-Advisor: Dr. Dale George Nagle
____________________________________
Reader: Dr. John Samonds
II
© 2019
Joshua Daniel Dolsen ALL RIGHTS RESERVED
III
ACKNOWLEDGEMENTS
The University of Mississippi has provided me with so many incredible opportunities that I could have never thought possible. I have been extremely blessed with experiences, friendships, and life lessons that were given to me with my time here. I would like to express my deepest appreciation to my thesis advisor, Dr. Yu-Dong Zhou, who has supported my endeavors unconditionally. She conveyed great insight, encouragement, enthusiasm and immense knowledge in regard to teaching, academia, and personal development. Without her guidance and persistent assistance, the completion of this thesis would not be possible.
I would also wish to express gratitude to the rest of my thesis committee, Dr. Dale George Nagle and Dr. John Samonds, for their patience, assistance, and advice, in the completion of this project. Their dedication to the success of their students has left a considerable impression on my experience of higher education that will last a lifetime.
My appreciation is further extended to my professors, friends, and family, whom have motivated me throughout my four years here at University.
Lastly, I am particularly grateful for my mother, Melanie Mattson, for her love, support, and encouragement throughout my life. I would not be the person I am today without her influence throughout my life.
IV
ABSTRACT
JOSHUA DANIEL DOLSEN: O-GlcNAcylation of HIF-1α Protein in Human Breast Cancer Cells
Cancer is an insidious disease that, if not caught in time, can cause devastating effects on the human body, especially if it metastasizes. It is important to note that each cancer behaves and develops differently based on its location in the body and the cellular characteristics constitute the instance of the disease. However, the development of cancer can universally be characterized by the acquisition of different hallmark abilities that promote disease progression. Proteins known as hypoxia-inducible factors (HIFs) can influence progression through these hallmarks, but primarily provides cancer cells with the ability to alter its metabolism to survive and further progress in hypoxic conditions, which are common intratumorally. The HIF transcription factors are composed of two subunits, an ‘α’-subunit that is oxygen-regulated and a constitutively expressed ‘β’-subunit.
Posttranslational modifications are a common form of regulation among cell types.
Specifically, enhanced O-GlcNAcylation, the addition of O-linked β-N-acetylglucosamine (O-GlcNAc), has been observed to have implications in the progression of diseases, including breast cancer. The purpose of this research is to detect O-GlcNAcylation of HIF- 1α protein, using the triple negative breast cancer MDA-MB-321-derived (MDA-MB-231 BoM) bone-specific organotropic subclone as an in vitro model.
V
TABLE OF CONTENTS
LIST OF FIGURES…….………..VI LIST OF TABLES………...………VII LIST OF ABBREVIATIONS……….VIII
INTRODUCTION/BACKGROUND……….……….1
MATERIALS AND METHODS………...19
RESULTS/DISCUSSION………...30
CONCLUSIONS AND FUTURE PERSPECTIVE………..36
LIST OF REFERENCES………...37
VI
LIST OF FIGURES
Figure 1. Standard curve from micro BCA protein concentration assay of BoM nuclear and cytoplasmic extracts………32 Figure 2. Western blot analysis of HIF-1α in nuclear and cytoplasmic
extracts………...34
VII
LIST OF TABLES
Table 1. Micro BCA protein concentration standards prepared for protein concentrations assay (BSA Standard at 2mg/mL) ……….………22 Table 2. BoM Cell BCA protein concentration assay: 96-well plate
layout………...………...24 Table 3. Layout for SDS-PAGE sample preparation……….………27 Table 4. Light absorption in 562 nm of micro BCA protein concentration assay of BoM nuclear and cytoplasmic extracts………...31 Table 5. Protein concentration calculated using the standard curve trendline
equation……….33
VIII
LIST OF ABBREVIATIONS
Ab Antibody
ANGPT2 angiopoietin-2
ANGPTL4 angiopoietin-like 4
ARNT aryl hydrocarbon receptor nuclear translocator bHLH basic-helix-loop-helix
BoM MDA-MB-231-derived bone-specific organotropic subclone
BSA bovine serum albumin
CAFs cancer-associated fibroblasts
CE cytoplasmic extract
CER cytoplasmic extract reagent CID collision-induced fragmentation DBPS Dulbecco’s phosphate buffered saline
dd distilled deionized
DMSO dimethyl sulfoxide
DSS disuccinimidyl suberate FGF2 Fibroblast growth factor 2
ECs endothelial cells
ECM extracellular matrix
EMT epithelial-mesenchymal transition ETD electron transfer dissociation
IX
Fbw7 F-box and WD protein
GSK3 glycogen synthase kinase-3
HCD higher energy collision dissociation HER2 human epidermal growth factor 2 HGF hematopoietic growth factor HIF-1a hypoxia-inducible factor-1 alpha HIF-2a hypoxia-inducible factor-2 alpha HIFs hypoxia-inducible factors
IP Immunoprecipitation
L1CAM L1 cell adhesion molecule
MA micro BCA reagent A
MB micro BCA reagent B
MC micro BCA reagent C
MMPs matrix metalloproteinases MMP-2 matrix metalloproteinase-2 MMP-9 matrix metalloproteinase-9
NE nuclear extract
NER nuclear extract reagent
ODD Oxygen-dependent degradation domain O-GlcNAc O-linked b-N-acetylglucosamine
OGT O-GlcNAc transferase
O-GlcNAcase b-D-N-acetylglucosaminidase
PAS PER-ARNT-SIM
X Phen 1,-10-Phenanthroline
p/s penicillin/streptomycin
PTM posttranslational modification
PUGNAc or PUG O-(2-acetamido-2-deoxy-D-glucopyranosylidenamino)-N- phenylcarbamate
TBF-b transforming growth factor beta
TME tumor microenvironment
TNBC triple negative breast cancer TTBS Tween-Tris buffered solution USP28 ubiquitin specific protease 28 VEGF vascular endothelial growth factor
1
Introduction/Background
Cancer is among one of one of the most common causes of death in some countries and has become an increasingly popular area of research. This disease does not discriminate and presents itself in many different forms throughout the body. Cancer is an umbrella term used to describe a variable set of diseases that is characterized by unusual, uncontrolled cell proliferation, that often spreads to neighboring tissues as it manifests. In cancerous cells, the cellular life cycle, replication, and apoptosis, are altered, which results in this abnormal, uncontrolled cell growth that frequently allows for the formation of tumors. Cancer cells arise from pre-existing, healthy cells (Hanahan and Weinberg, 2011).
Healthy cells recognize and respond accordingly to cell-to-cell signaling, and environmental cues that allow these cells to dictate their replication and life cycle in order to mature, but also not cause damage. In contrast, cancerous cells disobey many of these signals and do not differentiate into cells that provide a specialized physiological function.
Consequently, this can result in continuous replication of abnormal cells that often accumulate genomic mutations. Normal, healthy cells would be able to repair such damage or undergo apoptosis if the damage was permanent, but cancerous cells lack this ability. In contrast to normal cells, that usually reside within the tissue they are physiologically specialized for, cancerous cells are likely to detach and systematically travel. The cancerous cells that do travel throughout the body increases the severity of the disease, especially if a mass of cells leaves its area of origin and continues to replicate and develop in a process called metastasis. These primary changes in cellular characteristics are the result of the aggregation of mutations which either cause an overexpression of tumor- promoting oncogenes, or a disabling or under expression of tumor suppressing genes
2
(Hanahan and Weinberg, 2011). Simply stated, the emergence of cancer is due to the accumulation of mutations.
A solid foundation for understanding the biology of cancer has been established by what Hanahan and Weinberg call the Hallmarks of Cancer. These hallmarks describe ten biologically, particular and distinctive capabilities that allow for cancer cells to form tumors, grow these tumors, and metastasize. These capabilities are acquired during the multistep development of tumors and include the major abilities of proliferative signaling, evading growth suppressors, resisting cell death, enabling replicative immortality, inducing angiogenesis, and activating invasion and metastasis (Hanahan and Weinberg, 2011). Each can emerge independently from each other, but one or more hallmarks can induce the birth of another through its impact on tumor cells. In particular, one of the most foundational characteristics of cancerous cells is perpetuation of chronic proliferation. This is partially achieved either by the disabling of tumor suppressor genes, and unresponsiveness to contact inhibition, which can result in evading growth suppressing factors (Hanahan and Weinberg, 2011). Cancer cells, in opposition to normal conditions, can also deregulate the production and release of growth-promoting signals that dictate progression of cellular growth, becoming unrestricted by normal cell limitations and free from reliance on external growth factors (Hanahan and Weinberg, 2011). This abnormality among these cells allows for self-sufficiency by utilizing autocrine signaling, indelibly activating proliferative pathways, and deactivating negative feedback systems (Thermofisher, 2015). By acquiring the ability of self-proliferative signaling, and evading repressors of cell growth, tumor cells can obtain this unique ability of uncontrolled replication. Underlying these hallmarks, genome instability, chronic inflammation, reprogramming of cellular metabolism, and
3
evasion of the immune system collectively drive cancer progression (Thermofisher, 2015) (Hanahan and Weinberg, 2011).
Cancer may develop anywhere in the body and is capable of forming solid tumor masses, or tumors that affect blood cells. In general, there are two ways to classify cancer:
by tissue type of origin or histologic characteristics of the cancer and by primary location, where it first developed (National Cancer Institute, 2019). Cancer cells resemble the cells of tissues from which they originate; breast cancer will resemble breast tissue. Breast cancers can emerge in various parts of the breast. Most arise in the ducts that move milk from the breast lobules to the nipple, but some cancers form in the milk-producing lobules or rarely in the connective tissue (American Cancer Society, 2019) (Mayo Clinic, 2018).
Initially, diagnosis of breast cancer is done through breast exams, either by touch or mammogram, or breast ultrasound. If cancer is suspected, a biopsy of the breast tissue containing the cells from the suspicious area is analyzed to confirm if they are cancerous, and if so, reveal cell-specific traits (Mayo Clinic, 2019). All breast cancers are not identical and have unique characteristics that help provide insight on behavior, course of treatment, and prognosis. Certain cell surface receptor types, particularly presence of receptors for estrogen (ER-positive) and progesterone (PR-positive) used for growth stimulation, indicate sensitivity to these hormones; treatment includes endocrine therapy (Mayo Clinic, 2018). Another specific characteristic is the expression of the human epidermal growth factor receptor 2 (HER2) protein, which provides another therapeutic target. In contrast to cells that express these receptor types, triple negative breast cancer (TNBC) cells lack estrogen, progesterone, and HER2 receptors and are much more difficult to treat (Zhou et
4
al, 2018). Lacking these receptors results in greater difficulty when treating this specific type of breast cancer cell due to reduction in number of molecular targets.
Cancers are also described based on their stage of development, denoted stage 0 through 4. Knowing the stage at which the cancer has developed is a vital tool in treatment.
This knowledge also allows for the development of more effective treatment methods (Mayo Clinic, 2018). Breast cancer progresses through these 4 stages, which respectively correlate to severity and invasiveness. Stage 0 breast cancer includes non-invasive, localized masses that show no evidence of invasion to neighboring tissues. Cancer stages 1 through 3 involve invasive cancers that respectively spread to the neighboring lymph nodes. If cancerous masses are able to further develop, some cancers may reach stage 4.
This final stage of cancer development occurs when invasive breast cancer spreads beyond breast tissue and nearby lymph nodes to different parts of the body (Mayo Clinic, 2018).
Stage 4 cancer is commonly called advanced or metastasized cancer, and breast tumors at this stage usually spread to the brain, bone, lung, and liver (Zhou et al, 2018). Over 90%
of all deaths due to breast cancer is due to metastasis (Gilkes and Semenza, 2013) (Muz et al, 2015). Due to the type of tissue breast cancer usually emerges in, approximately 0.1%
of men will develop this disease over their lifetime based annual incidence rates (American Cancer Society, 2019). The 99.9% of other cases occur in females. According to the Breast Cancer Research Foundation, breast cancer is the most common cancer among American women after skin cancer and represents one in four of all cancers among women (Breast Cancer Research Foundation, 2018). Due to the increasing severity and invasiveness of breast cancer respective to its stage, and how common the disease is in women, early detection is imperative.
5
As cancers develop and form masses a complex microenvironment forms at the tumor site. The tumor microenvironment (TME) has become recognized as a major promoter for tumorigenesis and disease progression, as well as a useful tool to determine response to treatment (Soysal et al, 2015) (Wang et al 2017). The tumor microenvironment is composed of the interactions between the tumor and the adjacent tissues, which encompasses multiple cell types, including immune cells, blood vessels, inflammatory cells, the extracellular matrix (ECM), and cell-signaling molecules (Chen et al, 2015).
Normal cells involved in the TME of breast cancer include fibroblasts, leukocytes, adipocytes, and myoepithelial and endothelial cells (Soysal et al, 2015). These interactions between the tumor and the surrounding components affects how the tumor grows and develops by providing the cancerous mass with different tools to progress in severity.
In particular, the tumor’s response to inflammation is a critical factor in cancer development. When the immune system recognizes a tumor as antigenic, the immune response of nearby fibroblasts and immune cells, as well as the ECM is similar to that of dealing with a wound. This includes, pro-inflammatory signals, aiding in angiogenesis, preventing apoptosis, and accelerating the cell cycle, which in union highly promotes tumorigenesis (TME role). Inflammation in the TME is the result of this network of signaling from cells in the area. Dying cells that undergo necrosis also release pro- inflammatory signals into the surrounding tissue microenvironment that further recruits inflammatory cells and immune cells specialized for clearing necrotic debris (Hanahan and Weinberg, 2011). Sentinel immune cells, recruited leukocytes and even tumor cells, are also capable of releasing pro-inflammatory cytokines; soluble proteins that mediate cell- to-cell communication (Chen et al, 2015). Cytokines are synthesized and released to
6
combat infection or tissue damage; however, these signaling molecules can have tumor promoting effects. Local fibroblasts and endothelial cells synthesize and release these proteins in response to inflammation. When fibroblasts remain activated, their signaling continues to work with other molecular pathways to promote neoplasm initiation in the TME. These activated fibroblasts are termed cancer-associated fibroblasts (CAFs) and are the most abundant cells in the breast cancer stroma (Soysal et al, 2015) (Wang et al 2017).
Aside from recruiting immune cells, CAFs have an essential role in the promotion of metastasis and development of cancer through remodeling the ECM by inducing angiogenesis and directly stimulating cancer through hematopoietic growth factor (HGF), transforming growth factor beta (TGF- β), and platelet-derived-growth factor (Wang et al 2017). This differs from normal fibroblasts, which typically combat cancer development.
Angiogenesis, another hallmark of cancer development, is the formation of new blood vessels. In normal conditions, angiogenesis plays a role in wound healing and the female reproductive cycle and is regulated. In contrast to normal physiological conditions, during tumor progression an angiogenic switch is almost always activated and remains on, which results in continuous sprouting of new vessels that helps sustain tumor growth (Wang et al 2017). Similar to normal tissues, tumors require oxygen and nutrients from blood supply, and the ability to remove wastes and carbon dioxide; the tumor-associated neovasculature formed fulfills this need (Hanahan and Weinberg, 2011). Cancer-associated fibroblasts may promote tumor growth and invasion through release of fibroblast growth factor 2 (FGF2), and vascular endothelial growth factor (VEGF) into the TME. Pro- angiogenic signals, like VEGF, are also secreted by cancer cells and many other cell types involved in the TME, including macrophages, platelets, adipose cells and keratinocytes
7
(Chen et al, 2015) (Wang et al, 2017). There are over a dozen proteins known to have angiogenic promoting and inhibiting effects and pro-angiogenic protein expression levels in cancer cells correspond to aggressiveness (Nishida et al, 2006). Induction of angiogenesis occurs early during the multi-stage development of invasive cancers, and once activated tumors display diverse patterns of neovascularization; the new blood vessels are abnormally leaky and inefficiently perfused in comparison to normal vasculature. As a result of these unusual and incomplete blood vessels, blood supply varies throughout the tumor and immune surveillance of the tumor is hindered, which also assists in evasion of host immune response (Hanahan and Weinberg, 2011). In addition, these newly formed blood vessels also provide cancer cells a pathway into systemic circulation which designates angiogenesis as a vital step in the development of metastatic cancer.
Another critical component of the tumor microenvironment that greatly affects cancer progression is tumor hypoxia. Hypoxia occurs when tumor cells are exposed to a non-physiological level of oxygen tension and is a common factor in a majority of cancerous tumors (Muz et al, 2015). In normal conditions, tissues are in a state of normoxia if no complications are present. Due to structural and functional abnormalities of newly formed tumor vessels the diffusion of oxygen is limited, resulting in varying concentrations of oxygen throughout the tumor; diffusion of oxygen decreases as distance from the blood vessel increases (Gilkes and Semenza, 2013) (Liu et al, 2015). Other factors that can result in hypoxia include disease or treatment associated anemic reduction of oxygen transport.
Reduction in intratumoral oxygen availability consequently suppresses tumor growth, slowing cell proliferation, which frequently leads to regions of necrosis in solid tumors.
However, hypoxia can also promote tumorigenesis by altering expression of hypoxia-
8
associated genes, changes in metabolism, and promotion of angiogenesis (Semenza, 2015).
Given than there are varying levels of oxygen concentration throughout the TME, cancer cells throughout the tumor behave differently to decreased oxygenation. Normal cells in stressful conditions, like hypoxia, can activate autophagy, a metabolic and apoptotic adaption where intracellular organelles and proteins are captured, degraded and recycled in order to decrease oxidative metabolism and maintain homeostasis. Autophagy allows for the survival in short-term hypoxic conditions, but also has implications in the development of cancer. In some cases, this process acts as a suppressor to tumor growth, but in most contexts, tumorigenesis is promoted. Deficiencies in the microenvironment, as well as increased metabolic and biosynthetic demands, are likely causes of dependency on autophagy (Degenhardt et al, 2006) (Thermofisher, 2015). Within hypoxic tumor regions, basal autophagy is upregulated because it is vital for cell survival (Degenhardt et al, 2006).
In breast cancer it is common to find Intratumoral hypoxia and approximately 25%-40%
of invasive breast cancers exhibit hypoxic regions. Both hypoxic conditions and autophagy in cancer cells are driving TME conditions that are associated with more aggressive tumor phenotypes and increased risk of metastasis (Lundgren et al, 2007) (Muz et al, 2015) (Semenza, 2015).
Tumor cells that are exposed to hypoxic conditions for longer periods of time are associated with a number of other characteristics that further the development of a more insidious disease. Prolonged exposure to low oxygen concentration in cancer cells are connected to increased genomic instability and mutagenesis, that potentially results from a higher frequency of DNA breaks, and an aggregation of DNA replication errors from hindered DNA repair systems. Due to higher mutation rates and rapid p53-dependent
9
apoptosis, an environment that selects for cells that can survive longer in these stressful conditions are selected for, especially after these cells experience reoxygenation (Muz et al, 2015). As unfit tumor cells and normal cells die off in the TME, the cells that do survive cycling hypoxia with sporadic reoxygenation periods are often more fit for proliferation and metastasis, further promoting cancer development, as well as more resistant to chemotherapy and radiation treatment (Liu et al, 2015).
Hypoxic stress also influences changes in gene expression in both normal cells and cancer cells similarly apart from some key differences. In cancerous cells, this environmental pressure alters a number of complex intracellular signaling pathways involved in proliferation, survival, apoptosis, metabolism, migration, extravasation, and inflammation. In human cells, oxygen acts at the terminal electron acceptor in the process of oxidative phosphorylation and an adequate amount is needed in order to generate ATP.
In particular, increasing the activity of hypoxia-inducible factors (HIFs) is a common response by both normal cells and cancer cells to decreased oxygen levels in order to regulate oxygen consumption among some of their other effects (Semenza, 2015).
Adaptation to hypoxic conditions occurs through two transcription factors, HIF-1 and HIF- 2, which regulate the expression of over 1000 target genes (Semenza, 2012). Notably, HIF- 1 has been found to have a pivotal role in cancer cell adaptation to hypoxia and found to be elevated in solid tumors of the brain, colon, pancreas and breast cancers (Liu et al, 2015).
HIF-1 is a heteromeric-dimeric transcription factor that consists of an oxygen regulated HIF-1α subunit and a constitutively expressed HIF-1β subunit (Wang et al, 1995). The HIF-1β is also known as the aryl hydrocarbon receptor nuclear translocator (ARNT), and both subunits contain basic-helix-loop-helix (bHLH) and PER-ARNT-SIM (PAS) domains
10
that partake in DNA binding and dimerization, respectively; both belong to the bHLH-PAS protein superfamily (Liu et al, 2015) (Wang et al, 1995). HIF-1α contains an oxygen- dependent degradation (ODD) domain that regulates the stability and activity of the protein. This is achieved through hydroxylation by prolyl hydroxylase proteins of specific proline and asparagine residues in the presence of oxygen. Hydroxylation of the ODD is needed in order for the binding and ubiquitination by the von Hippel-Lindau protein, which targets the HIF-1α protein for degradation in the proteasome(Liu et al, 2015). Under hypoxic conditions, this hydroxylation is inhibited due to decreased levels of oxygen, which results in stabilization of HIF-1α, increased interaction with its co-activators, and its accumulation (Liu et al, 2015). As HIF-1α levels increase, the alpha and beta subunits hetero-dimerize leading to increased levels of HIF-1, resulting in increased transcription of HIF-1 associated genes. Since HIF-1β is normally produced in physiological conditions, HIF-1α can be considered the hypoxic-response element.
Numerous HIF-1 target genes play a major role in many essential aspects of breast cancer biology. At diagnosis, high levels of HIF-1α are indicators of early relapse and metastasis, as well as related to poor clinical outcomes regarding human breast cancer patients (Liu et al, 2015). These target genes of HIF-1 are also upregulated in the TNBC subgroup (Gilkes and Semenza, 2013). Overexpression of these genes have crucial activity in cancer hallmarks, including angiogenesis, metabolic reprogramming, resisting apoptosis, invasion, and metastasis (Semenza, 2012). HIF-1 has emerged as a major target molecule of cancer therapy because it mediates many different mechanisms in cancer cells that are involved in metastasis and cancer severity. Understanding the molecular and
11
cellular mechanisms that fundamentally lead to metastasis, especially those in HIF-1 can be helpful in developing accurate prognoses and new treatment methods.
Essentially, the initiation of metastasis consists of epithelial cells detaching from the primary tumor, adhering to and invading the surrounding stroma. The detachment of epithelial cells from primary tumors is thought of as the first step in metastasis and these cells undergo a transition process that resembles epithelial-mesenchymal transition (EMT) (Liu et al, 2015). HIF-1 upregulates EMT-associated transcription factors, or repressors, as well as activates signaling pathways associated with EMT that result in these cells losing epithelial phenotypical characteristics and obtaining mesenchymal cell-associated characteristics (Liu et al, 2015). Cellular and molecular characteristics such as absence of cell-to-cell adhesion, upregulation of vimentin, a mesenchymal protein, alteration of the cytoskeleton to promote flexibility, and increased motility are provoked by HIF-1 activity in tumor cells (Liu et al, 2015). In hypoxic microenvironments, these acquired characteristics promote the invasive ability of breast cancer cells that allow for metastasis.
Following invasion of the stroma by these cells that underwent EMT, invasion of the connective tissue and intravasation into the bloodstream takes place if the complex process of metastasis continues. The two routes that are utilized by cancer cells to gain access to physiological circulation are lymphatic vessels and blood vessels (Gilkes and Semenza, 2013). To acquire access to the lymph or blood vessels, HIF-1 activates the transcription of genes that encode for proteases. Degradation or remodeling of the extracellular matrix within the primary tissue and at distant sites of metastasis are vital factors that allow for invasion and intravasation (Semenza, 2012). Specifically, proteases, termed matrix metalloproteinases (MMPs), are zinc-dependent endo-peptidases that
12
degrade many components of the extracellular matrix and surrounding basal membrane;
MMP-2 and MMP-9 proteases are positively correlated to higher instance of breast cancer metastasis (Liu et al, 2015). Many studies suggest that HIF-1 further promotes the expression levels of MMP-2 and MMP-9 (Liu et al, 2015). HIF-1 also elicits the production of permeability factors VEGF and angiopoietin-2 (ANGPT2) that aid in the ability to intravasate, or pass into, the blood or lymph vessel (Semenza, 2012). Both VEGF and ANGPT2 induce angiogenesis and vascular modeling. Once cancer cells gain access to circulatory vessels, the ability to migrate to other tissues is enabled. If these cells are able to leave blood or lymph vessels, the disease itself may establish itself in other tissues and wreak havoc on the body.
Cancer cells that have entered circulation must leave, or extravasate from, the vessel in order to establish secondary tumors. Approximately less than 0.1% of cancer cells that enter circulation are able to produce a metastatic lesion (Liu et al, 2015). Traveling to distant tissues where cancer cells can then extravasate from the bloodstream is considered a limiting step in the metastasis process. This step is limiting because cells must first adhere to endothelial cells (ECs) in the vasculature, then disrupt the close interactions between these cells to extravasate into the distal tissue (Liu et al, 2015). A study that investigated metastasis of breast cancer to lung tissue revealed that HIF-1 promoted extravasation (Zhang et al, 2011). It was also found that HIF-1 induces the production of angiopoietin- like 4 (ANGPTL4). Expression of ANGPTL4 in cancerous cells results in disruption of the vascular junctions between ECs, which increases the permeability of lung capillaries.
Because of this, extravasation of cancer cells is facilitated into lung tissue, a common site of breast cancer metastasis (Padua et al, 2008). The TNBC cells that overexpress the HIF-
13
1 protein, also show EC monolayer adherence in a HIF-1-dependent form. A direct target of HIF-1 transcription, L1 cell adhesion molecule (L1CAM) is a cell surface protein that plays a key role in mediating cell-cell adherence through homophilic and heterophilic interactions with integrins, neuropilin 1, or the CD24 cell surface receptor (Semenza, 2012). Cancer cells that overexpressed L1CAM promoted adhesion of these cells to EC monolayers in vitro and revealed an increase in the number of cancerous cells that extravasated into lung tissue in mice (Zhang et al, 2011). These products of HIF-1 induced transcription, allow for the promotion of extravasation, providing cancer cells with the ability to invade distant tissues where they can establish metastatic sites.
An emerging hallmark of cancer is reprogramming of cellular metabolism.
Compared to healthy cells, cancer cells exhibit a higher energy demand due to rapid, increased cell proliferation, and varying available oxygen levels. Reprogramming metabolism is an essential biological process that provides a selective advantage for survival and growth by utilizing conventional metabolic pathways to generate energy and biosynthetic precursors, as well as maintain redox balance; Hypoxic conditions are capable of inducing metabolic alterations in tumor cells (Chen et al, 2015) (Muz et al, 2015).
Normal cells under aerobic conditions, use glycolysis to break down glucose into pyruvate in the cytosol, which is further processed to CO2 in the mitochondria. When a cell is unable to obtain adequate amounts of oxygen for aerobic respiration, cells favor glycolysis in order to meet energy needs and very little mitochondrial oxygen-dependent activity takes place.
Cancer cells, even in the presence of oxygen, can alter their metabolic activity, and consequently their production of energy, by limiting their glucose energy metabolism mostly to glycolysis. This state of cellular metabolism has been termed “aerobic
14
glycolysis” (Hanahan and Weinberg, 2011). The process of glycolysis alone is not sufficient for cellular survival, and cancer cells must make up for an approximate 18-fold ATP deficit afforded by glycolysis relative to oxidative phosphorylation (Hanahan and Weinberg, 2011). The hypoxia response system plays a key role in promoting the metabolic changes of cancer cells and acts pleiotropically to compensate for the loss of energy from mitochondrial function. Specifically, HIF-1 activity can upregulate the biosynthesis of glucose transporters to increase glucose uptake and glycolytic enzymes (Muz et al, 2015).
Cancer cells also take advantage of glycolytic variability, which is also affected by HIF-1 transcriptional activity. Other metabolic sources such as acetyl-CoEnzyme A, from fatty acid synthesis, and glutamine are utilized by cancer cells to combat hypoxic conditions (Hanahan and Weinberg, 2011).
The HIF-1 protein is considered a master regulator of oxygen homeostasis and cancer development due to the transcriptional effects it produces. However, like any protein, the HIF subunits, specifically HIF-1α, can be subjected to post-translational modification (PTM) (Keith et al, 2011). In general, a protein can be modified at any time during a cell’s life cycle, but most PTM occurs shortly after modification. Various types of PTMs include phosphorylation, glycosylation, ubiquitination, S-nitrosylation, methylation, N-acetylation, lipidation, and proteolysis to name a few (Thermofisher, 2019).
In order to achieve responsiveness to hypoxic conditions on a molecular level, an intricate and interlinked biochemical system involving both short-term modifications and reactions (no change in gene expression) and corresponding long-term alterations, such as changes in gene expression is integrated by cells (Semenza, 2017). These short-term responses can include changes in enzymatic activity that can regulate transcription factors by
15
posttranslational signaling events. Interestingly enough, the regulation of the HIF-1α protein is not impacted by hypoxia alone. These proteins also respond to various stressors, growth and coagulation factors, cytokines, hormones, each with different protein kinase regulated pathways, under normoxia (Semenza, 2017). As mentioned before, two bHLH- PAS protein subunits form heterodimeric HIFs in hypoxic conditions (Wang et al, 1995).
In terms of HIF regulated genes, response to hypoxia is highly dependent on the α subunits of HIFs (Keith et al, 2011). Thus, PTM of the HIF-1α subunit can yield differential effects on cellular functions.
Many proteins that result in HIF-1α PTM regulate HIF-1 activity by either promoting or inhibiting interactions of HIF-1α with other proteins. Aside from hydroxylation, which is involved in HIF-1α degradation, the protein subunit is also subjected to an array of different oxygen-independent PTMs (Semenza, 2017). A vital PTM for protein activity and stability is phosphorylation. The phosphorylation of the HIF- 1α subunit can occur by direct or indirect kinase activity, but the overall extent to which this affects HIF-1 transcription varies based on the signal, cell-type, or tissue (Kietzmann et al, 2016). The PI3k/PKB (Akt) pathway is a major signaling node that is well known in tumorigenesis and can result in the indirect phosphorylation of the HIF-1α subunit (Thermofisher, 2015)) (Keith et al, 2011). One target of PKB(Akt) is glycogen synthase kinase-3 (GSK3), which can directly phosphorylate HIF-1α, inhibiting its activity.
Phosphorylation of HIF-1α by GSK3 leads to interaction with F-box and WD protein (Fbw7) and Ubiquitin specific protease 28 (USP28) which systematically degrades the HIF-1α subunit (Keith et al, 2011). Yet, if GSK3 is phosphorylated by PKB(Atk), then HIF-1α remains unrestrained by its effects.
16
Another PTM that occurs to the HIF-1α protein that has drawn recent attention is O-Linked β-D-N-acetylglucosamine (O-GlcNAc) modification, or O-GlcNAcylation. O- GlcNAc modification is involved in many crucial biological processes including transcription, translation, signal transduction and proteasomal degradation and has been found to be directly linked to pathological progression of chronic diseases, one of which is cancer (Ma and Hart, 2017). Whereas the glycosylation of proteins occurs between Asn- linked (N-linked) or Ser/Thr-linked (‘mucin-type’ O-linked) cell surface and secreted proteins, O-GlcNAcylation is the covalent attachment of β-D-N-acetylglucosamine to the hydroxyl group on serine or threonine residues. This modification also almost solely occurs to proteins that are localized in the nucleus, mitochondria, and cytoplasm. Two enzymes, O-GlcNAc transferase (OGT) and β-D-N-acetylglucosaminidase (O-GlcNAcase), control this modification by addition and removal of the O-GlcNAc moiety, respectively. This allows for the reversibility and dynamicity of the process (Ma and Hart, 2014). In addition, O-GlcNAcylation can interact with other PTMs, including competitive or reciprocal activity with phosphorylation, and has been found to have implications in breast cancer patient outcomes (Ferrer et al 2014).
The importance of investigating O-GlcNAc modification lies within its effects on cancer cells and the influences it has in the progression of the disease. Although the mechanism that results in elevated O-GlcNAcylation is not completely understood, the elevated levels of OGT have been observed in breast, prostate, and lung cancer. Decreased levels of OGA have been seen in breast and colon cancers as well (Ferrer et al 2014). Breast cancer cells containing high HIF-1α levels were observed to have had a heightened occurrence of O-GlcNAcylation with elevated OGT levels. Lower levels of OGA in these
17
cells also correlated with poor patient outcome. The process of O-GlcNAcylation regulates metabolic reprogramming in cancer cells through the regulation of HIF-1α. Both OGT and O-GlcNacylation are suggested to play key roles in maintenance of aerobic glycolysis, by increasing HIF-1α stabilization and promoting aerobic glycolysis in a feed-forward mechanism. Elevation of this PTM was also observed to protect breast cancer cells from endoplasmic reticulum stress-mediated apoptosis. The process of O-GlcNAc modification also competes with HIF-1α phosphorylation, which affects GSK3/Fbw7/USP28-dependent degradation, allowing for continuation of its transcriptional effects on cancer cells (Ferrer et al 2014) (Ma and Hart, 2014). Due to its influence on multiple hallmarks of cancer, O- GlcNacylation has proven to be a promising therapeutic target that can effectively combat cancers that benefit from it.
Over the span of about 30 years, there have been a number of approaches that have been developed for O-GlcNAcylated protein analysis. Recently, mass spectroscopy (mass spec) has emerged as one alternative to detect this modification. In contrast to biochemical detection methods, such as galactosyltransferase-catalyzed labeling followed by autoradiography or immunoblotting with specific antibodies, mass spec has provided a unique capacity for the deduction of O-GlcNAc modification in proteins in a site-specific and semi-quantitative manner (Ma and Hart, 2017). There have been many methods that have been applied to the detection of this modification, each using alternative fragmentation methods. Three of these methods include collision-induced fragmentation (CID), higher energy collision dissociation (HCD), and electron transfer dissociation (ETD). Mass Spectrometry-based identification is an especially powerful tool, but it cannot independently differentiate between O-GlcNAc and O-GalNAc without highly specific
18
approaches, such as labeling techniques (e.g., antibodies specific for the molecule). In order to confirm the status of specific modifications on proteins, techniques such as Western blotting can be used as a confirmation tool (Ma and Hart, 2017).
19
Materials and Methods
Cell Culture/Compound Treatment
Human breast tumor cell line MDA-MB-231-derived subclone BoM1833 (BoM, bone metastatic, Massagué, 2003) cells, developed by the Massagué group at Memorial Sloan Kettering Cancer Center (New York City, NY), were maintained in RPMI1640 medium (GIBCO) supplemented with 10% (v/v) fetal bovine serum (FBS) (Hyclone) and 0.5% penicillin/streptomycin (p/s) (equivalent to 50 units mL-1 and 50 µg mL−1, respectively) (Life Technologies) in a humidified environment at 37 °C under 5%
CO2/95% Air. The cells were grown on 10 cm tissue culture plates (USA Scientific). To isolate nuclear extracts, BoM cells were plated at the density of 10 x 106 cells/plate onto 10 cm plates. After overnight incubation, 1,10-phenanthroline (Phen) (Sigma Aldrich) was added to the cells in a volume of 10 μL (10 mM stock solution in DMSO)/plate to achieve the final concentration of 10 μM (7 plates), and O-(2-acetamido-2-deoxy-D- glucopyranosylidenamino)-N phenylcarbamate (PUGNAc) (Sigma Aldrich) in a volume of 30 μL (10 mM stock solution in DMSO)/plate to achieve the final concentration of 30 μM (7 plates).
Following 4-hour incubation of the compounds with the BoM Cells, aspiration of the conditioned media then took place, and the plate was washed once with cold 1x Dulbecco’s Phosphate Buffered Saline (DBPS), diluted from 10x DPBS (Sigma Aldrich D1408). Subsequent detachment of the cells was accomplished by the addition of 0.9mL/plate of 0.25% trypsin ethylenediaminetetraacetic acid (Trypsin-EDTA) solution (Gibco 25200-056), at 37 °C for five minutes. The trypsin reaction was stopped with the
20
addition of 10 mL 10% FBS RPMI1640 Media. The cell suspension was transferred to a 15 mL centrifuge tube, and the pellet was collected after centrifugation at 500 rpm for five minutes at room temperature.
Cytoplasmic and Nuclear Extract Preparation:
The pellet was washed once with 10 mL cold 1x DPBS and collected by centrifugation at 500 rpm for five minutes. The cell pellet was then resuspended in 1x DPBS, transferred to a 1.5 mL microcentrifuge tube, and pelleted by centrifugation at 800 rpm (100 x g) for three minutes. The supernatant was removed, leaving the cell pellet as dry as possible in the microcentrifuge tube. Ice-cold cytoplasmic extract reagent (CER) I (950 μL) was then added to the cell pellet and vortexed for 15 seconds. Incubation of the tube on ice for 10 minutes followed. After chilling, 55 μL of CER II was added to the tube and vortexed for five seconds (16,000 x g). The cell lysate was centrifuged at 16,000 x g for five minutes at 4 °C. The supernatant and pellet produced from this step are the cytoplasmic extract and the nuclei pellet, respectively.
Immediately after, the supernatant was transferred to a pre-chilled tube, and the tube containing the pellet was supplemented with ice-cold nuclear extract reagent (NER) (475 μL) to lyse the nuclei. The nuclear lysate was then vortexed for 15 seconds and chilled for 10 minutes for a total time of 40 minutes; four cycles of centrifugation (16,000 x g) for 10 minutes. The supernatant (nuclear extract sample) was transferred to a new tube. Both nuclear and cytoplasmic extract samples were aliquoted to new tubes respective to the following: NE 5 μL(1x); 15 μL (2x); ~150 μL (1x); remaining NE ~350 μL and CE 5 μL(1x); 20 μL (1x); 100 μL (1x); 200 μL (2x); remaining CE~500 μL. The production of
21
cellular extracts from Phen and PUGNAc BoM cells yielded 4 distinct extracts: NE+Phen, NE+PUGNAc, CE+Phen, and CE+PUGNAc.
Protein Concentration and Quantification:
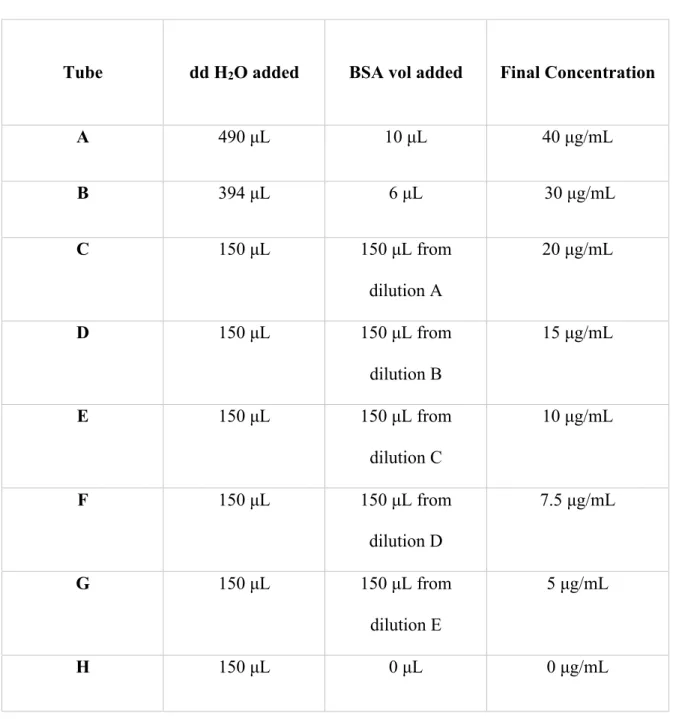
Analysis and standard comparison of BoM cytoplasmic and nuclear extracts to determine protein concentration was accomplished by utilizing a micro BCA protein assay kid (ThermoFisher Scientific 23235). The series of standards was made using a micropipette to transfer set volumes of 2 mg/mL bovine serum albumin (BSA) and distilled deionized (dd) water into eight separate 0.5 mL tubes (shown in table 1). Tubes A and B were produced first by creating two diluted BSA solutions with concentrations of 40μg/mL and 30μg/mL respectively. Thereafter, diluted BSA solutions of concentrations (μg/mL) of 20, 15, 10, 7.5, 5, and 0 were made by transferring 150 μL of the respective BSA solution to the next ordered tube that would result in a BSA solution of half that concentration (tubes B through J).
22
Table 1. Micro BCA protein concentration standards prepared for protein concentrations assay (BSA standard at 2mg/mL)
Tube dd H2O added BSA vol added Final Concentration
A 490 μL 10 μL 40 μg/mL
B 394 μL 6 μL 30 μg/mL
C 150 μL 150 μL from
dilution A
20 μg/mL
D 150 μL 150 μL from
dilution B
15 μg/mL
E 150 μL 150 μL from
dilution C
10 μg/mL
F 150 μL 150 μL from
dilution D
7.5 μg/mL
G 150 μL 150 μL from
dilution E
5 μg/mL
H 150 μL 0 μL 0 μg/mL
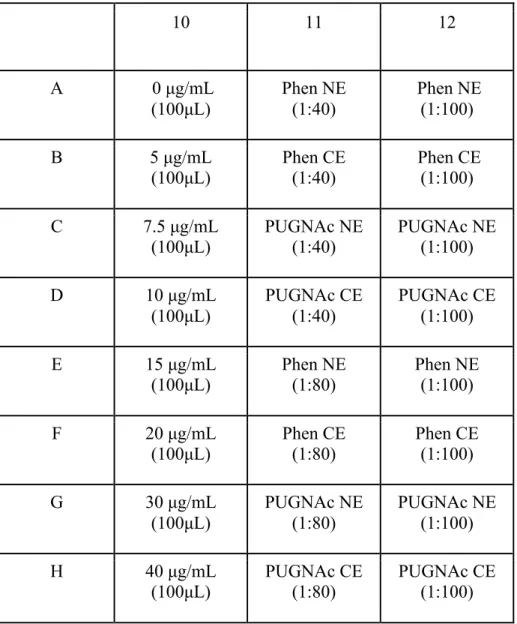
Following the production of the standards, an array of protein concentrations was made in eight separate tubes by using diluted NE and CE samples. By using the BoM cellular extracts, (Phen+NE, PUG+NE, Phen+CE, and PUG+CE) dilutions were prepared for placement in a 96-well plate. The NEs and CEs were then made into two different
23
dilutions resulting in eight total solutions. Four different 1:40 dilutions were produced by diluting the sample in tubes. Each 1:40 dilution that was produced was composed of 2.5 μL of protein sample and 97.5 μL of dd water respective to 100 μL. The dilutions were then pipetted into different wells on the plate. From the corresponding tubes of 1:40 dilution solutions, four 1:80 dilutions were produced by adding 50 μL of the 1:40 dilutions to 50 μL of dd water in separate tubes. These dilutions consisted of column 11 on the well plate shown on table 2. Filling column 12 of the 96-well plate was completed by transfer and dilution of the respective NE or CE extracts in column 11. Following production of the array of protein concentrations, 100 μL of each standard was added to individual wells on column 10 of a 96-well plate.
24
Table 2. BoM cell BCA protein concentration assay: 96-well plate layout
10 11 12
A 0 μg/mL
(100μL)
Phen NE (1:40)
Phen NE (1:100)
B 5 μg/mL
(100μL) Phen CE
(1:40) Phen CE (1:100)
C 7.5 μg/mL
(100μL)
PUGNAc NE (1:40)
PUGNAc NE (1:100)
D 10 μg/mL
(100μL)
PUGNAc CE (1:40)
PUGNAc CE (1:100)
E 15 μg/mL
(100μL) Phen NE
(1:80) Phen NE
(1:100)
F 20 μg/mL
(100μL)
Phen CE (1:80)
Phen CE (1:100)
G 30 μg/mL
(100μL)
PUGNAc NE (1:80)
PUGNAc NE (1:100)
H 40 μg/mL
(100μL) PUGNAc CE
(1:80) PUGNAc CE
(1:100)
A working solution was then prepared by mixing 36 μL of BCA reagent C, 864 μL of BCA reagent B, and 900 μL of BCA reagent A (1:24:25 ratio), of which 100 μL was added to each well and mixed well. After preparation of the three columns on the 96-well plate, the plate was incubated at 37 °C for two hours. Following this two-hour period, the plate was then analyzed using the SPECTRAFluor Plus and read at 562nm.
25 Coupling of the HIF antibody to the resin
The purpose of using immunoprecipitation (IP) was to isolate and purify the HIF- 1α protein so that it may be used for mass spectroscopy. Preparation for IP began with cross linking the primary anti-HIF-1α antibody (BD Transduction Laboratories: cat:
610959, Lot: 06820, 250 μg/mL) to the protein A/G agarose bead using a commercial kit (Pierce, cat: 26147).
A 2 mL of 1x coupling buffer was made by diluting 100 μL of 20x of coupling buffer with 1900 μL of water (QIAGEN 1017879). The Pierce Protein A/G Plus Agarose (20 μL) was then placed into a Pierce spin column and centrifuged at 1000 x g for one minute. The prepared Coupling Buffer was then used to wash the resin and centrifuged once more. Following this step, 10 μg of antibody for coupling was made by preparing 10 μL of antibody (Ab), 5 μL of 20 x Coupling Buffer, and 85 μL of dd water. The prepared solution was then added to the column containing the resin.
Preparation for the crosslinking of the antibody began with adding 217 μL dimethyl sulfoxide (DMSO) to 25 mM disuccinimidyl suberate (DSS) to make a 1:10 dilute solution of 2.5mM DSS. Following, 2.5 μL of 20x Coupling Buffer, 9 μL of 2.5 mM DSS, and 38.5 μL of distilled deionized (dd) water was added to the column to initiate the coupling reaction and incubated for 50 minutes on a rotator. Once reacted, 50 μL of elution buffer was used to wash the solution twice to remove any non-crosslinked antibodies and halt the reaction. This solution was then washed twice with 200 μL of cold IP Lysis/Wash Buffer and centrifuged after each washing. The final product of this procedure was then used in the IP process to isolate the purified HIF-1α protein.
26 Immunoprecipitation
In preparation of IP, 330 μL of Phen treated BoM cell NE and 295 μL of PUGNAc (referred to as PUG in this procedure) treated BoM NE were washed with IP Lysis (170 μL and 205 μL, respectively to make volume consistent). Both of the extracts were then incubated overnight at 4 °C. Following incubation, the extracts were placed in separate columns, the bottom plug was removed, and the screw cap was removed. The columns were then placed in a collection tube and centrifuged for one minute at 1000 x g; the flow through was saved (Phen elute 1 and PUG elute). Following this step, 200 μL of lysis wash was added and rotated once more, twice. Next, 100 μL of 1x conditioning buffer (2.15 μL 100x and 212.85 μL dd water) was used to wash the samples before placement into new tubes with 10 μL of elution buffer before centrifugation at 1000 x g for five minutes. After spinning, 50 μL of elution buffer was added once more before another five minutes of rocking.
Following removal from the centrifuge, the “elute” from each extract was transferred to a new tube and stored on ice (Phen elute 2 and PUG elute 2). The columns were then regenerated with 100 μL of 1x coupling buffer, and rotated, which was repeated once. A new bottom plug was then used, and the bottom was wrapped up after 250 μL of 1x coupling buffer was added to each column. The sample was then put into 15 mL tubes and stored at 4 °C (Phen NE and PUG NE). The products obtained from this procedure were then prepared for separation by SDS-PAGE and are as followed: Phen NE, Phen elute 1, Phen Elute 2, PUG NE, and PUG elute 2. These samples, a molecular weight marker (Bio-Rad, Kleidoscope, 161-0324 (discontinued)), and the “Ab” Phen, “Ab PUG” were then prepared for loading onto the gel. The last two lanes on the right of the SDS page were
27
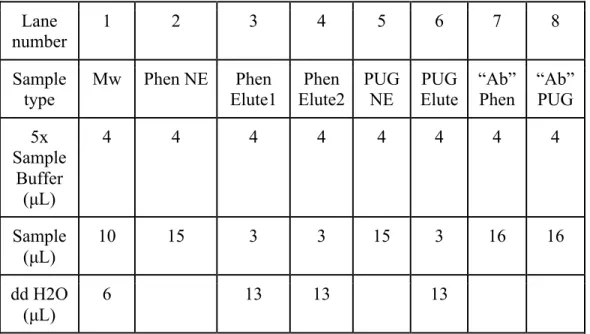
filled with the left-over pellet from the columns. In lane nine and lane ten, 4 μL of 5x sample buffer and 16 μL of sample of Phen and PUG were added, respectively (not shown in table 3). These solutions were mixed and then boiled for five minutes to denature proteins. After, the samples were put on ice and the sample was collected through a quick spin.
Table 3. Layout for SDS-PAGE sample preparation Lane
number
1 2 3 4 5 6 7 8
Sample type
Mw Phen NE Phen Elute1
Phen Elute2
PUG NE
PUG Elute
“Ab”
Phen
“Ab”
PUG 5x
Sample Buffer
(μL)
4 4 4 4 4 4 4 4
Sample (μL)
10 15 3 3 15 3 16 16
dd H2O (μL)
6 13 13 13
SDS-PAGE and Western Blot
The samples prepared from the IP procedure were loaded onto a Bio-Rad precast gel (Mini-protean TGX, 4-20%, 456-1094) (order shown on table 3). A 1x Tris/
tricine/SDS buffer, prepared by diluting the 10x buffer solution (Bio-Rad 161-0744) with 180 mL of dd water, was then added to the electrophoresis apparatus. The molecular weight marker was then loaded into the first lane, followed by the loading of samples (left to right
28
in table 3) in the rest of the gel lanes respectively. The gel was run at 125 V for 45 minutes, then transferred from the SDS-PAGE gel to a dd water prewet nitrocellulose membrane.
This was achieved by soaking the gel in 1x transfer buffer, composed of 100 mL of 10x TG (Bio-Rad 161-077), 100 mL of methanol (HPLC Grade, Fisher A 452-4), and 800 mL of dd water, the transfer sandwich assembled, and for 50 minutes at 140 mA. An ice pack was placed outside the apparatus to assist with temperature control. The transfer apparatus was placed on a stir plate with a stir bar to aid in solution mixing. After transfer, Ponceau S. Solution (Sigma Aldrich) was used to stain the proteins on the nitrocellulose membrane to ensure the transfer is effective
For Western blot, a Tween-Tris buffered solution (TTBS) was prepared by diluting 0.25 mL of tween 20 (Sigma Aldrich, P1379) and 50 mL of 10x Tris Buffered Saline (Boston Bioproducts, BM-301) with 450 mL of dd water. The blocking solution was prepared by dissolving 4.8g of non-fat dry milk (blotting-grade blocker, Bio-Rad 170- 6404) into 96 mL of TTBS. The membrane was incubated with the 5% non-fat dry milk TTBS solution for an hour with rocking at room temperature, to prevent non-specific antibody binding to the membrane. The membrane was then washed twice with TTBS (5 minutes each, rocking, room temperature). Following the washes, the primary HIF-1α antibody (BD Transduction Laboratories: cat: 610959, Lot: 06820, 250 μg/mL) was added at the dilution of 1:1000 in the blocking solution and the incubation continued for another hour. The membrane was then washed twice with 5% non-fat milk/TTBS solution (5 minutes each, rocking, room temperature). The secondary antibody, a stabilized goat-anti- mouse HRP-conjugated antibody (PIERCE, cat: 1858413, Lot: HH 10648, 10 μg/mL) was added to the blocking solution at 1:3000 dilution (3 μL to 9 mL of 5% milk/TTBS). After
29
an hour, the membrane was washed once for 10 minutes with TTBS followed by two washes for 5 minutes each with TTBS. The membrane was then developed with West Femto Maximum Sensitivity Substrate (Thermo 430951) and imaged on a Bio-Rad ChemiDoc™ Imaging System.
30
Results/Discussion
Previous research from our group has established the conditions that induced the O-GlcNAcylation of HIF-1α protein in breast cancer cells. To further investigate the role of this PTM in HIF biology and oxygen homeostasis, it is important to identify the amino acid residue(s) that is/are subjected to this modification. A combined approach that incorporates cell biology and mass spectrometry was applied to isolate HIF-1α protein and identify the O-GlcNAcylated site(s). Following treatment with 1,10-phenanthroline and PUGNAc, nuclear, and cytoplasmic extract samples were prepared from BoM cells and the protein concentrations were determined by the BCA method. The following table was acquired from the SPECTRAFluor Plus, a fully automatic, computer-controlled fluorescence, absorbance and luminescence instrument used to analyze microplate samples. The values obtained are characterized by light absorbance measured at 562 nm.
31
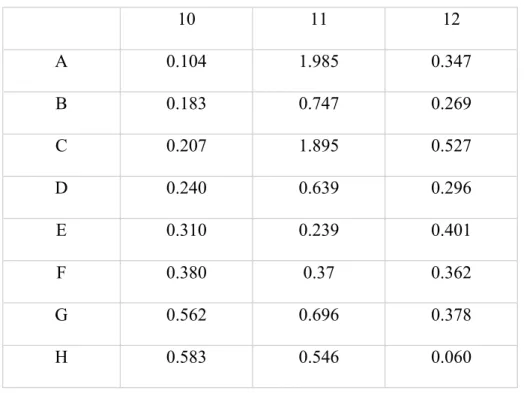
Table 4. Light absorption in 562 nm of micro BCA protein concentration assay of BoM nuclear and cytoplasmic extracts.
10 11 12
A 0.104 1.985 0.347
B 0.183 0.747 0.269
C 0.207 1.895 0.527
D 0.240 0.639 0.296
E 0.310 0.239 0.401
F 0.380 0.37 0.362
G 0.562 0.696 0.378
H 0.583 0.546 0.060
By using a line of best fit, derived from the slope of the standard values, the protein concentrations of nuclear extracts and cytoplasmic extracts were determined:
32
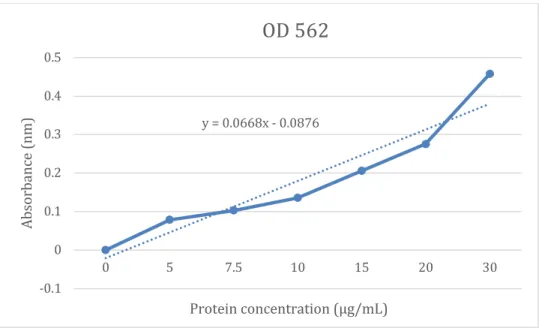
Figure 1. Standard curve from micro BCA protein concentration assay of BoM nuclear and cytoplasmic extracts.
A line of best fit, that was determined from the standard curve, had the linear formula y = 0.0668x - 0.0876; The x and y value represent the protein concentration and absorbance respectively. The formula was then used to calculate the protein concentration from the respective absorption data. These values that correspond with their dilution, either 1:40 or 1:80, were then multiplied by 40 and 80 to obtain the original protein concentration.
The same method was used for the 1:100 dilutions. Protein concentration values obtained from the standard curve linear trendline equation are shown in table 5 and correspond with the data in Table 2 and Table 4.
y = 0.0668x - 0.0876
-0.1 0 0.1 0.2 0.3 0.4 0.5
0 5 7.5 10 15 20 30
Absorbance (nm)
Protein concentration (μg/mL)
OD 562
33
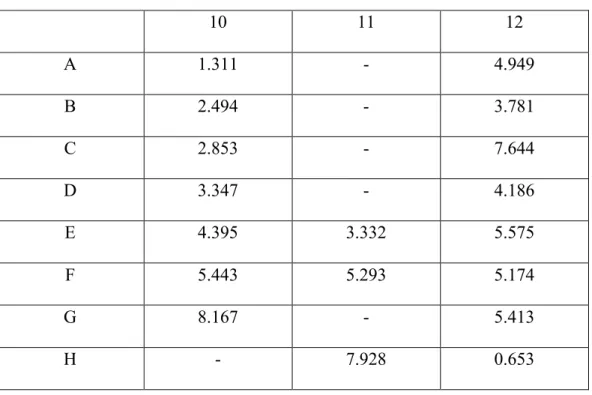
Table 5. Protein concentration calculated using the standard curve trendline equation (y = 0.0668x - 0.0876).
10 11 12
A 1.311 - 4.949
B 2.494 - 3.781
C 2.853 - 7.644
D 3.347 - 4.186
E 4.395 3.332 5.575
F 5.443 5.293 5.174
G 8.167 - 5.413
H - 7.928 0.653
Protein concentration values that correspond with absorbances above 0.583 nm (40 μg/mL) were not utilized in data calculation. This is because the extrapolate will be unreliable. This data indicates that nuclear extracts of both Phen and PUGNAc treated BoM cells contain higher concentration levels of HIF-1α protein compared to the cytoplasmic extracts. However, another separate protein concentration assay should be conducted in order to confirm concentration values to ensure that they are reliable.
To enhance the purity of HIF-1α protein from the immunoprecipitation, the anti- HIF-1α antibody was conjugated to the protein A/G beads by crosslinking using a commercial kit. The HIF-1α protein isolated from the IP procedure was analyzed by Western blot. Both the nuclear extract samples and the elutes from the columns were subjected to SDS-PAGE separation followed by Western blot.
34
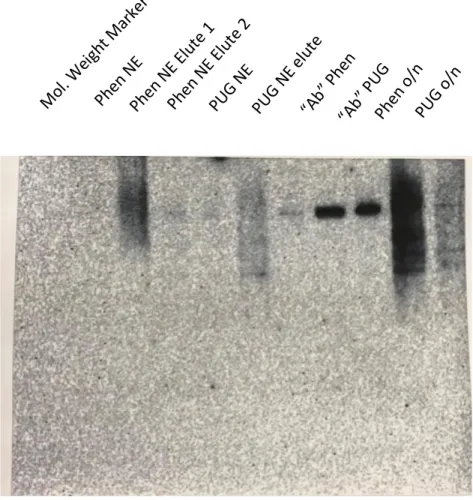
Figure 2. Western blot analysis of HIF-1α in nuclear and cytoplasmic extracts
The molecular weight marker was loaded into lane one, and no band appeared because the marker does not contain HIF-1α proteins. Lanes two through four contained the Phen NE, the first Phen NE elute, and the second Phen NE elute, followed by PUG NE and PUG Elute into lanes five and six, Phen “Ab” and PUG “Ab” into lanes seven and eight, and finally Phen o/n and PUG o/n into the nine and ten lanes. After visualization, it was determined that the results from the Western Blot Analysis of HIF-1α were not as expected. Specifically, we were not able to purify HIF-1α protein in this effort.
The appearance of the bands shown in the elute lanes indicated the presence of antibodies. Ineffective conjugation of the antibody to the protein A/G agarose bead would
Mol. Weight Marker Phen NE
Phen NE Elute 1 Phen NE Elute 2
PUG NE
PUG NE elute
“Ab” Phen
“Ab” PUG Phen o/n
PUG o/n
35
result in the separation of non-crosslinked HIF-1α antibody from the column after centrifugation. This could also indicate that there is an absence of the HIF-1α protein in the lane, which could be accounted to the failed antibody conjugation to the bead. This could also be why the IP lanes do not have much protein. The longer bands shown on the Western blot may have been caused by degradation of the HIF-1α protein. If HIF-1α was degraded, then antibodies would not be able to interact with the protein and no distinct bands would appear. The weak bands may also appear because the crosslinking of antibody to column was not effective and some of the antibody might not have been bound or were detached.
The BoM cells were treated with PUGNAc in order to raise O-GlcNAc levels. In addition, treatment of BoM cells with 1,10-phenanthroline was used as a control to ensure the induction of HIF-1α protein. Both treatments of the NE samples were expected to present HIF-1α bands in the Western blot. If the procedure had produced the results expected, mass spectroscopy would be utilized in order to analyze HIF-1α protein samples to detect O-GlcNAcylation. Even though the first round of this experiment did not turn out as expected, it has laid a foundation for continuation of the project.
36
Conclusion and Future Perspective
There are many anticancer drugs that are aimed at specific molecular targets responsible for, in one way or another, enabling particular capabilities. However, targeting one key pathway may not completely disable a hallmark ability, allowing for the possibility of some cancer cells to survive and eventually adapt to the pressure applied by therapeutic measures. This ultimately sheds a light on the importance of exploring the therapeutic targeting of specific biomolecules that influence multiple hallmarks of cancer. Specifically, the HIF-1α protein subunit, has key roles in the acquisition of multiple hallmark abilities that promote cancer development and survival. As these subunits increase in concentration in cancer cells, more heterodimeric HIFs form, which induces transcriptional activity that allows for metabolic reprogramming, and promotes other hallmarks including, resisting cell death, angiogenesis, and invasion and metastasis. Having a primary effect on the intracellular regulation of HIF-1α in breast cancer cells, O-GlcNAcylation, which stabilizes the protein subunit and allows for maintenance of its transcriptional effects, has been correlated to negative prognoses in these patients. The implications that the process of O- GlcNAcylation has on the regulation of HIF-1α and outcomes of breast cancer patients has drawn attention to exploration of therapeutic targeting. Although the results were not as expected, the completion of this specific procedure for the first time in hopes of establishing usable samples for mass spectroscopy has laid a basis for future endeavors regarding the detection of O-GlcNAcylation in HIF-1α proteins.
37 Bibliography
American Cancer Society | Cancer Facts & Statistics. (n.d.). Retrieved March 12, 2019, from https://cancerstatisticscenter.cancer.org/#!/cancer-site/Breast
Breast cancer. (2019, January 10). Retrieved March 10, 2019, from https://www.mayoclinic.org/diseases-conditions/breast-cancer/diagnosis- treatment/drc-20352475
Breast Cancer Statistics. (2018, September 07). Retrieved March 12, 2019, from https://www.bcrf.org/breast-cancer-statistics
Cancer Classification. (n.d.). Retrieved March 10, 2019, from https://training.seer.cancer.gov/disease/categories/classification.html
Chen, F., Zhuang, X., Lin, L., Yu, P., Wang, Y., Shi, Y., Hu, G., & Sun, Y. (2015).
New horizons in tumor microenvironment biology: challenges and opportunities. BMC Medicine, 13, 45. doi:10.1186/s12916-015-0278-7
DeBerardinis, R. J., &, Chandel, N. S. (2016). Fundamentals of cancer metabolism.
Science Advances, 2(5), e1600200. http://doi.org/10.1126/sciadv.1600200 Degenhardt, K., Mathew, R., Beaudoin, B., Bray, K., Anderson, D., Chen, G.,
Mukherjee, C., Shi, Y., Gélinas, C., Fan, Y., Nelson, D. A., Jin, S., & White, E.
(2006). Autophagy promotes tumor cell survival and restricts necrosis, inflammation, and tumorigenesis. Cancer Cell, 10(1), 51–64.
doi:10.1016/j.ccr.2006.06.001
Exploring cancer proliferative signaling pathways [PDF]. (2015). Thermo fisher
SCIENTIFIC Inc. Retrieved from
https://www.thermofisher.com/content/dam/LifeTech/global/promotions/globa l/images/aai-2015/aai-pdfs/CancerProliferativePathwaysHandbook-r2.pdf Ferrer, C. M., Lynch, T. P., Sodi, V. L., Falcone, J. N., Schwab, L. P., Peacock, D. L.,
Vocadlo, D. J., Seagroves, T. N., & Reginato, M. J. (2014). O-GlcNAcylation regulates cancer metabolism and survival stress signaling via regulation of the HIF-1 pathway. Molecular Cell, 54(5), 820–831.
doi:10.1016/j.molcel.2014.04.026
Gilkes, D. M., & Semenza, G. L. (2013). Role of hypoxia-inducible factors in breast cancer metastasis. Future oncology (London, England), 9(11), 1623–1636.
doi:10.2217/fon.13.92
Hanahan, D., & Weinberg, R. A. (2011). Hallmarks of Cancer: The Next Generation.
Hallmarks of Cancer: The Next Generation, Cell 144(5), 646-674. doi:
https://doi.org/10.1016/j.cell.2011.02.013
Kietzmann, T., Mennerich, D., & Dimova, E. Y. (2016). Hypoxia-Inducible Factors (HIFs) and Phosphorylation: Impact on Stability, Localization, and Transactivity. Frontiers in Cell and Developmental Biology, 4, 11.
doi:10.3389/fcell.2016.00011
Kang, Y., Siegal, P. M., Shu, W., Drobnjak, M., Kakonen, S. M., Cordón-Cardo, C., Guise, T. A., Massagué, J., (2003). A multigenic program mediating breast cancer metastasis to bone. Cancer Cell, 3(6), 537-49. doi:
https://doi.org/10.1016/S1535-6108(03)00132-6
Keith, B., Johnson, R. S., & Simon, M. C. (2011). HIF1α and HIF2α: sibling rivalry in hypoxic tumour growth and progression. Nature Reviews. Cancer, 12(1), 9–22.
doi:10.1038/nrc3183
38
Liu, Z. J., Semenza, G. L., & Zhang, H. F. (2015). Hypoxia-inducible factor 1 and breast cancer metastasis. Journal of Zhejiang University. Science. B, 16(1), 32–
43. doi:10.1631/jzus.B1400221
Lundgren K, Holm C, Landberg G. (2007). Hypoxia and breast cancer: prognostic and therapeutic implications. Cellular and Molecular Life Sciences, ;64(24):3233–
3247. doi:10.1007/s00018-007-7390-6.
Ma, J., & Hart, G. W. (2017). Analysis of Protein O-GlcNAcylation by Mass Spectrometry. Current Protocols in Protein Science, 87, 24.10.1–24.10.16.
doi:10.1002/cpps.24
Ma, J., & Hart, G. W. (2014). O-GlcNAc profiling: from proteins to proteomes.
Clinical Proteomics, 11(1), 8. doi:10.1186/1559-0275-11-8
Muz, B., de la Puente, P., Azab, F., & Azab, A. K. (2015). The role of hypoxia in cancer progression, angiogenesis, metastasis, and resistance to therapy. Hypoxia (Auckland, N.Z.), 3, 83–92. doi:10.2147/HP.S93413
Nishida, N., Yano, H., Nishida, T., Kamura, T., & Kojiro, M. (2006). Angiogenesis in Cancer. Vascular Health and Risk Management, 2(3), 213–219.
Overview of Post-Translational Modification. (n.d.). Retrieved April 10, 2019, from https://www.thermofisher.com/us/en/home/life-science/protein-
biology/protein-biology-learning-center/protein-biology-resource-
library/pierce-protein-methods/overview-post-translational-modification.html Padua, D., Zhang, X. H., Wang, Q., Nadal, C., Gerald, W. L., Gomis, R. R., &
Massagué, J. (2008). TGFbeta primes breast tumors for lung metastasis seeding through angiopoietin-like 4. Cell, 133(1), 66–77.
doi:10.1016/j.cell.2008.01.046
Semenza G. L. (2017). A compendium of proteins that interact with HIF-1α.
Experimental Cell Research, 356(2), 128–135.
doi:10.1016/j.yexcr.2017.03.041
Semenza GL. (2012). Hypoxia-inducible factors: mediators of cancer progression and targets for cancer therapy. Trends Pharmacol Sci.;33(4):207–214. doi:
10.1016/j.tips.2012.01.005.
Semenza G. L. (2015). The hypoxic tumor microenvironment: A driving force for breast cancer progression. Biochimica et Biophysica acta, 1863(3), 382–391.
doi:10.1016/j.bbamcr.2015.05.036
Soysal S.D., Tzankov A., Muenst S.E. (2015). Role of the tumor microenvironment in Breast Cancer. Pathobiology, 82(3-4), 142-152. doi:
https://doi.org/10.1159/000430499
Wang, G. L., Jiang, B. H., Rue, E. A., & Semenza, G. L. (1995). Hypoxia-inducible factor 1 is a basic-helix-loop-helix-PAS heterodimer regulated by cellular O2 tension. Proceedings of the National Academy of Sciences of the United States of America, 92(12), 5510–5514.
Wang, M., Zhao, J., Zhang, L., Wei, F., Lian, Y., Wu, Y., Gong, Z., Zhang, S., Zhou, J., Cao, K., Li, X., Xiong, W., Li, G., Zeng, Z., & Guo, C. (2017). Role of tumor microenvironment in tumorigenesis. Journal of Cancer, 8(5), 761–773.
http://doi.org/10.7150/jca.17648