Identifying Gene Regulatory Activity Divergence in Cis and Trans with ATAC-STARR-seq
By
Tyler John Hansen
Dissertation
Submitted to the Faculty of the Graduate School of Vanderbilt University
in partial fulfillment of the requirements for the degree of
DOCTOR OF PHILOSOPHY in
Biochemistry May 12th, 2023 Nashville, Tennessee
Approved:
Vito Quaranta, M.D.
Scott Hiebert, Ph.D.
Manuel Ascano Jr., Ph. D.
Emily Hodges, Ph.D.
John Anthony Capra, Ph.D.
ii
Copyright © 2023 by Tyler John Hansen All Rights Reserved
iii
To my brilliant and loving wife, Emili To my wonderful kids
and
To my amazing parents
Thank you for everything
iv
ACKNOWLEDGEMENTS
Outside of family, it is hard to come up with a more important relationship than that of a trainee and their PhD advisor. I want to thank my advisor, Dr. Emily Hodges for an enjoyable, exciting, and truly inspiring experience in her lab. I have learned so much from Emily about conducting science, communicating science, and selling yourself and your project to others.
There are so many lessons that Emily has taught me that have made me a much better scientist and will help me succeed in the future. “If it can work a little then it can work a lot” and “we don’t look for a needle in the haystack, we define the haystack” are words of wisdom that I will always live by and carry with me for the rest of my career. Emily was also very gracious with her patience and care towards my personal life, which, with getting married and having two kids, always seemed to change. This change, while exciting, led to a lot of trial and error on figuring out how balance my PhD work with all the important new responsibilities I acquired at home. I’d like to say I’ve found a good balance, and this would not have been possible without Emily’s kindness, understanding, and patience.
I want to also thank all members of the Hodges lab for being great people and always making lab a great place to be. Special thank you to Tim Scott and Lindsey Guerin for all the coffee runs, lunch trips, and great conversations we had over the years; grad school was tough, and I could not have made it through without you two. I also want to thank other current and former Hodges Lab members—Kelly Barnett, Kritika Singh, Verda Agan, Adam Miranda, Jonathan Attalla, Elizabeth Dorans, Ali Wilt, and Doug Shaw—for all of their great ideas over the years. You guys inspire me to great science, thank you.
Thank you to Sarah Fong and Tony Capra, who collaborated with me on Chapter III of this dissertation. Thank you for being great scientists, good people, and giving this project your
v
all. It was a truly complicated project and would not be anywhere near as impactful as it is today without your intellectual and analytical contributions. Even from two time zones away, our weekly meetings were often the highlight of my week and I hope we have another opportunity to work together sometime.
Thank you to the core group of friends I’ve made during my time in graduate school:
James Held, Payam Fathi, Hillary Layden, Helen Parrington, and Logan Richards. Spending time with you guys has always been fun. We have made a lot of great memories that I will cherish forever. Thank you in particular to James helping me in so many ways during Grad school. From talking to police after my house was broken into (just three days before my wedding day) to taking care of Henry at 3am so that Emili and I could go to the hospital and have our second baby. You are one of the best people I know, thank you for everything.
Part of what made my PhD experience special was the fantastic community of the Biochemistry Department. Thank you to the faculty leadership and all current and former
members of the Biochemistry Student Association for working so hard to make this department a wonderful place to do science. Thank you to Sam Lisy, Lindsay Redman Rivera, Robert Mann, Caroline Wiser, Stephen Clark, Yelena Perevalova, Sarah Arcos, Katie Rothamel, Kavi Mehta, Tata Kavlashvili, Juan Carvajal-Garcia, Kaitlyn Browning, Anna Johnson, Ronan Bracken, Monica Bomber, Vincent Yao, Kate Clowes, Nicky Eleuteri, Colby Tubbs and so many other new colleagues I made over the years. You all are so genuinely kind and talented individuals. I hope I can maintain contact with you all throughout my career.
The scientific aspect of this project would not have been possible without the help and guidance of several individuals. Thank you to my committee—Vito Quaranta, Scott Hiebert, Manny Ascano, Tony Capra, and Emily Hodges—for always challenging me and keeping me on
vi
the right path. Thank you also to Amanda Lea for providing feedback on the cis/trans project (Chapter III) and for her kindness and generosity in many other respects—I’m not sure I would have gotten my dream postdoc without her. Other faculty I’d like to thank are Yi Ren, Breann Brown, Dave Cortez, and Bill Tansey. You are great scientists and good people—know that I look up to you as role models and hope to be like you one day.
Thank you to all of my previous teachers and mentors since my scientific journey began:
Angie Midthun-Hensen, Ryan Olson, Barbara Bielec, Judith Kimble, Aaron Kershner, Amy Groth, Andy Golden, Harold Smith, and Aimee Jaramillo-Lambert. You all played such an important role in my early career, and it was your kindness, generosity, and patience that allowed me to discover my passion for science—thank you so much.
Last and most importantly, I want to thank my family for their love, support, and patience during my time in graduate school. The life of an academic is not easy on family—there are long nights, limited options of cities to live in, and constant distractions that make it easy to lose focus on non-work things—thank you for your flexibility and understanding as I tried to figure out how to balance my work life with my family life. Thank you to my parents for your constant love and support and always motivating me to follow my dreams, even though that took me out of Wisconsin. Thank you to my brother, Ben, and my sister, Jenna, for your love and all the fun we have had over the years. I enjoy hearing about all the amazing things you two do. Thank you to my kids for being the absolute joy of my life. Thank you to my wife, Emili, for her
unconditional love and her ability to always be optimistic, no matter the circumstance. You inspire me to be a better person every day and I’m so lucky to have you in my life.
vii
TABLE OF CONTENTS
Page
ACKNOWLEDGEMENTS ... iv
LIST OF TABLES ... viii
LIST OF FIGURES ... ix
I. Introduction ... 1
DNA Regulatory Elements in the Human Genome ... 1
Epigenetic Control of DNA Regulatory Elements ... 3
Profiling DNA Regulatory Element Activity ... 6
Gene Regulatory Divergence Between Species ... 10
Gene Regulatory Divergence in Cis and Trans ... 13
Scope of Dissertation ... 18
II. ATAC-STARR-seq Reveals Transcription Factor-Bound Activators and Silencers Across the Chromatin Accessible Human Genome ... 20
Introduction ... 20
Results ... 22
Discussion ... 54
Materials & Methods ... 60
III. Human Gene Regulatory Evolution is Driven by the Divergence of Regulatory Element Function in Both Cis and Trans ... 78
Introduction ... 78
Results ... 81
Discussion ... 113
Materials & Methods ... 118
IV. Discussion and Future Directions ... 138
Discussion ... 138
Future Directions ... 142
Summary ... 148
V. References ... 150
viii
LIST OF TABLES
Table Page
1. A comparison of experimental differences and result metrics between accessible
chromatin coupled to STARR-seq techniques ... 26
2. ATAC-STARR-seq sequencing summary statistics ... 31
3. Genrich peak counts for varying FDR thresholds... 31
4. Oligo sequences used in ATAC-STARR-seq and qPCR. ... 63
ix
LIST OF FIGURES
Figure Page
1. Schematic of enhancer concepts ... 4
2. Cis and trans modes of divergence in gene regulatory element activity for both gains and losses in activity ... 15
3. Schematic of the ATAC-STARR-seq methodology ... 24
4. ATAC-STARR Optimization ... 28
5. Characterization of ATAC-STARR sequencing libraries... 29
6. Correlation between ATAC-STARR-seq replicates ... 30
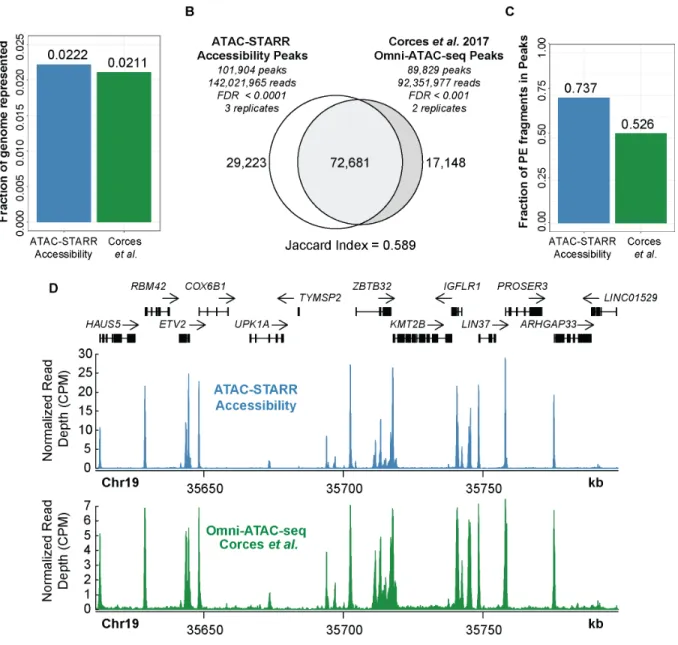
7. ATAC-STARR-seq accurately quantifies chromatin accessibility... 33
8. ATAC-STARR-seq quantifies regulatory activity within accessible chromatin ... 35
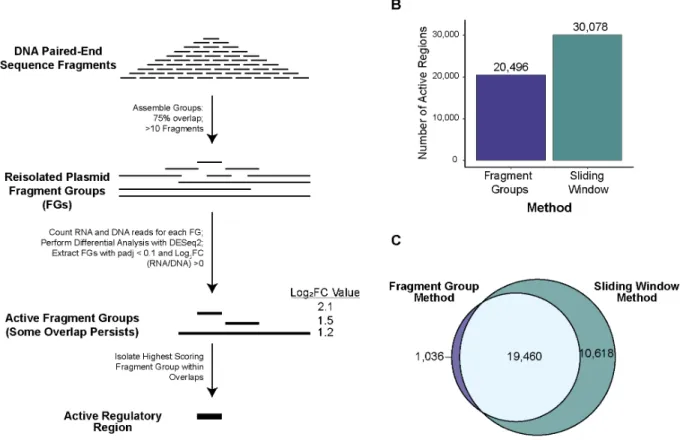
9. Comparison between the sliding window and the fragment group active region calling methods ... 36
10. Analysis of replicate count on region calling sensitivity ... 37
11. Comparison between keeping duplicates and removing duplicates to call active regions 39 12. Effect of fragment length on regulatory region calls ... 42
13. Regulatory regions defined by ATAC-STARR exhibit annotations, histone modifications, and TFs characteristic of their function ... 44
14. Assessment of potential orientation bias in ATAC-STARR-seq data. ... 46
15. Additional characterization of ATAC-STARR-seq regulatory regions ... 48
16. ATAC-STARR-seq identifies transcription factor footprints ... 50
17. TF footprints stratify ATAC-STARR-defined regulatory regions into gene regulatory networks. ... 53
18. Comparative ATAC-STARR-seq produces a multi-layered view of human and macaque gene regulatory divergence ... 82
19. Differential accessibility analysis, TF footprinting, and ATAC-STARR-seq quality control ... 83
20. Support of differential activity calls ... 86
21. Cis and trans gene regulatory divergence occur at similar frequencies ... 87
22. Most species-specific regulatory differences are driven by changes in both cis and trans ... 91
23. Additional functional characteristics of cis only, trans only, cis & trans, and conserved active region sets ... 92
24. GM12878 and LCL8664 cells are transcriptionally similar to each other and primary B cells ... 98
x
25. Trans only regions are bound by differentially expressed TFs ... 99 26. Cis only, trans only, and cis & trans regions have different degrees of conservation,
acceleration, and transposable element enrichment ... 101 27. Additional evolutionary analysis of cis only, trans only, cis & trans and conserved active
regions ... 102 28. A human accelerated cis only element regulates NLRP1 expression ... 108 29. Cis only, trans only, and cis & trans regions are similarly enriched for genetic variation
associated with UKBB traits ... 109 30. A single substitution may drive differential expression of ETS1 by perturbing RUNX3
binding in macaques ... 112
1 CHAPTER I
INTRODUCTION
DNA Regulatory Elements in the Human Genome
With few exceptions, all life on earth uses the same fundamental mechanism to express genes: DNA is transcribed into messenger RNA (mRNA), which is then translated into proteins.
This process, called gene expression, controls the uniqueness of species and how hundreds of specialized cell types can be made from a single genome. The initial regulatory steps of transcription are critically important in tightly controlling gene expression programs in the cell. In particular, non-coding cis-regulatory DNA sequences in the genome, called DNA regulatory elements, control which genes are transcribed and how many mRNA transcripts are made (Andersson & Sandelin, 2019; Haberle & Stark, 2018; Heinz, Romanoski, Benner, & Glass, 2015;
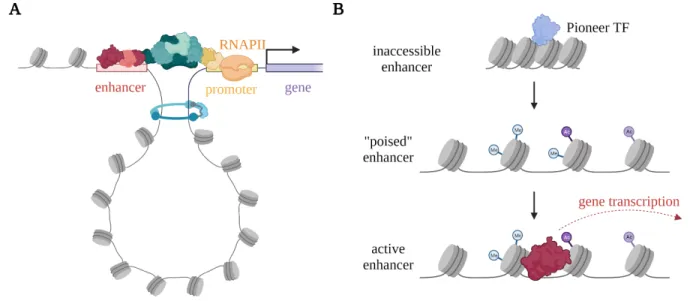
Long, Prescott, & Wysocka, 2016; Rickels & Shilatifard, 2018). To actively regulate transcription, DNA regulatory elements are bound by transcription factors (TFs), which, through complex biochemical interactions and biophysical phase separation mechanisms, recruit regulatory complexes that affect transcription of nearby target genes (Figure 1A) (Haberle & Stark, 2018;
Peng, Li, & Xu, 2020; Ptashne, 1967, 1986). Because the activity of DNA regulatory elements control which and how much genes are transcribed, DNA regulatory element activity dictates cellular identity, including both maintenance of cell identity and determination of cell fate during differentiation (Corces et al., 2016; Heinz et al., 2015). For this reason, global DNA regulatory element dysfunction can drive diseases where cells adopt new identities, fail to differentiate completely, or differentiate incorrectly. For example, the mis-regulation of DNA regulatory
2
elements can drive neoplastic transformation and cause a variety of cancers (Bradner, Hnisz, &
Young, 2017; Smith & Shilatifard, 2014).
Promoters & Enhancers
DNA regulatory elements can be classified into many categories. Promoters and enhancers are two types of positive DNA regulatory elements that, when active, drive transcription of their target genes. Promoters and enhancers are functionally similar overall (Andersson, Sandelin, &
Danko, 2015), but they differ in a few key ways. First, promoters exist directly upstream of the genes they regulate while enhancers are located distal to their target genes and can exist in any orientation because they can be brought into close proximity via 3D chromatin looping mechanisms (Figure 1A) (Andersson & Sandelin, 2019; Panigrahi & O'Malley, 2021; Schaffner, 2015). Because they are unrestricted by target gene distance and because they lack consensus DNA sequence motifs, such as a TATA box or initiator sequence, it is challenging to identify enhancers in the human genome (Long et al., 2016). Nonetheless, significant efforts from ENCODE, FANTOM, and other consortia using different enhancer identification methods have discovered over 1 million putative enhancers in the human genome for hundreds of tissues and cell types (Abugessaisa et al., 2021; The ENCODE Project Consortium et al., 2020; Wang et al., 2019).
Promoters and enhancers also differ in the types of genes they regulate in the human genome. In general, genes regulated only by promoters are constitutively expressed and are associated with housekeeping functions in the cell, whereas enhancers regulate genes associated with cell-type specific functions (Long et al., 2016). In this way, enhancers control cell fate and identity to a much greater extent than promoters. Alterations to enhancer function can cause disease and are thought to drive the development of complex, polygenic diseases (Herz, 2016;
3
Maurano et al., 2012; Smith & Shilatifard, 2014). Understanding where enhancers are in the human genome and how they function is vital for identifying the genetic causes of many common debilitating complex, polygenic diseases like Crohn’s disease.
Silencers
Another class of DNA regulatory elements called silencers actively repress gene expression. In principle, they act similar to promoters and enhancers, but they instead are bound by TFs that repress transcription of nearby target genes (Pang, van Weerd, Hamoen, & Snyder, 2022). Like enhancers, silencers are challenging to identify because they lack consensus DNA sequence motifs and can be located distal from the genes they regulate. Furthermore, it is difficult to discern whether a gene is inactive due to the activity of silencers or other silencing mechanisms because silencers are just one mechanism for repressing gene expression. This makes silencers much more difficult to identify than enhancers, so they remain a critically understudied component in the transcriptional regulation field. While recent efforts have been made to identify silencers in the human genome, these studies have not been performed at consortia-like scales, so a comprehensive evaluation of silencers in the human genome is also lacking. Some assays that identify putative enhancers may also identify silencers, but the lack of quantitative measures on regulatory activity—i.e. how much target gene transcription they drive—makes it difficult to discern whether these regions have positive or negative effects on gene transcription.
Epigenetic Control of DNA Regulatory Elements
DNA regulatory elements themselves can be regulated. In eukaryotes, genomic DNA is tightly bound to nucleosomes, which are octameric complexes of histone proteins (Klemm, Shipony, & Greenleaf, 2019). The majority of DNA is tightly wound up by nucleosomes into
4
structures called heterochromatin, which, by steric hindrance, prevents most proteins from binding.
In any given cell type, only ~2% of genomic DNA is accessible to TFs, so most human DNA regulatory elements are not active (Klemm et al., 2019). Furthermore, accessibility is only one layer of control, other processes prevent DNA regulatory elements from being bound by TFs and driving transcription of their target genes, so DNA regulatory elements exist in several distinct functional chromatin states (Figure 1B) (Atlasi & Stunnenberg, 2017).
As the first layer of regulatory control, accessibility is mediated by pioneer transcription factor binding; pioneer TFs bind short DNA sequences exposed on the outside of nucleosomes (Cirillo et al., 2002; Soufi et al., 2015). Pioneer TFs “open” DNA by recruiting chromatin remodelling complexes, such as SWI/SNF, which eject nucleosomes from the locus substantially reducing the level of steric hinderance imposed by the bound nucleosomes (Wolf et al., 2023).
Figure 1: Schematic of enhancer concepts. (A) Enhancers interact with their target genes via chromatin looping. The TFs that bind enhancers interact with coactivators which regulate transcription initiation and RNAPII pause release. (B) Enhancers exist in three broad chromatin states: inaccessible, poised, and active.
Only active enhancers, by binding TFs, drive transcription of their target genes. Poised enhancers are accessible but not active. They can contain several epigenetic modifications that are associated with active enhancers.
5
Once accessible, epigenetic features of DNA regulatory elements can be modified by a variety of epigenetic modifiers; this includes demethylation of DNA, post transcriptional modifications to histone tails, and many other biochemical modifications (Atlasi & Stunnenberg, 2017; Gasperini, Tome, & Shendure, 2020). Whether these epigenetic features are required for regulatory element activity remains a controversial question in the field (Morgan & Shilatifard, 2020), and recent work suggests many of them are generally dispensable for activity (Barnett et al., 2020; Dorighi et al., 2017; Douillet et al., 2020; Kreibich, Kleinendorst, Barzaghi, Kaspar, & Krebs, 2023;
Rickels et al., 2017; Zhang, Zhang, Dong, Xiong, & Zhu, 2020). The distinct overlap of these marks can be used to place DNA regulatory elements into over a dozen different functional states (Ernst & Kellis, 2012; The ENCODE Project Consortium et al., 2020). While this many different chromatin states nicely demonstrates the vast complexity of this process and can be useful in other contexts, this level of detail can be overwhelming. For simplification purposes, inactive DNA regulatory elements that are accessible and contain various combinations of these epigenetic features are generally designated as “poised” regulatory elements.
In contrast, “active” DNA regulatory elements are both accessible and actively drive transcription of their target genes. Compared to the other functional chromatin states, active DNA regulatory elements play the most direct role on gene expression, so identifying them is important for understanding which genomic loci regulate a given cell identity. While several assays can profile which DNA regulatory elements are accessible, discerning whether accessible elements are
“active” is a vitally important distinction to make when identifying which non-coding DNA sequences dictate cell identity and cause specific diseases when dysfunctional.
6
Profiling DNA Regulatory Element Activity Epigenetic Annotations
There are several approaches to identify DNA regulatory elements in the human genome.
Promoters can be easily identified based on their fixed, proximal distance to the genes they regulate, but enhancers are much more difficult to identify. One of the first approaches to identify enhancers used a comparative genomics framework to identify regions of high sequence conservation (Lindblad-Toh et al., 2011). This approach can yield many genomic regions with functional constraint, but they cannot determine which DNA regulatory elements are used by a particular cell type or whether the DNA regulatory region has an activating, silencing, or neutral effect on gene expression. Therefore, assays that functionally characterize the genome, collectively called “functional genomic methods” are required to identify the enhancers driving gene expression programs that yield a given cell type.
One of the most common functional genomic methods to identify putative enhancers is to profile the genome for epigenetic marks associated with enhancer activity. This approach uses the presence of distinct combinations of epigenetic marks to infer DNA regulatory element activity and function. For example, a common approach is to profile the genome for the three histone modifications H3K27ac, H3K4me1, and H3K4me3 (Rada-Iglesias et al., 2011). The relative abundance of these epigenetic marks classifies DNA regulatory elements into active enhancers, active promoters, poised enhancers, and poised promoters (Creyghton et al., 2010; Villar et al., 2015). Another approach classifies enhancers as non-promoter regions of bidirectional transcription using either PRO-seq or CAGE-seq to demarcate sites of RNA polymerase II (RNAPII) engagement (Abugessaisa et al., 2021; Andersson et al., 2014). Approaches like these are convenient, because they reflect the endogenous state of the DNA regulatory element and
7
leverage well-defined methods. However, they do not directly measure enhancer activity, but rather infer it by association with these marks. Furthermore, there is disagreement on which epigenetic marks most accurately identify active enhancers, so many enhancer studies define enhancers differently. This is problematic because use of different epigenetic marks yields enhancer sets that do not agree with each other in terms of their identity, the number of active enhancers called overall, and their evolutionary and functional characteristics (Benton, Talipineni, Kostka, & Capra, 2019). While these approaches are unquestionably useful for identifying candidate enhancers, the lack of a direct functional measure of enhancer activity may cause them to be misleading. This approach may be substantially more accurate in the future when studies into the biochemical mechanisms of enhancer-mediated transcription uncover better molecular identifiers of active DNA regulatory elements.
Massively Parallel Reporter Assays
The initial characterization of enhancers described them as DNA sequences capable of driving transcription of a plasmid reporter gene irrespective of its orientation or distance to the gene (Banerji, Olson, & Schaffner, 1983). This description led to the development of reporter assays as tools to identify enhancers in the human genome (Sadowski, Ma, Triezenberg, &
Ptashne, 1988; Triezenberg, LaMarco, & McKnight, 1988). In these assays, a single candidate test sequence is cloned into a transcriptional reporter plasmid and assayed for its ability to drive transcription of the reporter gene. This approach, however, is low throughput since only one DNA sequence is tested at a time. For this reason, Massively Parallel Reporter Assays (MPRAs), which leverage next-generation sequencing, were developed to test the regulatory activity of thousands of DNA sequences at once in order to identify putative DNA regulatory elements in a high-
8
throughput manner (Melnikov et al., 2012; Patwardhan et al., 2009; Santiago-Algarra, Dao, Pradel, Espana, & Spicuglia, 2017). One advantage of MPRAs is that, unlike the epigenic profiling methods described above, they directly measure regulatory activity. To do this, MPRAs clone candidate DNA sequences into a reporter plasmid on a massively parallel scale. This resulting plasmid library is transfected into cells and all candidate sequences are assayed for regulatory activity at once. MPRAs vary in design, but all follow the same overall logic. The test sequences that have regulatory activity drive transcription of the reporter gene and yield “reporter RNAs”
which are sequenced and matched to their associated test sequence. Their abundance in the reporter RNA pool is normalized to their abundance in the plasmid DNA input, and the greater reporter RNA to plasmid DNA ratio, the more active the test sequence (Santiago-Algarra et al., 2017).
While MPRAs directly measure the ability of a DNA sequence to drive transcription, they too have limitations. By removing DNA sequence from their native environment and placing them within a plasmid reporter, MPRAs are exogenous assays and it is hard to know for certain if their activity on a plasmid recapitulates their activity at their endogenous locus. To circumvent this issue, several groups have conducted “lenti-MPRAs” which insert reporter constructs into chromatin using lentivirus particles (Inoue et al., 2017). While some differences in regulatory activity were observed between integrated and non-integrated MPRAs, overall, the results are largely similar. Furthermore, the lenti-MPRA approach is confounded in that the insertion site is a different chromatin landscape from the endogenous locus. Moreover, some applications are not amenable to lentiviral integration and for the ones that are, they require additional experimental steps that can prove to be tricky. It therefore does not appear that the improvements in accuracy outweigh the technical challenges when considering a lentiviral versus episomal approach. In most cases, it seems that an episomal MPRA is sufficient.
9
There are many types of episomal MPRAs, each tailored to a specific purpose. Self- transcribing active regulatory region sequencing (STARR-seq) is one type of MPRA that is uniquely designed to assay an entire genome for regulatory activity (Arnold et al., 2013; Inoue et al., 2017; Kircher et al., 2019; Maricque, Dougherty, & Cohen, 2017; Melnikov et al., 2012;
Muerdter et al., 2018; Patwardhan et al., 2012). STARR-seq quantifies regulatory activity genome- wide by cloning randomly fragmented genomic DNA into the 3’UTR of the reporter plasmid.
Because the test sequence is contained within the 3’UTR of the reporter RNAs that are produced, active DNA regulatory elements will drive transcription of themselves, so activity is quantified by the abundance of DNA regulatory element sequences within the reporter RNA pool.
STARR-seq, which was developed for use in the Drosophila melanogaster genome, is a tremendously elegant approach, but has major limitations when applied to the human genome.
Because the human genome is about 20 times larger than the Drosophila genome, it is technically challenging to accommodate all 3 billion base pairs of human DNA in one assay. Whole human genome STARR-seq requires large-scale cloning procedures and can only produce shallow sequencing coverage of human regulatory elements (Johnson et al., 2018). In addition, STARR- seq assays both accessible and inaccessible chromatin. Because only 2% of the human genome is accessible in any given cell type, ~98% of all regions assayed in whole human genome STARR- seq are inaccessible and therefore inactive endogenously (Klemm et al., 2019). In this way, nearly all of the regulatory information provided by this approach is for regions that would not drive transcription of nearby genes in their endogenous chromatin state. Therefore, most reads map to inaccessible chromatin so that whole human genome STARR-seq is overall inefficient.
Because of this limitation, recent methods have been developed to reduce the scope of the assay to accessible chromatin. These approaches, HiDRA and FAIRE-STARR-seq, accomplished
10
this by combining STARR-seq with techniques that capture accessible chromatin to specifically test the regulatory potential of accessible DNA (Chaudhri, Dienger-Stambaugh, Wu, Shrestha, &
Singh, 2020; Glaser et al., 2021; X. Wang et al., 2018). As a result, these methods only sample 2%
of the human genome while assaying nearly all regulatory elements capable of driving transcription endogenously. This approach enables deeper sequencing coverage of all biologically relevant regulatory regions.
Although HiDRA and FAIRE-STARR-seq have been performed previously, they have not been characterized in-depth or developed to their full capability. Because these assays combine accessibility and regulatory activity methods, they have the potential to reveal multiple levels of gene regulatory information simultaneously, but this potential has not been explored. Additionally, important parameters of these methods, such as effects from query sequence length, effects from orientation of insert on plasmid, and the development of an optimal data analysis strategy have not been investigated. These methods, like most other MPRA approaches, have also largely ignored detection of silencing activity, even though, in theory, they could identify silencers. Altogether, these approaches require better characterization and an expansion of their capabilities to address difficult questions in transcriptional regulation, such as profiling of gene regulatory divergence between species.
Gene Regulatory Divergence Between Species
Humans are among the most complex organisms on earth, yet we have the same number of genes as Caenorhabditis elegans, a substantially less complex organism that is only made up of 959 total somatic cells (Kimble & Hirsh, 1979; Sulston & Horvitz, 1977; Sulston, Schierenberg, White, & Thomson, 1983). So how are humans so different from C. elegans if the number of genes
11
is the same? In general, the complexity of the human species arises from drastically different levels of gene regulation. At every step from gene to protein, humans have extremely complex and expansive gene regulatory mechanisms when compared to simpler species like C. elegans (Ledford, 2008). This increased regulatory complexity, due in large part to an increased size of the non-coding genome, allows humans to generate over a million different proteins from the ~20,000 genes encoded in the human genome (Aebersold et al., 2018). Furthermore, these regulatory processes fine-tune the amounts of those proteins, so that over 200 different cell types can be produced from the same genome (Heinz et al., 2015). In addition, this increased complexity, allows for highly specialized processes like adaptive immunity to exist. As species become more closely related, such as in the case of humans and non-human primates, the complexity of their gene regulatory mechanisms is much more similar. In this case, the phenotypic differences are determined largely by divergent use of the same gene regulatory processes rather than in the proteins and the regulatory pathways that make them up.
Differences in gene expression control phenotypic changes between humans and non- human primates
In 1971, Britten and Davidson proposed that phenotypic changes between organisms may be driven primarily by changes in expression of gene rather than changes in their identity (Britten
& Davidson, 1971; King & Wilson, 1975). Four years later, Mary-Claire King and Allan Wilson famously extended this hypothesis to phenotypic differences between humans and chimpanzees.
They noted that there are not enough changes in protein sequences to explain the differences in phenotype, and therefore proposed that alterations to gene regulation is what drove evolution of humans from our most recent common chimpanzee ancestor over 8 million years ago. This
12
hypothesis is attractive because many of the genes involved in human-specific phenotypes, particularly those related to morphology, are pleiotropic and important for several other biological processes, including development. By changing the regulation of genes, one can alter their expression in only one cell type. Whereas changing the sequence of the gene itself will alter its overall function in all cell types. In other words, changes in gene regulation provide a better mechanism for fine-tuning gene expression to adapt and evolve phenotypes that improve overall fitness than changing protein coding sequences (Reilly & Noonan, 2016).
Since 1975, this gene regulatory hypothesis has largely been validated by several studies.
Most convincingly, a survey of gene expression levels between similar cell types across primate species reveals phylogenetic relationships that accurately reflect the true evolutionary relationships between species (Brawand et al., 2011). Interestingly, the degree of gene expression divergence between two closely related species varies widely across different cell types and tissues, which is likely due to different functional constraints on the biological function of each tissue (Reilly &
Noonan, 2016). In addition, gene expression levels between species of the same cell type are much more similar than gene expression levels between cell types of the same species indicating that cell-type specific gene expression changes are favored over pleiotropic changes that effect many cell types (Brawand et al., 2011). Critically, most gene expression does not need to change in order to produce a phenotypic outcome, as only ~10-39% of genes display divergent expression depending on the cell types and species that are being compared (Brawand et al., 2011; Reilly &
Noonan, 2016).
13
Differential Enhancer Activity Drives Gene Expression Divergence Between Species
The changes in gene expression across species are ultimately caused by changes in gene regulation, which are primarily mediated by changes in DNA regulatory element activity. Several studies have compared epigenetic profiles of DNA regulatory elements between similar cell types across species. In general, changes in epigenetic modifications correlate with changes in gene expression (Cain, Blekhman, Marioni, & Gilad, 2011; Zhou et al., 2014), with one study finding that divergent epigenetic profiles explain ~42% of the gene expression variance between humans and chimpanzee lymphoblastoid cell lines (Zhou et al., 2014). Because gene expression changes between primate species are cell-type specific, regulatory activity divergence more often occurs at enhancers than promoters (Villar et al., 2015). Altogether, differential regulation of enhancers drives differences in gene expression that produce species-specific phenotypes.
Gene Regulatory Divergence in Cis and Trans
Changes in gene regulation can occur in either cis or in trans. How these two terms are defined depend on what the unit of measure is, but broadly, cis changes are local substitutions to the nearby DNA sequence, whereas trans changes are global, cell environment changes to diffusible products, like transcription factors (Hill, Vande Zande, & Wittkopp, 2020; Signor &
Nuzhdin, 2018; Vande Zande, Hill, & Wittkopp, 2022). These two modes of change are very different approaches of altering gene regulation to adapt to a given environmental stress. Because cis changes are local and typically only affect the expression of one gene, their effects are precise but overall small, making them less likely to be overall deleterious. However, changes to many genes may be required if evolutionary pressures are strong and require rapid adaptation. Because cis changes only affect one gene, many changes would have to occur, which may be too slow. By
14
contrast, a single trans change affects the entire cellular environment so it can alter the expression of many genes at once. Therefore, trans changes can allow the species to more rapidly adapt to a given evolutionary pressure than changes in cis. However trans changes are more likely to be pleiotropic and deleterious to overall fitness (Hill et al., 2020). In some way, trans effects are encoded in the genome, so cis changes could ultimately cause trans changes. It is important to note that the terms cis and trans are respective to the unit of divergence. While a trans change must arise from a genetic difference between species, this genetic difference has a different effect on gene regulation than a mutation that affects divergence only in cis, so they are under different selective pressures during evolution.
Parsing cis and trans effects on gene regulatory divergence has been primarily investigated at the level of gene expression, as measured by differences in mRNA transcript levels between closely related species. Because DNA sequence changes and cellular environment changes are inherently linked within an endogenous setting, these studies leverage unique methods that can directly and exclusively test divergence in either cis or trans. One approach is to measure allele- specific expression differences within a common cellular environment so that changes in cis are compared in a common trans-regulatory setting. A common way to do this involves mating two closely related species so that they generate F1 hybrids; gene expression for each allele is measured in the hybrids, which represents a common cellular environment, and this is then compared to the expression in the parental environments. This approach has been applied to many different taxa including Drosophila, yeast, plants, and mice (Coolon, McManus, Stevenson, Graveley, &
Wittkopp, 2014; Emerson et al., 2010; Goncalves et al., 2012; McManus et al., 2010; Osada, Miyagi, & Takahashi, 2017; Shi et al., 2012; Tirosh, Reikhav, Levy, & Barkai, 2009; Wittkopp, Haerum, & Clark, 2004, 2008). Overall, these studies have yielded widely different measures of
15
the relative abundance of cis and trans effects on gene expression, however, they commonly find that the proportion of cis effects increases with increased evolutionary divergence (Signor &
Nuzhdin, 2018).
Performing F1 hybrid studies is impractical when investigating cis and trans divergence between primate species. One recent study circumvented this limitation by measuring allele- specific expression in a fused human-chimpanzee tetraploid iPSC cell line (Agoglia et al., 2021).
By comparing gene expression in the fused cell line—the common hybrid environment—to expression in the native cell lines, this approach is similar to the experimental logic of F1 hybrid studies. The authors of this study found that ~39% of differentially expressed genes can be explained by divergence in cis. Taking this a step further, another study, using this same tetraploid cell line, generated embryoid bodies, performed single-cell RNA-seq, and measured allele-specific expression of each cell type within the embryoid body (Barr, 2022). They found that, on average,
~70% of inter-species differences in gene expression could not be explained by changes in trans.
Common cellular environment studies like these are powerful because they are well-controlled and the local differences of each allele on target gene expression can be easily identified.
Figure 2: Cis and trans modes of divergence in gene regulatory element activity for both gains and losses in activity. Cis changes alter the DNA sequence of the enhancer, and these changes affect its own activity. Trans changes affect the cellular environment, and these changes affect the activity of the enhancer and likely many other enhancers. See also Figure 30D-E.
16
DNA Regulatory Element Activity Divergence in Cis and Trans
While most studies have focused on differences in mRNA levels as a way to measure the effect of cis and trans changes, these expression differences are ultimately mediated by divergent DNA regulatory element function. However, only a handful of studies have investigated cis and trans divergence directly on DNA regulatory element activity. With DNA regulatory element activity as the unit of measure, cis divergence is simply changes to the underlying sequence of the DNA regulatory element that alters its own function, so these changes only alter the activity of one regulatory element (Figure 2). On the other hand, trans divergence is changes to the cellular environment that affect regulatory element activity of many DNA regulatory elements at one time (Figure 2). For example, the differential abundance of a TF can alter all regulatory elements that bind that TF.
Like gene expression studies, investigations into cis and trans effects on DNA regulatory element activity are similarly challenged by an inherent link between genome and cellular environment, and they too must adopt unique methods that allow for the parsing of these two effects. To do this, researchers leverage MPRAs, which allow DNA sequences to be removed and tested outside of their native environment. One MPRA-based approach compares regulatory activity measures of homologous sequences between closely related species within a common cellular environment (Arnold et al., 2014; Klein, Keith, Agarwal, Durham, & Shendure, 2018;
Uebbing et al., 2021; Weiss et al., 2021). By controlling the cellular environment, any effects from trans-regulatory differences between species are negated when assessing DNA regulatory element activity. While this approach allows direct identification of regulatory divergence in cis, it lacks direct assessment of regulatory activity changes in trans.
17
Another, more direct, approach compares regulatory activity of the same sequences across species-specific cellular environments (Gordon & Ruvinsky, 2012; Mattioli et al., 2020; Whalen et al., 2023). This MPRA-based approach allows direct identification of DNA regulatory element activity divergence in both cis and trans. In this way, these approaches can be leveraged to investigate the relative proportions of cis and trans divergence on regulatory element activity. The largest scale study to date using such an approach analyzed differential activity of ~1,600 homologous regulatory elements between human and mouse embryonic stem cells (Mattioli et al., 2020). They selected the ~1,600 regions to test, 268 of which are enhancers, from the FANTOM consortium, which uses a single biochemical feature—enhancer RNAs—to identify enhancers (Abugessaisa et al., 2021). They found 660 elements with regulatory divergence in cis and 293 elements with regulatory divergence in trans. This study, along with two other much smaller scale studies suggest that cis divergence primarily drives species-specific regulatory element activity between closely related species (Gordon & Ruvinsky, 2012; Mattioli et al., 2020; Whalen et al., 2023). However, these studies considered small, pre-selected subsets of regulatory elements, so their results represent only a small and selection-biased portion of the genome. Evolution over millions of years acts at genomic scale, so these studies lack a global view of how the cis and trans modes of divergence on regulatory activity drove existing gene regulatory differences between closely related species. Therefore, the field requires a comprehensive and unbiased survey of cis and trans contributions to global gene regulatory divergence to better understand the mechanisms driving gene regulatory evolution. This gap in knowledge is largely due to limitations of current technologies to profile DNA regulatory elements in the human genome.
18
Scope of Dissertation
In this dissertation I present two projects. In Chapter II, I present a substantially improved and well-characterized ATAC-STARR-seq method that allows simultaneous profiling of chromatin accessibility, TF occupancy, and DNA regulatory activity. When I began my PhD, ATAC-STARR-seq was a completely novel idea and had not been developed yet. Since then, two versions of ATAC-STARR-seq—HiDRA and FAIRE-STARR-seq—were published before ours.
These methods applied slightly different techniques to accomplish the same overall goal of performing STARR-seq on accessible chromatin sequences, but they did not explore key parameters of the assay and realize the full potential of these methods. We present our own version of ATAC-STARR-seq as a substantial improvement to these techniques and unlike the previous methods, we also provided the field with computational and technical support to increase accessibility of the method to others. The overall goal of developing ATAC-STARR-seq was to create a method that allowed us and others to investigate exciting biological questions that were not previously possible. At its core, ATAC-STARR-seq now allows researchers to identify all biologically relevant DNA regulatory elements in the human genome with an assay that directly quantifies regulatory activity. Given how much non-coding DNA sequences play a role in human disease, the value of this method cannot be understated.
In Chapter III, I use ATAC-STARR-seq to investigate the respective contributions of cis and trans changes on DNA regulatory element activity between human and rhesus macaque on a genome-wide scale to understand the preferred mode of DNA regulatory element activity evolution between closely related species. This question was limited by the available technologies, and we could not have investigated this second story without first developing ATAC-STARR-seq.
Overall, we observe a greater role for trans-regulatory mechanisms driving primate evolution than
19
previously appreciated and identify that changes in both cis and trans affect most divergent active regulatory regions.
20 CHAPTER II1
ATAC-STARR-SEQ REVEALS TRANSCRIPTION FACTOR-BOUND ACTIVATORS AND SILENCERS
ACROSS THE CHROMATIN ACCESSIBLE HUMAN GENOME
Introduction
Transcription is regulated by transcription factors (TFs) and the DNA sequences they bind, called cis-regulatory elements. Enhancers, which are a class of cis-regulatory elements, are distally located from the genes they target and serve as key drivers of cell-type specific gene expression (Heinz et al., 2015). Because enhancers require TF binding, they are largely dependent on chromatin accessibility to elicit transcriptional activity. Therefore, chromatin accessibility is a vital regulator of enhancer function, and this is evidenced by the observation that ~94% of all ENCODE TF ChIP-seq peaks fall within accessible chromatin (Klemm et al., 2019). In any given cell type, only a small fraction (~2%) of the genome is accessible to TF binding (Klemm et al., 2019;
Thurman et al., 2012). In this way, most enhancers are inaccessible and are less likely to drive transcription endogenously.
Enhancers are difficult to identify and validate because they lack uniform features and are less constrained by gene proximity than promoters (Gasperini et al., 2020). Massively parallel reporter assays (MPRAs) were developed to test the regulatory potential of thousands to millions of DNA sequences in parallel, providing high-throughput identification of putative enhancers.
1 This chapter is adapted from “ATAC-STARR-seq reveals transcription factor-bound activators and silencers across the chromatin accessible human genome” published in Genome Research and has been reproduced with the permission of the publisher and my co-author Emily Hodges, Ph.D. | Citation: “Hansen, T. J., & Hodges, E. (2022). ATAC- STARR-seq reveals transcription factor-bound activators and silencers across the chromatin accessible human genome. Genome Research, 32, 1529-1541. doi:10.1101/gr.276766.122”
21
Overall, MPRAs test the regulatory potential of genomic regions by cloning them en masse into a reporter plasmid and leveraging high-throughput sequencing to quantify regulatory activity (Santiago-Algarra et al., 2017). Among the variety of different vector backbones and assay designs applied to MPRAs, Self-Transcribing Active Regulatory Region sequencing (STARR-seq) is uniquely designed to assay an entire genome for regulatory activity (Arnold et al., 2013; Inoue et al., 2017; Kircher et al., 2019; Maricque et al., 2017; Melnikov et al., 2012; Muerdter et al., 2018;
Patwardhan et al., 2012). STARR-seq quantifies regulatory activity genome-wide by cloning randomly fragmented genomic DNA into the 3’UTR of the reporter plasmid. Thus, active enhancers drive transcription of themselves, and activity is quantified by the abundance of its own sequence in the transcript pool, removing the need for barcodes that some MPRAs employ. One major limitation of STARR-seq is that it is technically challenging to accommodate the massive size of the human genome; it requires large-scale cloning procedures and produces shallow sequencing coverage of human regulatory elements (Johnson et al., 2018). In addition, STARR- seq assays both accessible and inaccessible chromatin. Thus, many assayed regions are derived from heterochromatin and are less likely to be transcriptionally active in the cell type in question.
To narrow the scope of the assay, recent methods have combined STARR-seq with techniques that capture accessible chromatin to specifically test the regulatory potential of accessible DNA (Buenrostro, Giresi, Zaba, Chang, & Greenleaf, 2013; Chaudhri et al., 2020;
Glaser et al., 2021; X. Wang et al., 2018). As a result, these methods only sample a fraction of the human genome (~2%) while assaying nearly all regulatory elements capable of driving transcription endogenously, because they are derived from open chromatin. This approach remains comprehensive while enabling deeper sequencing coverage of biologically relevant genomic regions. Furthermore, integrated approaches have recently been described that combine
22
measurements of chromatin accessibility with analysis of transcription and other epigenomic features from a single population of cells (Barnett et al., 2020; Chen et al., 2022; Clark et al., 2018;
Kelly et al., 2012). Similarly, ATAC-STARR-seq has the potential to reveal multiple levels of gene regulatory information simultaneously, but this potential has not been explored. In addition, a complete understanding of gene regulatory activity is lacking with most MPRA approaches because silencing activity is largely overlooked, with a few recent exceptions (Doni Jayavelu, Jajodia, Mishra, & Hawkins, 2020; Y. S. Kim et al., 2021; Pang & Snyder, 2020); this is potentially due to technical caveats of distinguishing silencers from either that of missing data or interference from head-on transcriptional conflicts or post-transcriptional silencing mechanisms.
Here, we demonstrate a new workflow that substantially expands the capabilities of ATAC- STARR-seq to extract and measure gene regulatory information. Using this approach, we aimed to identify both activators and silencers, as well as to simultaneously profile chromatin accessibility, and perform TF footprinting. From a single ATAC-STARR-seq dataset, a multi- layered, integrated view of the human genome can be captured—a feature that has not been explored previously. We provide a protocol and code repository so that this new ATAC-STARR- seq workflow may be easily used and adopted by the field.
Results ATAC-STARR-seq Experimental Design
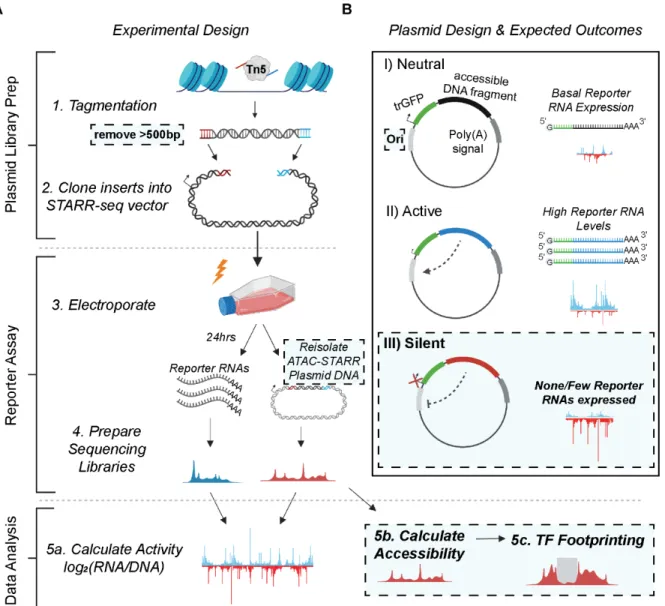
The ATAC-STARR-seq approach is divided into the three main parts: 1) ATAC-STARR- seq plasmid library generation, 2) reporter assay, and 3) data analysis (Figure 3A). To generate ATAC-STARR-seq plasmid libraries, nuclei are isolated from a cell type of interest and exposed to Tn5, the cut-and-paste transposase used in the ATAC-seq method (Buenrostro et al., 2013). Tn5
23
simultaneously cleaves DNA fragments within accessible chromatin and attaches customizable sequence adapters to their 5’ ends. ATAC-STARR-seq adapters are designed to serve as homology arms for direct Gibson cloning into the STARR-seq reporter plasmid, which enables cloning of accessible DNA fragments en masse. The resulting ATAC-STARR-seq plasmid library consists of millions of unique plasmids each harboring their own unique open chromatin-derived DNA fragment.
24
Figure 3: Schematic of the ATAC-STARR-seq methodology. (A) The experimental design of ATAC- STARR-seq consists of three parts: plasmid library generation, reporter assay, and data analysis. Open chromatin is isolated from cells with the cut and paste transposase Tn5 and only large DNA fragments (>500bp) are removed. The open chromatin fragments are cloned into a reporter plasmid and the resulting clones—called an ATAC-STARR-seq plasmid library—are electroporated into cells. 24 hours later, both reporter RNAs (blue)—which are transcribed directly off the ATAC-STARR-seq plasmid—and ATAC- STARR-seq plasmid DNA (red) are harvested, and Illumina-sequencing libraries are prepared and sequenced. The resulting ATAC-STARR-seq sequence data is analyzed to extract regulatory activity, chromatin accessibility, and transcription factor footprints. (B) Reporter plasmid design and the expected outcomes for neutral, active, and silent regulatory elements. Each ATAC-STARR-seq plasmid within a library contains a truncated GFP (trGFP) coding sequence, a poly-adenylation signal sequence, an origin of replication (Ori) (which moonlights as a minimal core promoter), and the unique open chromatin fragment being assayed. Since the accessible region is contained in the 3’ UTR, the abundance of itself in the transcript pool reflects its activity. In this way, neutral elements do not affect the system and reporter RNAs are expressed at a basal expression level dictated by the minimal core promoter, the Ori. Accessible chromatin fragments that are active express reporter RNAs at a higher level than the basal expression level, while silent elements repress the Ori and reporter RNAs are expressed at a lower level than basal expression.
Dashed boxes represent new components of the ATAC-STARR-seq assay design and workflow.
25
In our updated ATAC-STARR-seq workflow, we employ the STARR-seq Ori backbone, where the origin of replication (Ori) functions as the minimal promoter (Muerdter et al., 2018) (Table 1). Each plasmid in the ATAC-STARR-seq plasmid library contains a truncated GFP (trGFP) coding sequence, a poly-adenylation signal sequence, the Ori, and the unique accessible DNA fragment being assayed (Figure 3B). Critically, the accessible region is cloned into the 3’
UTR, so if the accessible region is active, it interacts with the Ori to drive self-transcription. Thus, an accessible region’s level of activity is reflected by its own level of expression. Transcripts from ATAC-STARR-seq plasmids, termed “reporter RNAs”, are expressed at basal levels from the activity of the Ori itself. This allows detection of silencing activity—the inhibition of the basal expression—in this assay.
Following its creation, the ATAC-STARR-seq plasmid library is transfected via electroporation into a given cell line. From the same flask of cells, both reporter RNAs and plasmid DNA are harvested 24 hours later, then prepared as Illumina sequencing libraries and sequenced.
Activity is calculated as the log2 ratio between normalized read counts from the reporter RNA and plasmid DNA datasets. The re-isolation of plasmid DNA recovers only the ATAC-STARR-seq plasmids that were successfully transfected, thus providing a more accurate representation of the
“input” sample than sequencing without transfection. Table 1 provides a comparison of experimental and analytical features as well as reported data metrics for the current ATAC-STARR design and previously reported approaches (Chaudhri et al., 2020; X. Wang et al., 2018).
26
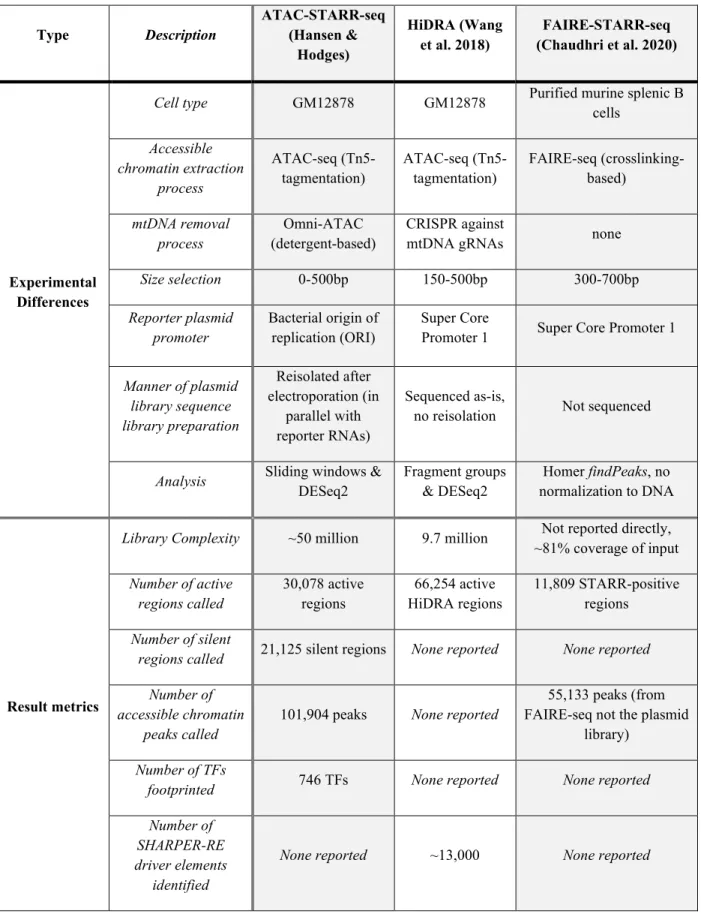
Table 1: A comparison of experimental differences and result metrics between accessible chromatin coupled to STARR-seq techniques.
Type Description ATAC-STARR-seq (Hansen &
Hodges)
HiDRA (Wang
et al. 2018) FAIRE-STARR-seq (Chaudhri et al. 2020)
Experimental Differences
Cell type GM12878 GM12878 Purified murine splenic B cells
Accessible chromatin extraction
process
ATAC-seq (Tn5-
tagmentation) ATAC-seq (Tn5-
tagmentation) FAIRE-seq (crosslinking- based)
mtDNA removal
process Omni-ATAC
(detergent-based) CRISPR against
mtDNA gRNAs none
Size selection 0-500bp 150-500bp 300-700bp
Reporter plasmid
promoter Bacterial origin of
replication (ORI) Super Core
Promoter 1 Super Core Promoter 1
Manner of plasmid library sequence library preparation
Reisolated after electroporation (in
parallel with reporter RNAs)
Sequenced as-is,
no reisolation Not sequenced
Analysis Sliding windows &
DESeq2 Fragment groups
& DESeq2 Homer findPeaks, no normalization to DNA
Result metrics
Library Complexity ~50 million 9.7 million Not reported directly,
~81% coverage of input Number of active
regions called 30,078 active
regions 66,254 active
HiDRA regions 11,809 STARR-positive regions
Number of silent
regions called 21,125 silent regions None reported None reported Number of
accessible chromatin
peaks called 101,904 peaks None reported
55,133 peaks (from FAIRE-seq not the plasmid
library) Number of TFs
footprinted 746 TFs None reported None reported
Number of SHARPER-RE driver elements
identified
None reported ~13,000 None reported
27
The GM12878 ATAC-STARR-seq plasmid library is highly complex
Following the experimental design outlined above, we tagmented GM12878 cells and generated an ATAC-STARR-seq plasmid library. A successful ATAC-STARR-seq experiment is predicated on maintaining complexity at all stages of the protocol. We estimated the initial complexity of our ATAC-STARR-seq plasmid library by sequencing the library at low depth and estimating the number of unique reads with the Preseq software package (Daley & Smith, 2013) (Figure 4A). The GM12878 ATAC-STARR-seq plasmid library contains a maximum complexity of about 50 million unique accessible DNA fragments, providing ample coverage of accessible loci.
24hrs post-transfection is the optimal time to harvest ATAC-STARR-seq reporter RNAs The introduction of plasmid DNA into cells produces an interferon-stimulated gene response that can confound the isolation of biologically relevant regulatory activity (Muerdter et al., 2018). To minimize this interference in our data, we determined the optimal incubation time between electroporation and harvest. Two factors play an important role in determining when to harvest RNA: global reporter RNA expression levels and the timing of interferon stimulated gene response to STARR-seq reporter plasmid DNA. To investigate both factors, we electroporated ATAC-STARR-seq plasmid DNA, isolated poly-adenylated RNA at several time points after transfection, quantified RNA expression with qPCR, and compared to an untransfected sample (Figure 4B). An increase in reporter RNA expression is observed at 3 hours (the earliest timepoint) and remains stable at later time points. We measured expression of IFNB1, IFIT2, and ISG15 to
28
characterize the interferon stimulated gene response in our system. RNA expression for all three genes increases initially but returns to baseline by 24 hours. Given the persistent level of reporter Figure 4: ATAC-STARR Optimization. (A) Estimated complexity curve for the GM12878 ATAC- STARR plasmid library. Dashed lines represent predicted values from Preseq’s lc-extrap. The associated ribbon plots (light blue) represent the 95% confidence interval reported with the predicted value. (B) Relative expression of reporter RNAs and three interferon-stimulated genes (IFNB1, IFIT2, and ISG15) at varying timepoints between 0- and 36-hours post-electroporation. For each analysis, fold-change values are relative to the untransfected condition. Three replicates were isolated and quantified for each timepoint.
29
RNAs and the attenuated interferon stimulated gene response in our system, we decided to harvest 24 hours after electroporation. Together, this allows us to capture reporter RNAs that reflect steady-state regulatory properties of GM12878 accessible regions without sacrificing reporter RNA recovery.
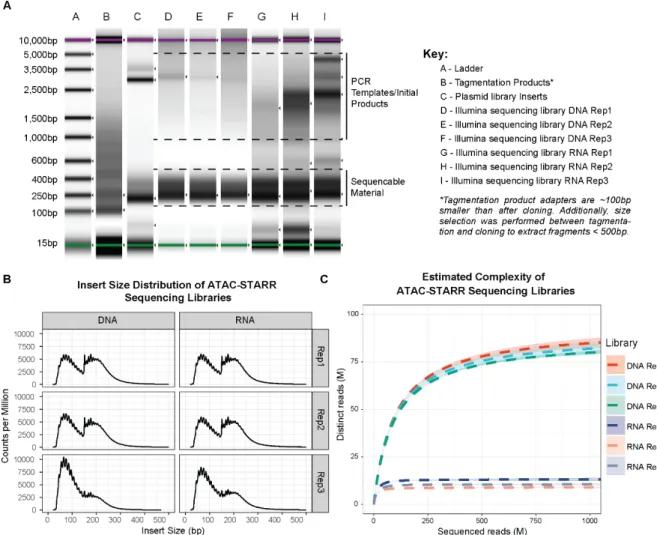
Figure 5: Characterization of ATAC-STARR sequencing libraries. (A) Agilent Tapestation results for relevant steps of ATAC-STARR, this includes the following: tagmented products, plasmid library inserts, and Illumina sequencing libraries for all three replicates of DNA and RNA. Tagmented products lack the full Illumina adapter and therefore are about 100bp smaller than their later-stage counterparts. They also include larger fragments which were removed via selection before the cloning step. The Illumina-ready libraries were amplified using a minimal PCR cycle number and therefore the plasmid or cDNA template as well as the first and second round products can be seen as larger material—this material is not sequence- able as it lacks at least one of the adapters required for cluster amplification. (B) Insert size distribution of ATAC-STARR-seq reads, as quantified by Picard’s CalculateInsertSizeMetrics. (C) Estimated complexity curves for ATAC-STARR sequencing libraries. Dashed lines represent predicted values from Preseq’s lc- extrap. The associated ribbon plots (light blue) represent the 95% confidence interval reported with the predicted value.
30
ATAC-STARR-seq maintains nucleosome profiles of Tn5 selected DNA fragments
For a total of three replicates, we then transfected the library into GM12878 cells and harvested both reporter RNAs and plasmid DNA from the same flask of cells 24 hours later. Using the captured reporter RNAs and plasmid DNA, we prepared Illumina sequencing libraries for each replicate and submitted for sequencing. The size distribution of the accessible DNA fragments remained consistent throughout the ATAC-STARR-seq procedure and displayed the characteristic nucleosome banding and DNA pitch typified by ATAC-seq fragment libraries (Figure 5A,B).
Analysis of library complexity between replicates revealed an average maximum complexity of 90 million unique fragments for input DNA, and 10 million unique fragments for reporter RNAs (Figure 5C). The difference between RNA and DNA complexities is likely due to higher duplication rates in the RNA samples (Table 2) driven by both the expression of multiple
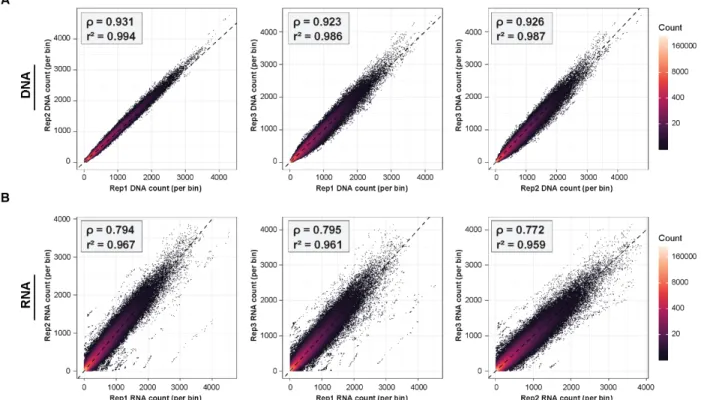
Figure 6: Correlation between ATAC-STARR-seq replicates. Scatter plots of DESeq2-normalized read counts per bin between replicates for both (A) DNA and (B) RNA samples. Pearson (r2) and spearman (ρ) correlation coefficients are indicated in the top left corner for each pairwise comparison.
31
transcripts per plasmid and more PCR cycles required for the RNA samples. In addition, for both RNA and DNA samples, replicates displayed high Pearson (r2: 0.96-0.99) and Spearman’s (ρ:
0.77-0.93) correlation coefficients indicating strong agreement among the three replicates assayed (Figure 6). Altogether the ATAC-STARR-seq sequence libraries demonstrated the necessary quality and complexity for downstream analysis.
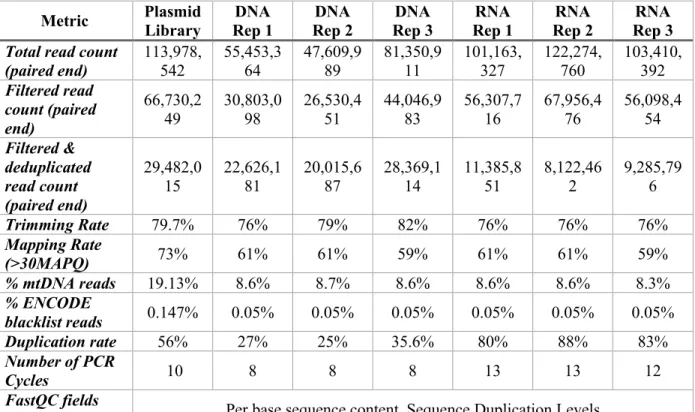
Table 2: ATAC-STARR-seq sequencing summary statistics. Plasmid library column represents data from the library complexity check.
Table 3: Genrich peak counts for varying FDR thresholds. Underlined values indicate the peak sets that were analyzed further.
Metric Plasmid
Library DNA
Rep 1 DNA
Rep 2 DNA
Rep 3 RNA
Rep 1 RNA
Rep 2 RNA Rep 3 Total read count
(paired end) 113,978,
542 55,453,3
64 47,609,9
89 81,350,9
11 101,163,
327 122,274,
760 103,410, Filtered read 392
count (paired end)
66,730,2
49 30,803,0
98 26,530,4
51 44,046,9
83 56,307,7
16 67,956,4
76 56,098,4 54 Filtered &
deduplicated read count (paired end)
29,482,0
15 22,626,1
81 20,015,6
87 28,369,1
14 11,385,8
51 8,122,46
2 9,285,79 6
Trimming Rate 79.7% 76% 79% 82% 76% 76% 76%
Mapping Rate
(>30MAPQ) 73% 61% 61% 59% 61% 61% 59%
% mtDNA reads 19.13% 8.6% 8.7% 8.6% 8.6% 8.6% 8.3%
% ENCODE
blacklist reads 0.147% 0.05% 0.05% 0.05% 0.05% 0.05% 0.05%
Duplication rate 56% 27% 25% 35.6% 80% 88% 83%
Number of PCR
Cycles 10 8 8 8 13 13 12
FastQC fields
failed Per base sequence content, Sequence Duplication Levels
Sample FDR < 0.01 FDR < 0.001 FDR < 0.0001 FDR < 0.00001
Corces 133,007 89,829 66,471 50,784
ATAC-STARR 162,877 124,612 101,904 85,668