Finally, I would like to thank the Center for Compact and Efficient Fluid Power under the National Science Foundation (NSF) (Grant Vanderbilt Initiative in Surgery and Engineering (VISE), and the Broad Medical Research Program of the Broad Foundation for their financial support K represents a grayscale version of the image, R is the red channel, B is the blue channel and G is the green channel.
Colonoscopy and Colorectal Cancer
In the last decade, narrowband imaging (NBI) has been introduced to enhance diagnostic capabilities during endoscopy. Technological improvements in the field of endoscopy aim to help patients overcome these obstacles.
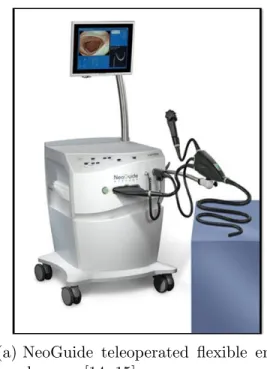
Teleoperable Flexible Endoscopes
This results in stretching of the colon and displacement of the colonic mesentery (connects the organs to the abdominal wall). The principle of operation of the device is very similar to that of an inchworm, stretching and shortening to create anchor points within the colon.
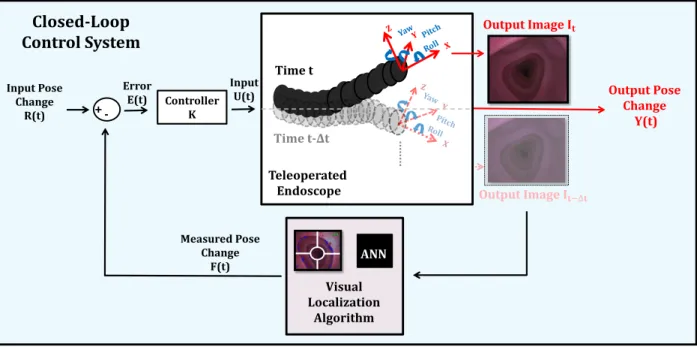
Motion Estimation for Teleoperable Endoscopes
In addition, a magnetic tracker that constantly occupies the endoscope's tool channel may compromise the standard of care during colonoscopy. However, the magnetic manipulation of the endoscope interferes with the electromagnetic fields generated in the magnetic tracking system; this results in degraded, inaccurate, or missing location estimates from the tracker.
Related Work
For endoscopes with extremely limited operational space such as encephaloscopes, rhinoscopes and bronchoscopes, minimizing the size of the endoscope is fundamental. A 3-dimensional reconstruction of the colon using sequential images from a monocular camera was achieved using SFM reconstruction [ 55 ].
Thesis Overview
Essential to the motion estimation and tracking of the endoscope is the calculation of the translational and rotational position displacement of the endoscope tip. It is important to calculate the position displacement of the endoscope relative to its previous coordinate frame (ie, not the absolute displacement in the global coordinate frame).
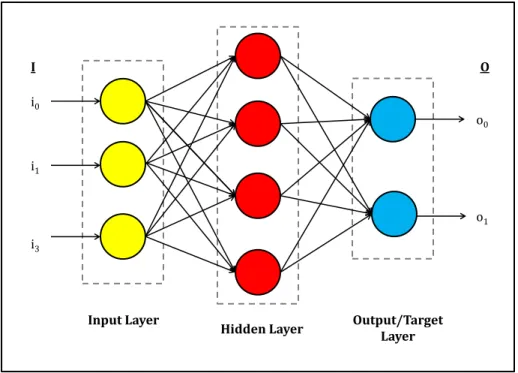
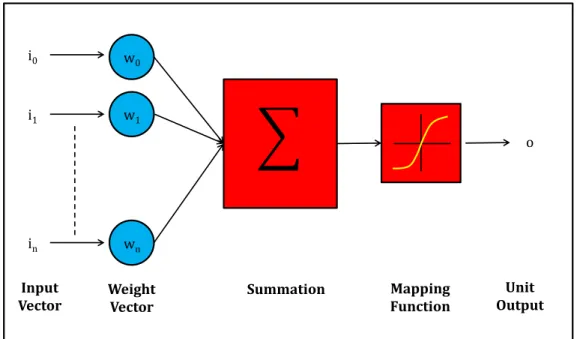
Artificial Neural Networks (ANNs)
Thus, ANNs are powerful for learning complex mappings, given the correct number and size of hidden layers, and certain features of the function to be mapped from a set of examples and their target outputs [62]. This means that the method requires a training set representative of the function to be approximated.
Optical Flow Computation
Lucas-Kanade (LK) Optical Flow
LK optical flow [50] is a well-established and widely used algorithm for estimating relative motion in an image sequence based on certain features. LK solves this equation by applying it to all pixels within a local neighborhood of a given pixel p, and solves a least-squares problem to estimate Vx and Vy.
Scale-invariant Optical Flow
For each point of interest, a Gaussian weighting function is applied to each pixel within the vicinity of the pixel of interest. Illumination invariance is then achieved by normalizing the feature vector to unit length; if there is a brightness change that uniformly increases the intensity of each of the pixels, this is canceled out by normalization.
Hierarchical Multi-Affine (HMA) Optical Flow
A spatial grid is then applied to form a feature vector corresponding to the motion of the endoscope, as described in pixels. These two components form one pair within the training set, collected over the entire motion path of the endoscope. Due to the high frame rate of the camera, the contribution of this motion is believed to be minimal.
However, because this is a function of the endoscope, it can be carefully monitored for changes at the user's command.
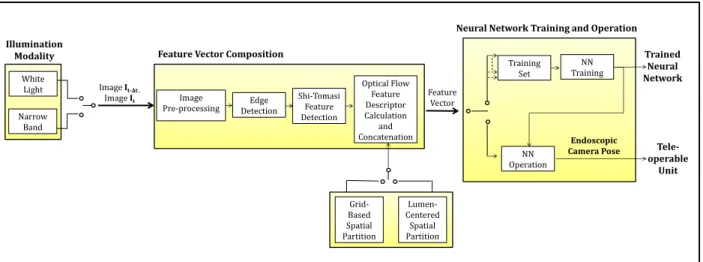
Input Descriptor Composition
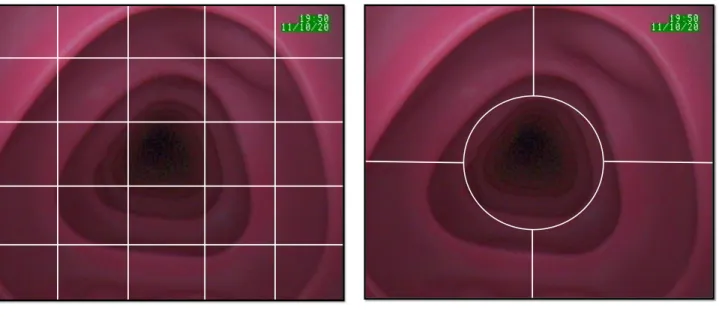
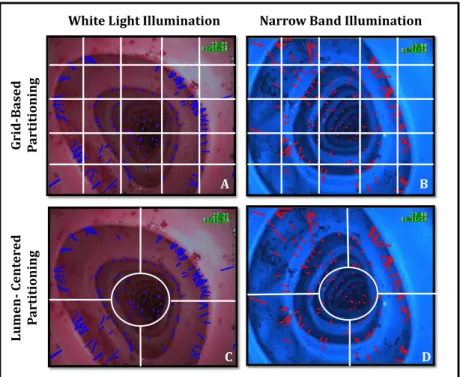
This segmentation method is based on a consistent alignment of the center of the lumen with the center of the dark area in the image. To begin to define the regions of the lumen-centered partition, two methods were compared. Both methods require the calculation of the centroid of the lumen, (xc, yc), to define the location of the center of the lumen.
This was achieved by summing the edge pixels of the lumen area in the thresholded image.
ANN Training and Usage
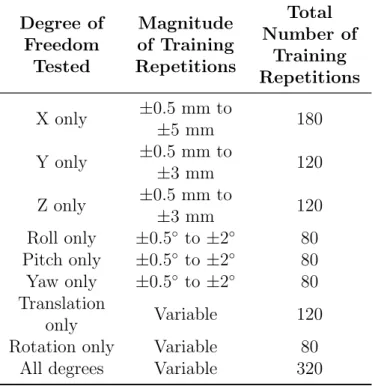
In order to test the validity of the approach, several experiments were performed to evaluate the estimation ability of the algorithm in different environments. All the experiments investigate the role of partitioning of the optical flow input descriptor on the performance of the resulting ANNs. The first experiment specifically assesses the role of different lighting modalities on the performance of the ANNs, and compares its performance with that of a magnetic tracker.
With this work, we further investigate the discrepancy in the power of the features produced under WLI and NBI, as well as the role of the color channel of the images.
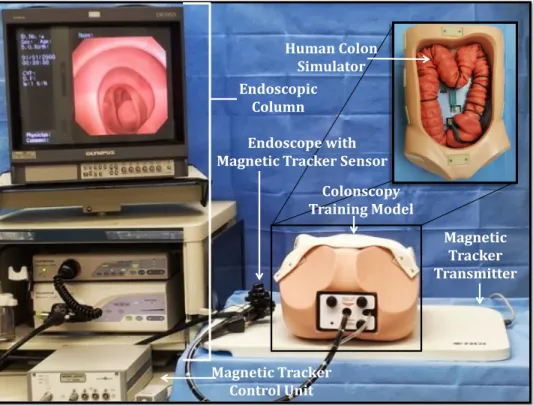
Benchtop Evaluation of Magnetic Tracker vs. Robotic Encoders vs. ANN
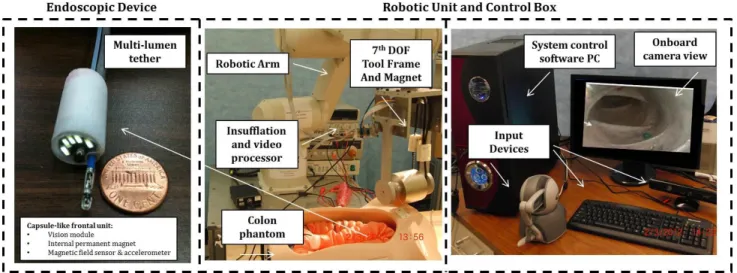
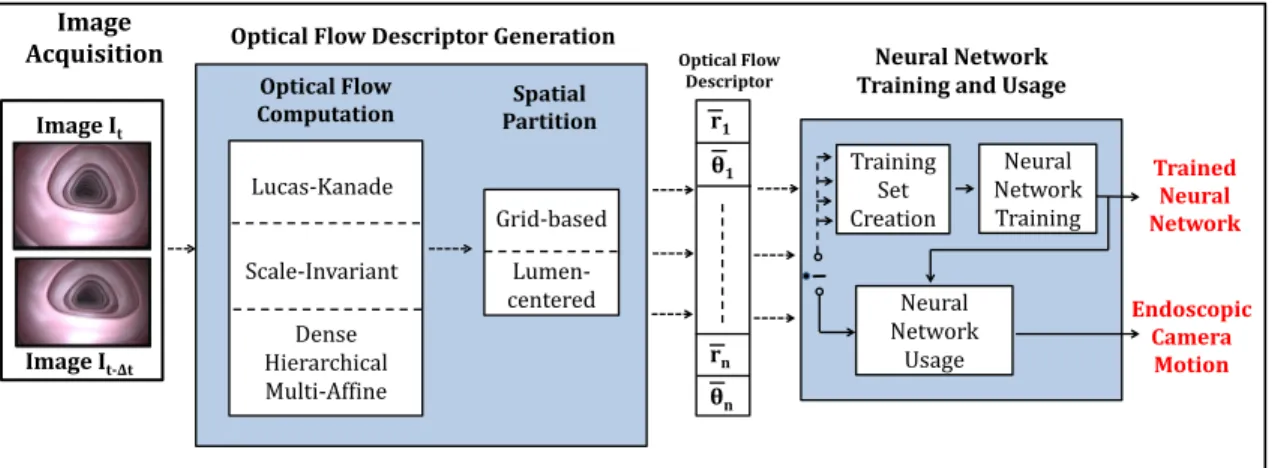
Each time the endoscopic module is moved, the robot motion, the 5 DOF pose provided by the tracker, and the corresponding endoscopic image are recorded. With each movement of the robot/endoscopic module, the resultant optical flow feature descriptors are calculated and the robot and magnetic tracker positions are recorded. The training of ANNs proceeds offline in the manner shown in Figure 3.1 and as described in Section 2.2.
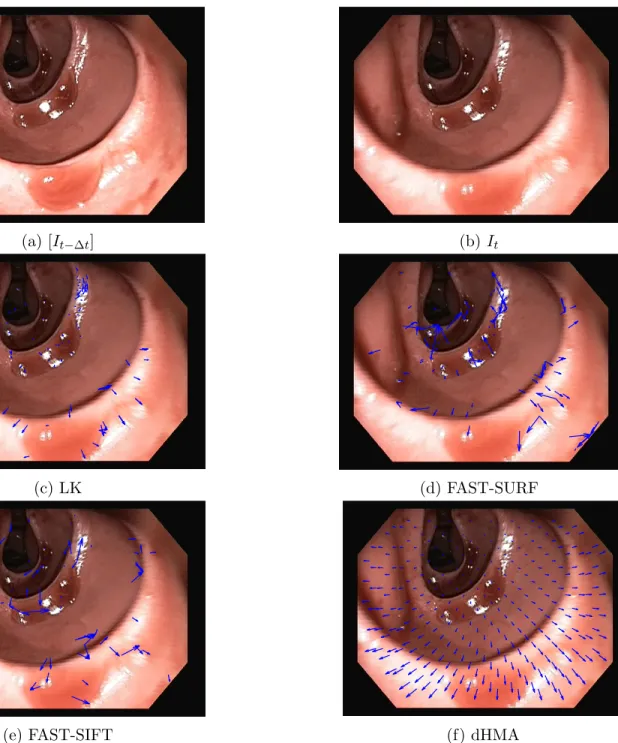
The input to the ANNs are the optical flow descriptors, compact representations of the scene evolution between time t-∆t and time t.
Evaluation of Proposed Method using Clinical Protocol
Implementation was achieved via Matlab's Neural Network Toolbox; it was used for both training and testing of the ANNs. The training set was split such that 85% of the data was assigned to the set on which to train the ANNs, 10% to compose the validation set, and 5% to the test set. This made it possible to obtain the maximum number of images and corresponding poses of the magnetic tracker.
The necessary procedure to train the ANNs was maintained; each of the ANNs was trained using the optical flow descriptor inputs and the calculated translational and rotational displacements of the magnetic tracking system.
Assessment of Illumination Modality on Feature Strength
The effect of this change does not lead to any change that affects the outcome of the results. The remaining trial was used as test data to evaluate the performance of the ANNs when trained on noisier data. The RMSE measure was again used as a metric to evaluate the estimation capabilities of the ANNs, and was calculated as the RMSE between the estimates produced by the ANNs and the known pose displacement given by the magnetic tracker. large variation in both horizontal and vertical direction), and edges are indicated by one large eigenvalue.
Using these results, it is possible to evaluate the strength of the illumination-based features as well as the contribution of their individual color channels.
Investigation of Feature Descriptor
- Evaluation of Descriptor Parameters
- Analysis of Class Variation
- Effects of Dimensional Reduction
- Comparison of Optical Flow Algorithms on Performance
A multivariate analysis of class variance was performed to assess the resolution of the data based on the descriptors. For this work, the dimensionality was chosen based on the number of eigenvectors required to explain 97% of the variation in the data. 75% of the training data and 25% of the data were used to train and test the ANN.
Training and testing of the ANNs was carried out in a manner identical to the methods in the previous experiments.
Clinical Validation Trial with Commercial Endoscope
It is likely that the degraded performance of the tracker is related to its proximity to the drive motors of the robot; however, the endoscopic module is approximately 300 mm from the nearest motors, which is not even used when driving the translational DOF. Even further, the effect of the rolling motion of the endoscope was essentially filtered out of the data set; the 5 DOF sensor could not report this DOF, so it could not be measured or accounted for within the algorithm. Again, due to the robotic nature of the device, these events can be sensed from the user-commanded input device so that motion estimation can be interrupted while the endoscope is forced to remain motionless.
Thus, it is expected that the computation time will be reduced by parallelizing the computation of ST feature correspondences (e.g., using different processor cores to simultaneously process different areas of the image) and ANN computations, optimizing the code, and using from a more capable computer.
Strength of Features based on Illumination Modality and Color Channel
Since corners and edges represent areas of the image with large variations in the local pixel neighborhood, they are labeled as regions with high eigenvalues. As can be seen in the figure, NBI produces features with more than twice the power of WLI features. These results coincide with those in Section 5.2, as well as visual inspection of the images in Figure 5.4, which reflect a greater contrast between colon walls and blood features under NBI.
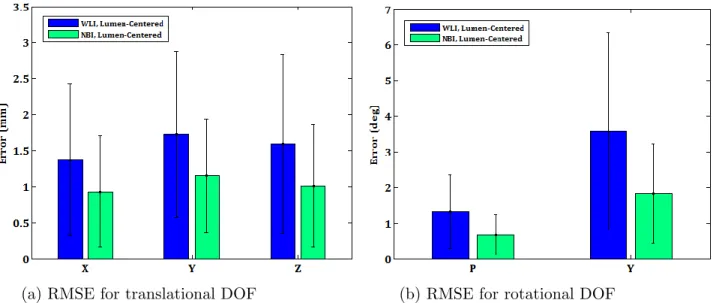
However, given the improved power of the features under NBI, we would expect a larger difference between the performance of ANN WLI and NBI.
Evaluation of Feature Descriptors
Descriptor Representation
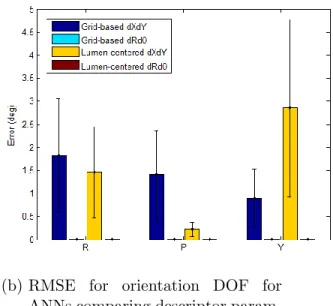
K represents the grayscale version of the image, R is the red channel, B is the blue channel, and G is the green channel. a) RMSE for translational DOF for ANNs comparing descriptor parameters.
Class Variation
For the [dx, dy] representation, the within-class variation ratio is generally smaller than the corresponding data in Figure 5.7a. This suggests that a particular increment is easier to distinguish from other increments in other DOFs of the same distance than when the distance is known. However, as shown, the within-class variation appears to be greater in the [dr, dθ] representation.
The data therefore suggest that the grid-based [dr, dθ] representation may be best, since (1) given the DOF, the distance moved can be distinguished from other distances, (2) movement in each DOF can be of movements distinguishable in other DOF, and (3) given the distance moved, the DOF in which it occurred can be distinguished from other DOF.

Dimensional Reduction
For these two cases, dimensionality reduction, although preserving 97% of the variation, does not help reduce the RMSE. Regarding the rotating DOF, PCA had a similar effect: replacing a decrease in RMSE for one combination while increasing the RMSE for another. For this particular task in the training set, dimensional analysis helped some DOF while harming others.
This makes the reduced dimension equivalent or better than the full data set; by reducing the number of inputs, the ANN training time can be significantly reduced.
Optical Flow Algorithm Comparison
10] ——, “Image-based flexible endoscope guidance,” in Proceedings of the 2010 IEEE/RSJ International Conference on Intelligent Robots and Systems, R. Computer-assisted colonoscopy (the NeoGuide system): Results of the first human clinical trial, ” Gastrointestinal Endoscopy, full. Tsakiris, "Lumen detection for capsule endoscopy," in Proceedings of the 2008 IEEE/RSJ International Conference on Intelligent Robots and Systems, 2008, pp.
Linyong, “An intelligent endoscopic navigation system,” in Proceedings of the 2006 IEEE International Conference on Mechatronics and Automation, S.