ISSN 1732-1948 Vol. 33 (3) • 2018
Marcin Świtała Wojciech Gamrot
Department of Business Logistics Department of Statistics, Econometrics Faculty of Management and Mathematics
University of Economics in Katowice, Poland Faculty of Management
[email protected] University of Economics in Katowice, Poland [email protected]
Beata Reformat Katarzyna Bilińska-Reformat
Department of Marketing Department of Marketing Management Faculty of Management and Tourism
University of Economics in Katowice, Poland Faculty of Management
[email protected] University of Economics in Katowice, Poland [email protected]
The influence of brand awareness and brand image on brand equity – an empirical study of logistics service providers
doi: 10.22367/jem.2018.33.06
Accepted by Editor Ewa Ziemba | Received January 25, 2018 | Revised: April 1, 2018; April 12, 2018 | Accepted: April 18, 2018.
Abstract
Aim/purpose – This article presents the results of research referring to Keller’s brand equity concept. The fundamental objective of the research was to examine the influence of brand awareness and brand image on brand equity. We were also interested which force of influence is greater.
Design/methodology/approach – The research was based on secondary and primary sources of information. The primary research was carried out on a sample of 100 enter- prises ordering logistics services. Data obtained in such a way was subject to statistical analysis using modelling of structural equations.
Findings – Based on the analysis of paths in the model of structural equations, the exis- tence of positive, but weak dependencies between brand awareness, brand image and brand equity was observed. While the results of bootstrap simulations conducted to esti- mate confidence intervals indicated that differences in the strength of this influence are not statistically significant.
Research implications/limitations – The obtained results did not bring sufficient basis to accept or reject hypotheses assuming an essentially positive relationship between brand awareness and brand image and its equity. Simultaneously, the conducted research led to the rejection of the hypothesis in accordance to which the influence of brand awareness on brand equity is smaller than the influence of brand image on brand equity.
Originality/value/contribution – Potential causes of differences between the results of our own research and the research presented by Davis, Golicic, & Marquardt (2008) were indicated.
Keywords: brand awareness, brand image, brand equity, logistics service providers.
JEL Classification: L1, M31, M37.
1. Introduction
Increasing competition between logistics service providers (LSPs) moti- vates them to use marketing as an effective tool to create and deliver value for their customers. An important role here is undoubtedly played by brand, the main task of which is to enhance the offer so that services available on the mar- ket become more valuable and significant to buyers (Kotler & Pfoertsch, 2006).
Brand is also one of the key factors to reduce risk related to the selection of a competitive offer, which is emphasized by numerous authors undertaking the subject (e.g., Daszkiewicz & Wrona, 2013; Pinar, Trapp, Girard, & Boyt, 2014).
This influence seems to be of particular importance in the case of logistics ser- vice purchasers. From our previous research, it may be concluded that most ser- vice providers offer comparable standards, which makes the selection of a pro- vider based on purely logistics criteria more complicated for customers of the market (Świtała, 2016). In this context, it is worth paying attention to a strong relationship between the brand and the company’s reputation, which, for many customers, constitutes an important determinant in choosing a given partner to cooperate with (Roberts & Merrilees, 2007).
Based on the observation of activities undertaken by LSPs, it can be stated that they increasingly seek sources of competitive advantage. As pointed out by Kasemsap & Rajabhat (2017), LSPs must differentiate themselves from the point of view of current and potential customers. In practice, it means that LSPs must provide logistics services better than the competition (Liu, McKinnon, Grant,
& Feng, 2010; Aziz, Razak, Yaacob, & Rahim, 2015), and operate in accordance with their own marketing needs, i.e. they must take care of their image, visibility and distribution of services, using the concept and achievements of modern mar- keting (Kempny, 2010). Intangible resources are gaining significance, which prejudges the market position to a large extent and they constitute the basis to
create brand equity (Low & Kalafut, 2004). Researchers agree that having a strong brand is associated with numerous benefits (Altaf, Iqbal, Mokhtar,
& Sial, 2017; Davis et al., 2008; Motameni & Shahrokhi, 1998). Apart from the above-mentioned capacity to differentiate products, attention is also paid to cus- tomers’ readiness to accept higher prices, their will to give recommendations and the possibility to expand the brand umbrella to other product categories (Bieden- bach, Bengtsson, & Marell, 2015). At the same time, it is emphasized that the fundamental source to create brand equity is the knowledge customers have about it (Hoeffler & Keller, 2003).
Being driven by these findings, in this article, we made an attempt to de- termine the influences between brand awareness, brand image and brand equity, which were examined empirically based on examples of logistics service provid- ers. We also assessed which force of influence is greater. It is worth highlighting that despite numerous studies dedicated to various aspects of brand management, matters related to brand equity building, especially referring to the B2B segment, are quite rarely undertaken by researchers (Kim & Cavusgil, 2009; Juntunen, Juntunen, & Juga, 2011; Grant, Juntunen, Juga, & Juntunen, 2014). So far only a few studies concerning the significance of brand equity among service provid- ers operating on foreign markets have been carried out. Those studies inspired continuation of the subject in Poland.
The article consists of six parts. In the first theoretical part, brand definition and key terms related to the concept of brand equity were discussed. In the sec- ond part, the research conceptual model was presented, together with the as- sumed hypotheses. The third part contains characteristics of the research mate- rial and method with measurement variable assessment after scale purification.
The last three parts of the article contain results of the research, their interpreta- tion and conclusions made based on the research, respectively.
2. Literature review 2.1. Brand definition
Numerous definitions explaining the essence of the brand were provided in the literature during the last twenty years (Kall, 2001; Kapferer, 2008; Keller, 2011; Witek-Hejduk, 2011). In the previous theoretical achievements, two domi- nating and varying perspectives concerning the definition of a brand can be iden- tified. The first one is represented by the classic approach, which focuses on physical and functional aspects of a brand as a trademark for product designa-
tion. The second one is represented by the behavioral approach in which the main objects of interest are symbolical, intangible aspects of a brand in the con- text of perceiving consumers’ experience. These approaches justify the need to differentiate a narrow and broad meaning of the brand.
The broad meaning of a brand is particularly important from the customer’s point of view, as it concerns the category of value desired and expected from a given brand, which in turn communicates and affects emotions resulting in particular needs and purchasing experience. On the other hand, a narrow mean- ing of brand refers to the definition formulated by the American Marketing As- sociation (AMA) according to which the main objective of the brand is to iden- tify goods and services, and to differentiate them from goods and services offered by competitors (Keller, 2005). At the same time, it must be noted that practical needs and theoretical considerations of recent years indicate the progressive integration of the classic approach (narrow) and behavioral approach (broad) with regards to defining the brand. While, newer theoretical approaches supplement the perspective of brand analysis (which was previously boiled down to the perspective of its perception by the final recipient – i.e., its image) with a complementary perspective taking self-perception, i.e., brand identity into account (De Chernatony & McDonald, 2000; Kotler, 2005).
Considering the above, it must be noted that the meaning of brand in recent years has been gradually extended, which results from increasingly demanding customers and increased activity of competitors. A multitude of offers results in it being easier to remember a brand name than the features of the product that consumers are looking for. A strong brand has greater bargaining power in nego- tiations with intermediaries, suppliers, etc., simultaneously creating better finan- cial conditions for the company.
2.2. Brand awareness
According to the work of Romaniuk, Wight, & Faulkner (2017) brand awareness is a capacity of a given customer to recognize or recall that a given brand belongs to a particular category of products. Brand awareness is strongly related to the power with which the presence and traces of a brand in customers’
minds result in their capacity to recognize (identify) the brand under various market conditions (O’Guinn, Allen, & Semenik, 2009).
From the definitions provided above, it can be concluded that brand aware- ness means being aware of its existence and its relationship with a particular product. According to Kahneman (2012), current research proves that even one
appearance of a brand name in the surroundings of a customer causes that when the customer comes across it again, in his/her mind a thought will occur:
“I know this brand”. It should also be added that numerous advertising cam- paigns are based on this assumption and their messages aim at consolidation of the brand name in the minds of actual and potential buyers.
In the literature of brand management, brand awareness is one of the most important factors determining the brand strength and as a consequence leading to its competitive advantage (Urbanek, 2002). Therefore, brand awareness mea- surement is becoming increasingly significant in the market practice of modern companies. This measurement is possible thanks to survey studies using which the relationships of customers between a given brand (each research company and advertising agency has their own original method) and brand image are measured. Data obtained in such a way is very reliable, and its main objective is to verify whether building brand awareness is effective, i.e.: how much is the brand recognized and remembered by consumers as well as what they associate the brand with? Three types of brand awareness measurements are indicated (Torelli, 2013):
a) spontaneous awareness, which indicates the percentage of customers who are able to provide the name of a given brand without the assistance of the inter- viewer; this indicator determines the real field of customers’ choices at the same time;
b) top of mind knowledge, which informs what percentage of respondents point out a given brand as the first one in the study (the first one that comes to their mind); it shows that it is strongly rooted in buyers’ awareness;
c) supported awareness, which represents what percentage of respondents de- clares brand knowledge after it is mentioned by the interviewer, which indi- cates a poor relationship with a given brand.
Practically, brand awareness indicates the effectiveness of marketing activi- ties of each company (Farris, Bendle, Pfeifer, & Reibstein, 2010; Liu, Liston- -Heyes, & Ko, 2010). It should be emphasized that shaping brand awareness involves consolidating its existence in customers’ minds, which translates into decisions related to the development of the offer, selection of specific activities and cost analysis of marketing activities, which should be undertaken. It is ar- gued that this is extremely important for LSPs; studies show that it is very unlikely for customers to use providers that are unknown on logistics service market (Davis et al., 2008). In other words, LSPs must find ways to be recog- nized for their service offerings.
2.3. Brand image
In management sciences, one can come across numerous definitions, which explain the concept of brand image in a narrow and broad way. For instance, Keller (1993), Hung (2008) and other authors (i.a., Capriotti, 1999; Da Silva
& Syed Alwi, 2008) indicate that brand image is an idea about a given brand linked to associations in customers’ memory. While Zhang (2015) and Kotler
& Barich (1991) understand brand image as “a system of images and thoughts existing in human awareness, expressing information concerning a given brand and basic attitude towards it”. From this definition, it can be concluded that brand image is created by a set of features of an extraordinary nature, unique for a given brand, which cause its differentiation, simultaneously ensuring the de- sired market recognition. Pars & Gulsel (2011) at the same time underline that brand image is an impression made as a consequence of numerous factors (e.g., associations linked with a given brand name, purchasing experience, reputation of a given company, forms and measures of advertising, promotion, etc.), which means that from the perspective of various recipients it is a complex, inhomoge- neous and quite abstract category.
Brand image is often linked with brand identity. In his definition, Upshaw (1995) treats brand identity as “the configuration of words, images, ideas and associations creating the total brand image in buyers”. Numerous authors, in- cluding Kall (2005), also draw attention to the fact that brand identity is shaped consciously by its owners and it aims at determining the meaning, intent and calling of a given brand. In other words, this term constitutes a specific message about a given brand presented by a given company to its recipients using various marketing activities. Brand identity is built through the so-called market brand positioning in buyers and potential customers’ minds. The term ‘positioning’ was introduced into the literature on the subject by Ries & Trout (1982). From a mar- keting perspective, this term is defined among others by Kotler (2004) who uses it to describe “an activity related to shaping the offer and image of an enterprise resulting in a clear and significant position of the brand in the memory of target recipients”. In this definition, the author refers to marketing activities aimed at specific associations, which are supposed to help differentiate the brand from other similar brands functioning on a given market. Kapferer (2008) perceives position- ing in a slightly different aspect; he highlights an important market function of positioning in his approach, referring to stimulation of competitiveness.
Brand image can be analyzed through a prism of four key elements, which are: verbal and visual identification, forms of brand promotion, i.e., marketing communication and the system of behaviors of people (employees) linked to
a given brand. These elements creating a consistent system of activities, signifi- cantly impact brand image, i.e., its identification and perception by surround- ings. Simultaneously, it must be emphasized that brand image should be adjusted to the nature of market activities of a given company, i.e., synonymous with its mission and market strategy, legible for consumers, and interesting for its part- ners. Additionally, the brand image should be accepted by a broader community of a given company (external and internal) positively distinguishing itself from competitive brands on the market. As regards logistics service market, Juga, Juntunen, & Grant (2010) studied the impact of service quality on outsourcing relationship and argued that service provider’s image plays a significant role in obtaining customer loyalty.
2.4. Brand equity
Perceiving a brand in the aspect of its value, i.e., equity, is very important for the process of creating a competitive advantage of an enterprise, and its mar- ket position in comparison to other brands. A review of the literature on the sub- ject indicates various approaches to defining brand equity. Usually, they assume two different points of reference as a theoretical basis of their considerations.
The first one is related to financial aspects of brand equity, and the second one – to improving and increasing the effectiveness and efficiency of marketing activi- ties, especially in the field of communication. A common feature of both ap- proaches is the fact that brand equity is an added value, which is obtained through the use of a trademark.
Considering matters related to brand equity, it needs to be noted that its value is perceived differently depending on the perspective assumed to assess it, i.e., from the level of the brand owner, its customers or the entire distribution channel (Farquar, 1989). Therefore, the multilevel perception of brand equity gives insight into the process of creating brand value, which results from mutual relations and interactions between the enterprise being the brand owner and its surroundings (customers, suppliers, etc.).
In the above context, outstanding representatives of management sciences refer to the term of band equity, among others Aaker (1991) and Keller (2011) who understand brand equity as “assets (resources) of a brand and obligations related to the brand, its name and symbol, which add or reduce the value to products or services provided by a given entity to other enterprises or individual customers”. According to the authors being quoted, brand equity should be ana- lyzed and assessed through a prism of five elements, which jointly affect the
added value for customers and brand owners. The first of the listed elements, i.e., loyalty towards a given brand, constitutes a value in itself, as it allows a reduction of broadly understood marketing costs (e.g., for promotional and advertising activities). Moreover, loyal and satisfied customers relatively will- ingly recommend the purchased brand to other people, fulfilling the role of an ambassador/promoter. The second element is market recognition. A high level of brand recognition positively impacts purchasing decisions at all stages of the decision-making process during shopping. While the perception of high quality is a cause for a conscious purchase as well as the basis for product differentia- tion. Products perceived as high quality are attractive not only for final customers, but also for intermediate links, as they provide a basis for higher margins, simultaneously constituting a good opportunity to extend product lines.
Considering previous experiences related to a brand, it improves the decision- -making process when shopping and it leads to the reduction of the post-purchase dissonance (Hasan & Nasreen, 2014). The last element of the presented model of brand equity consists of other assets related to a given brand (trademarks, patents, etc.) which developed for many years co-create the added value of the offered brand.
However, their creation (manufacturing) requires significant expenditure and efforts of the company-owner of the brand. At the same time, it must be noted that brand equity brings specific economic benefit for its owner and in this aspect, it fulfils the assumptions of the definition of assets of an enterprise.
3. Hypotheses development
Results of research concerning the significance of a brand in marketing ac- tivities confirm the importance, as well as the existence of relationships between brand awareness, brand image and brand equity. In their research Chang, Hsu,
& Chung (2008), Alhaddad (2014) and Huang & Sarigollu (2014) pay attention to the key role of brand awareness in building brand capital. Furthermore, re- search shows that high brand awareness generates an increase in the probability of the brand being chosen among available alternatives (Nedungadi, 1990).
There is a lot of empirical evidence confirming the positive association between the brand image and brand equity. It is shown among others in the results of research conducted by Juntunen et al. (2011) who paid attention to the direct relationship between brand awareness and brand image and its equity. Similar conclusions were made by Davis et al. (2008) who proved that the influence of brand image on brand equity is greater than the influence of brand awareness on
brand equity. The work of Ansary & Nik Hashim (2017) has also revealed that brand image had a significant positive effect on brand equity.
Based on these considerations, we formulated the following research hy- potheses:
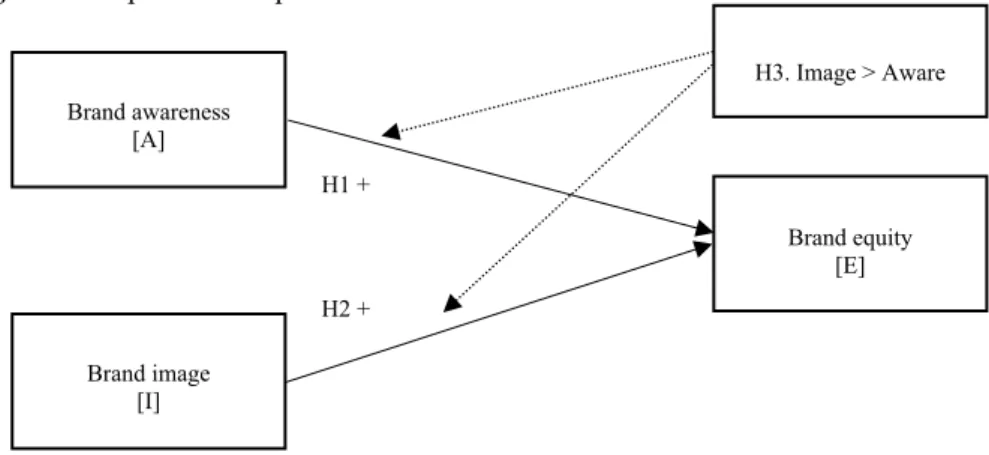
H1: Path coefficient for A → E is greater than zero,
H2: Path coefficient for I → E is greater than zero,
H3: Path coefficient for I → E is greater than for A → E.
Figure 1 shows the conceptual model of our study and the relationships be- tween our three hypotheses.
Figure 1. Proposed conceptual model
4. Research methodology
4.1. Sampling and data collection
The research was conducted at the turn of 2016 and 2017 on a deliberately selected sample of 100 enterprises representing customers of logistics service providers. Respondents completed an electronic survey online. Invitations to participate in the research were sent electronically by interviewers from the EU Research and Expertise Center in Katowice. Data obtained in such a way was subject to analysis using the SPSS package and R program (plspm package). The analyses were carried out under the assumption that the observed data is a reali- zation of a simple random sample (i.i.d.). To estimate relationships between variables, an analysis of structural equations was performed using the partial least squares method. This way, the structure and strength of dependencies be- tween the studied variables were studied.
Brand awareness [A]
Brand image [I]
Brand equity [E]
H3. Image > Aware
H1 +
H2 +
Typically, two main circumstances are taken into consideration when the required sample size is to be calculated. The first one is related to requirements on the properties of inferences such as the required standard error of the point estimate, required length of the confidence interval or required power of the test.
In our case, no such prior requirements were set in advance so the first circum- stance did not weigh on planning the survey. The lengths of obtained confidence intervals provide sample assessment of accuracy for path coefficients. The sec- ond circumstance is related to the fact that unknown or complicated distribution of an estimator or the test statistic is approximated by some other, simpler and more tractable distribution. The required sample size is usually dependent on characteristics of the unknown true distribution as well as required approxima- tion accuracy, and on the way errors are propagated in the inference procedure.
Apart from some very specific, well-defined situations, typically some consen- sus is formed as to the required sample size for a particular method of inference.
In case of pls-pm models it is sometimes advised that the sample size should be at least ten times higher than the largest number of independent variables influ- encing a dependent variable (Chin & Newsted, 1999; Large, Kramer, & Hart- mann, 2011). Other guidelines provided by Seker (2013) and Raoprasert & Islam (2010), specify that it should not be fewer than 100. Those requirements are satisfied. Other authors, like Sagan (2015), suggest a minimum of 200 units, which is not met. All these criteria should however be interpreted with caution, because they are formulated for a general use of pls-pm models typically involv- ing the use of a t-test to verify significance of model parameters. In our case this inference is done in a non-standard nonparametric way through bootstrap simu- lation method. Such a method on one hand is potentially robust with respect to model misspecification and capable of handling substantial departures from clas- sical distributions (such as Student’s t). On the other hand little advice is avail- able on the minimum sample sizes in such situation. The accuracy of bootstrap inference also depends on the number of sample replications. Depending on the source is usually advised to employ at least 100 sample replications (Efron
& Tibshirani, 1994). Hence we have decided to use 10.000 sample replications to reduce eventual simulation errors.
The structure of the studied enterprises – considering their business profile – was dominated by manufacturing and trade enterprises constituting 46% and 30% of the studied group respectively. The service-oriented business profile was indicated by 9%, and the mixed profile by 15% of participants. 60% of respon- dents were employees employed in the SME sector, excluding microenterprises.
Large enterprises were represented by 40% of participants. In the research, com- panies with national equity constituted the majority (59%). Foreign equity was
declared by 30%, and mixed-equity – by 11%. Considering the geographic reach, the largest group included companies running international activities (45%). Global reach was indicated in the case of 24% of participants, and the national reach – by 31% of enterprises. Concerning the criterion of industry af- filiation, participants represented mostly the food industry, automotive industry, construction industry and furniture industry. Representatives of fuel and clothing industries constituted a small percentage of the sample. Respondents participat- ing in the research were mainly employees employed as managers in the de- partments of logistics, customer service and trade, as well as managers and di- rectors of companies.
4.2. Measurement model and manifest variables
In the research, a modified version of the methodology presented in the ar- ticle by Davis et al. (2008), which was based on Keller’s brand equity concept was used. Hints provided by Aaker (1991) on brand equity measurement became an important point of reference at this stage of research.
The suggested model consists of three hidden variables, i.e. brand equity (dependent variable), brand awareness and brand image (independent variable).
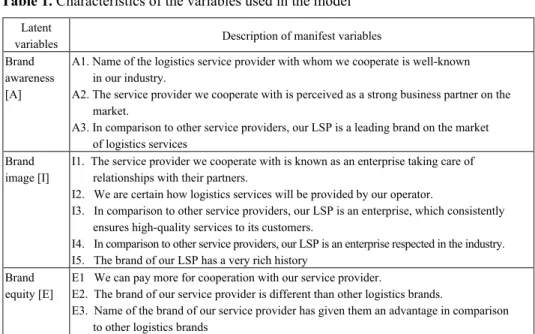
For each of the latent constructs, several candidate manifest variables were con- sidered. Each of them was measured on the seven-categories discrete scale. It was assumed that they all represent underlying latent variables in a reflexive way. To be more precise, measurement of variables was performed using a ques- tionnaire consisting of eleven closed questions arranged into three thematic blocks. The first part contained three scales referring to brand awareness. In terms of meaning, statements of the scale refer to knowledge and recognition of a given brand on the market of logistics services. The second part contained five scales aimed at assessing brand image. A rather broad set of factors reflecting the perceptions of a brand by the customer was taken into account when the scales were created. The last part of the questionnaire consisted of three scales of brand equity measurement. In terms of meaning, statements of the scale refer to Aaker’s (1991) attributes of brand equity referring to a corporate brand. Both loyalty towards a given brand as well as brand awareness were taken into ac- count in the context of its advantage and difference in comparison to competitive brands. Detailed descriptions of scales used in the research are presented in Ta- ble 1.
Table 1. Characteristics of the variables used in the model Latent
variables Description of manifest variables Brand
awareness [A]
A1. Name of the logistics service provider with whom we cooperate is well-known in our industry.
A2. The service provider we cooperate with is perceived as a strong business partner on the market.
A3. In comparison to other service providers, our LSP is a leading brand on the market of logistics services
Brand image [I]
I1. The service provider we cooperate with is known as an enterprise taking care of relationships with their partners.
I2. We are certain how logistics services will be provided by our operator.
I3. In comparison to other service providers, our LSP is an enterprise, which consistently ensures high-quality services to its customers.
I4. In comparison to other service providers, our LSP is an enterprise respected in the industry.
I5. The brand of our LSP has a very rich history Brand
equity [E]
E1 We can pay more for cooperation with our service provider.
E2. The brand of our service provider is different than other logistics brands.
E3. Name of the brand of our service provider has given them an advantage in comparison to other logistics brands
4.3. Scale purification
A reliability analysis was carried out to assess the outer model. Following recommendations of Henseler, Hubona, & Ray (2016) it was desired that both Cronbach α indicator and Dillon−Goldstein composite reliability index ρ are greater or equal to 0.7 for any block of manifest variables corresponding to any latent variable. Following the suggestion of Large et al. (2011) it was also desired that for every manifest variable corresponding factor loading is greater or equal to 0.7.
For latent variables A and I both α and ρ exceeded 0.8 and all factor loadings exceeded 0.7. However for the variable E the indicator ρ = 0.81 was accompanied by α = 0.68 and factor loadings for manifest variable E2 took highly unsatisfactory values of 0.59 and 0.46. After removing this variable the Dillon−Goldstein indicator improved to ρ = 0.84 and factor loadings for remaining variables E1, and E3 were respectively equal to satisfactory values 0.7772 and 0.9136. Meanwhile the Cronbach coefficient worsened to 0.61 suggesting that the unidimendionality of K variable is still rather questionable.
However, following the suggestion of Chin (1998) to place more emphasis on Dillon−Goldstein indicator the analysis was continued with the remaining ten manifest variables including E1 and E3 for E.
4.4. Measurement variable assessment after scale purification
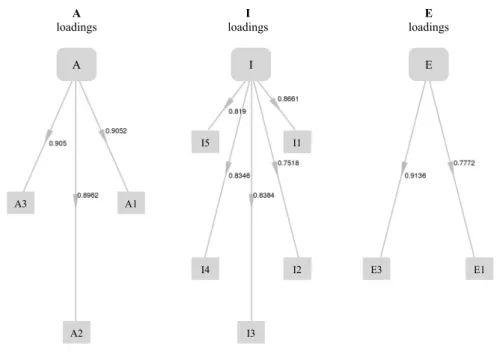
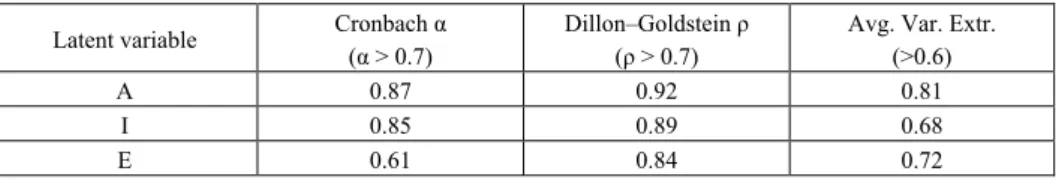
Scale evaluation diagnostics are presented in Figure 2. For all the manifest variables factor loadings exceed 0.7. Block unidimensionality measures are shown in Table 2. Values of ρ take acceptable values exceeding 0.84 for any latent variable, which suggests that proposed model is sufficiently reliable.
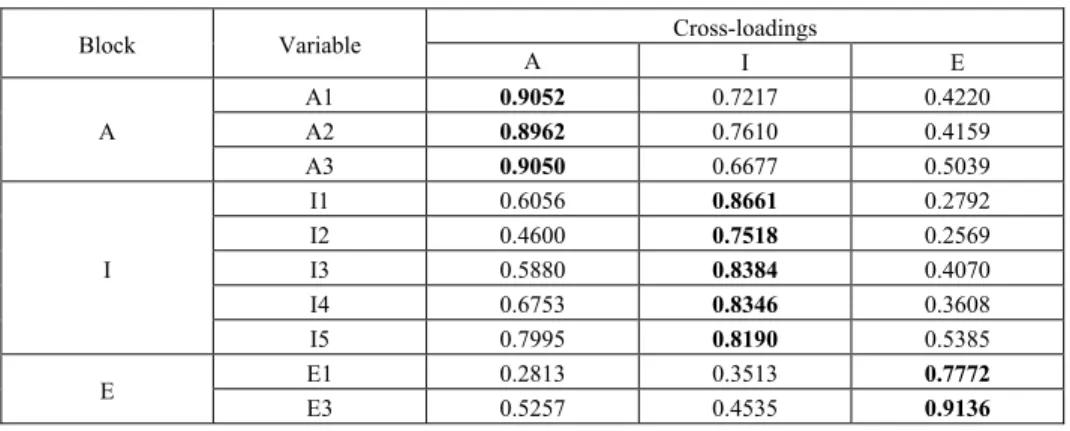
Moreover, the average variance extracted (AVE) indicator exceeds 0.6 which satisfies the requirements of convergent validity. Calculated cross-loading values are shown in Table 3. For every manifest variable the loading corresponding to a latent variable it represents is higher than all of cross-loadings so we conclude that Chin’s (1998) criterion of discriminant validity (e.g., Henseler, Ringle,
& Sinkovics, 2009) is also fulfilled.
Figure 2. Scale evaluation results: loadings corresponding to manifest variables after dropping variable E2
Table 2. Reliability and validity of the measurement model Latent variable Cronbach α
(α > 0.7)
Dillon–Goldstein ρ (ρ > 0.7)
Avg. Var. Extr.
(>0.6)
A 0.87 0.92 0.81
I 0.85 0.89 0.68
E 0.61 0.84 0.72
A loadings
I loadings
E loadings
A I E
I1
A1
A2 A3
I2
I3 I4 I5
E3 E1
Table 3. Cross-loadings in the outer model after the elimination of the variable E2
Block Variable Cross-loadings
A I E
A
A1 0.9052 0.7217 0.4220
A2 0.8962 0.7610 0.4159
A3 0.9050 0.6677 0.5039
I
I1 0.6056 0.8661 0.2792
I2 0.4600 0.7518 0.2569
I3 0.5880 0.8384 0.4070
I4 0.6753 0.8346 0.3608
I5 0.7995 0.8190 0.5385
E E1 0.2813 0.3513 0.7772
E3 0.5257 0.4535 0.9136
5. Research findings 5.1. The structural model
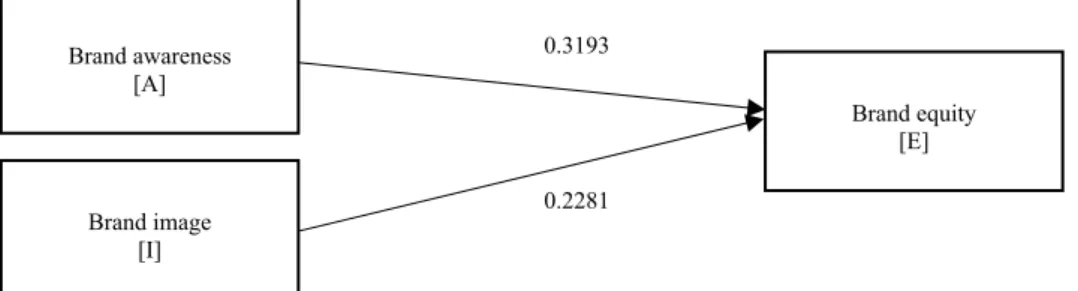
The path relationships of the structural model were estimated using R plspm package developed by Sanchez & Trinchera (2010). Estimated path coefficients are shown in Figure 3. Both are strictly positive, but not very high. The summary of structural model parameter estimates is shown in Table 4.
Figure 3. Research model with estimated coefficients (for direct effects)
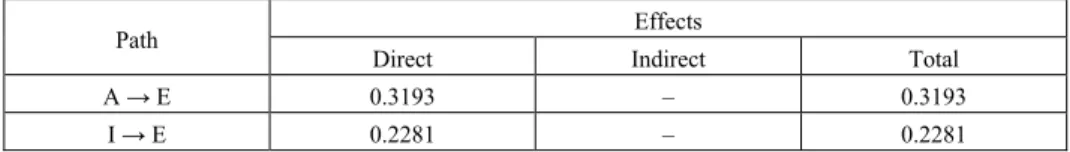
Table 4. Values of coefficients for direct effects
Path Effects
Direct Indirect Total
A → E 0.3193 – 0.3193
I → E 0.2281 – 0.2281
Brand awareness [A]
Brand equity [E]
0.3193
Brand image [I]
0.2281
The determination coefficient R2 for structural equation describing the only endogenous variable E is equal to 0.269. Hence, following recommendations of Henseler et al. (2009), the structural equation for E may be interpreted as weakly fitting.
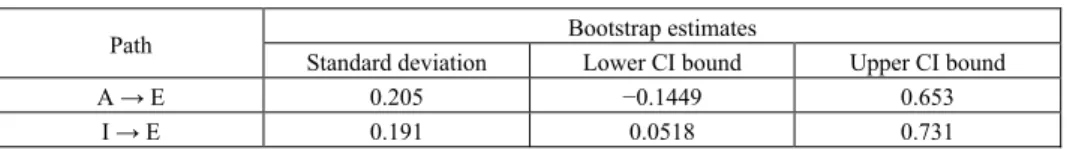
Empirical distribution of path coefficients was evaluated through the non- -parametric boostrap resampling procedure. A total of 10.000 sample replications were drawn. Resulting upper and lower bounds of 95% confidence intervals for direct path effects are presented in Table 5.
Table 5. Path effect 95% confidence intervals obtained by bootstrap simulation
Path Bootstrap estimates
Standard deviation Lower CI bound Upper CI bound
A → E 0.205 −0.1449 0.653
I → E 0.191 0.0518 0.731
5.2. Hypotheses testing
Referring to hypotheses H1 and H2, the confidence interval for the path A → E does contain zero, while the interval for the path I → E does not. These two facts by themselves may be treated as the evidence that the path effect for the first one does not differ significantly from zero, while the path effect for the other is significantly higher than zero. However, both confidence intervals largely overlap which may paradoxically be interpreted as the evidence that the difference between both path effects is not statistically significant. The apparent contradiction of these inferences is perfectly explainable from a technical point of view, since any statistical test is burdened with a non-zero probability of making some error. Either it is an ‘error of the I type’ equivalent to rejection of the hypothesis when it is true, or it is an ‘error of the II type’: equivalent to not rejecting the hypothesis when it is false. Observed contradiction indicates that at least one of these inferences is false (one on individual coefficients or on their difference) but does not allow to recognize which one. Meanwhile the observed data quite convincingly contradicts the hypothesis H3. The overlap between confidence intervals for both path coefficients and the fact that the interval for the path I → E is shifted to the right rather than to the left with respect to interval for A → E may be treated as the evidence that the hypothesis H3 should be rejected.
6. Discussion
In the context of the undertaken research problem, research carried out by Marquardt, Golicic, & Davis (2011), who proved themselves very active with regards to studies of brand equity in the sector of logistics services, deserve spe- cial attention. In the first study, based on the analysis of responses obtained from 144 LSPs, the authors explain the mechanism how brand management affects brand equity, acknowledging the key role of brand in creating competitive ad- vantage. They also emphasize the role of brand in offer differentiation and pro- vide evidence that LSPs can increase brand awareness by developing and pro- moting a brand name that means something to customers. In the subsequent studies Davis et al. (2008) – based on the opinions of 71 customers – indicate the existence of positive relationships between brand awareness and brand equity as well as between brand image and brand equity. Furthermore, the results show that customers are willing to pay more to cooperate with LSP with strong, posi- tive brand images. They also present evidence that the effect of brand image on brand equity was significantly greater than the effect of brand awareness. What is important, the influence of brand awareness and brand image on brand equity was also confirmed in the studies conducted by Juntunen et al. (2011) among 235 logistics service purchasers. Therefore, the quoted results contradict our findings. In comparison to our research, the model used in the studies conducted by Davis et al. (2008) turned out to be much better suited to the data (R2 = .59).
It is difficult to clearly explain the discrepancies; however, they may be caused by different research locations (different cultural surroundings) and dif- ferences in the structure of the research sample. While in the above research, large enterprises constituted the majority (63%), in our research, the research sample consisted mainly of small and medium enterprises (60%). The differ- ences are also visible with regards to other metrics. In both cases, different tools to test the hypotheses were used.
In reference to the above, it should be emphasized that numerous authors draw attention to the difference in behaviors of the companies from the SME sector in comparison to activities of large enterprises (e.g., Eriksson, 2016;
Matejun & Motyka, 2016), as well as the differences between Polish enterprises in comparison to enterprises from other countries (e.g., Strzyżewska, 2011).
Considering the latter, the obtained results can be explained in two ways – the first one refers to respondents’ low awareness of benefits that can be achieved by building brand equity, which is suggested by research on the condition and de- velopment of marketing of enterprises operating in Poland. Its results indicate among others a low level of marketing awareness and a limited scope of market-
ing activities of those companies (Szostek, 2012). Another explanation is related to low marketing activities of logistics service providers and their likely low involvement in building a strong brand. It is indicated among others in our pre- vious results in accordance with which the Polish market of logistics services is dominated by a sales model without a clear marketing concept (Świtała, 2013).
This point of view is also confirmed by research conducted by Zowada (2012) from which it can be concluded that most customers on the market do not see any marketing activities in business activities run by LSPs.
7. Conclusions
The presented results of the research are consistent with the context of discussions on brand management in a B2B segment broadly discussed in marketing literature, and the main objective of our research was to determine the influence of brand awareness and brand image on brand equity in logistics outsourcing relationships context. As highlighted by numerous authors (i.a., Delgado-Ballester & Munuera-Aleman, 2001; Stahl, Heitmann, Lehmann,
& Neslin, 2012; Veselinova & Samonikov, 2018), brand plays an important role in the decision-making process concerning purchases as well as in building customers’ trust, which translates into greater loyalty of customers and their readiness to incur additional costs, as it can be concluded from research conducted by Lassar, Mittal, & Sharma (1995).
As a result of the conducted research, none of the assumed hypotheses was verified positively. In our research, we did not find sufficient basis to accept or reject H1 and H2 hypotheses, which assumed the existence of positive relations between the constructs of our model. Although in both studied paths, i.e., A → E and I → E, the value of coefficients for direct effects turned out to be positive, which may suggest that both brand awareness, as well as its image, beneficially impact brand equity; it should be emphasized that this influence was not sufficiently strong. Simultaneously, thanks to the bootstrap simulations carried out to estimate confidence intervals, it turned out that the difference between effects A→ E and I→ E is not statistically significant. Therefore, the suspicion that the influence of brand image on brand equity is greater than the influence of brand awareness on brand equity (H3) was wrong.
Considering the above, it is difficult to formulate clear conclusions regarding the studied dependencies. Certainly, despite the lack of sufficient evidence in the form of our own research, the key role of brand equity on customers’ behavior has been confirmed by many empirical studies (i.a., Na,
Marshall, & Keller, 1999; Netemeyer et al., 2004; Kuhn, Alpert, & Pope, 2008).
It is also hard to deny the significance of brand on the market of logistics services. For instance, it is confirmed by the results of research conducted by Qureshi, Kumar, & Kumar (2008), which assigns an important role to brand in the selection of a logistics service provider, and research conducted by Grant et al. (2014) among customer of the logistics market from which it can be concluded that satisfaction, loyalty and quality of services positively impact corporate brand equity of third-party service providers. Additionally, the authors’
previous research showed that LSPs brand equity has a positive effect on service levels experienced by customers (Grant, Juntunen, Juga, & Juntunen, 2009). It is worth highlighting that according to numerous authors, brand equity is especially significant for the sector of services where it is difficult to assess the value of services before purchasing them (Blankson & Caliphates, 1999;
Krishnan & Hartline, 2001). Moreover, Kotler & Pfoertsch (2006) emphasize that in the case of industrial services, brand management is an effective and attractive method to build a permanent competitive advantage.
Thus, from a managerial point of view, LSPs must be aware that developing the strength of a brand can give them a positive impact on building a long-term relationships with customers, especially in comparison to companies with weaker brand.
This study is not free of limitations. Firstly, our sample was restricted to customers of LSPs. This means that further analysis should be extended to LSPs’
perception on how brand awareness and brand image influence brand equity.
Secondly, the observed data are too imprecise to be unambiguously interpreted in the context of H1 and H2, and that a wider survey with more precise point estimates is needed to formally asses the veracity of these hypotheses. It is worth noting in this respect that our sample size was relatively small, and it might be insufficient to rely on asymptotic properties of sample statistics through the central limit theorem. Moreover, some simulation results show that for samples even larger than ours, particular discrete distributions of Likert-scale random variables exist for which the real significance level obtained by relying on the normality assumption is grossly distorted. Hence to conduct inference about model parameters in our analysis the bootstrap nonparametric confidence intervals were employed instead of parametric significance tests. At the same time, other explanatory variables should be included in further research, in particular those relating to logistics field. Therefore, it is worth examining the correlations between the specific benefits of logistics service performance and the components of brand equity. Another potential trend for further research is to evaluate the impact of brand equity on 3PL-relationships success.
References
Aaker, D. A. (1991). Managing brand equity. Capitalizing on the value of a brand name.
New York: Free Press.
Alhaddad, A. (2014). The effect of brand image and brand loyalty on brand equity. In- ternational Journal of Business and Management Invention, 3(5), 28-32.
Altaf, M., Iqbal, N., Mokhtar, S. S. N., & Sial, M. H. (2017). Managing consumer-based brand equity through brand experience in Islamic banking. Journal of Islamic Mar- keting, 8(2), 218-242. doi: 10.1108/JIMA-07-2015-0048
Ansary, A., & Nik Hashim, N. M. H. (2017). Brand image and equity: The mediating role of brand equity drivers and moderating effects of product type and word of mouth. Review of Managerial Science, 1-34. doi: 10.1007/s11846-017-0235-2 Aziz, Z. A., Razak, R. C., Yaacob, M. R., & Rahim, R. C. (2015). Logistics resources as
a source of competitive advantage for logistics service providers. Journal of Scien- tific Research and Development, 2(10), 105-111.
Biedenbach, G., Bengtsson, M., & Marell, A. (2015). Brand equity, satisfaction, and switch- ing costs: An examination of effects in the business-to-business setting. Marketing In- telligence & Planning, 33(2), 164-178. doi: 10.1108/MIP-03-2014-0059
Blankson, C., & Caliphates, S. P. (1999). Issues and challenges in the positioning of service brands. A review. Journal of Product and Brand Management, 8(2), 106- 118. doi: 10.1108/10610429910266968
Capriotti, P. (1999). Planificación estratégica de la imagen corporativa. Ariel: Barcelona.
Chang, H. H., Hsu, C. H., & Chung, S. H. (2008). The antecedents and consequences of brand equity in service markets. Asia Pacific Management Review, 13(3), 601-624.
doi: 10.6126/APMR.2008.13.3.04
De Chernatony, L., & McDonald, M. (2000). Creating powerful brands in consumer, service and industrial markets. Oxford: Butterworth-Heinemann.
Chin, W. W. (1998). The partial least squares approach to structural equation modeling.
In G. A. Marcoulides (Ed.), Modern methods for business research (pp. 295-238).
Mahwah, NJ: Lawrence Earlbaum Associates.
Chin, W. W., & Newsted, P. R. (1999). Structural equation modelling analysis with small samples using partial least squares. In R. H. Hoyle (Ed.), Statistical strategies for small sample research (pp. 307-342). Thousand Oaks: Sage.
Da Silva, R. V., & Syed Alwi, S. F. (2008). Online brand attributes and online corporate brand images. European Journal of Marketing, 9/10(42), 1039-1058.
Daszkiewicz, M., & Wrona, S. (2013). Walka na wizerunki – znane twarze w kreowaniu wartości marki [The battle of image – celebrity endorsers in creating brand equity].
Handel Wewnętrzny, 3(1), 277-284.
Davis, D. F., Golicic, S. L., & Marquardt, A. J. (2008). Branding a B2B service: Does a brand differentiate a logistics service provider? Industrial Marketing Management, 37(2), 218-227. doi: 10.1016/j.indmarman.2007.02.003
D E E
F F
G
G
H
H
H
H H
H J
J Delg Efro Erik
Farq Farr
Gran
Gran
Has
Hen
Hen
Hoe Hua
Hun Juga
Junt gad
co on,
Sp ksso pu na 10 quar ris, P
Th Sa nt,
ac
&
of ve nt,
th 10 an, ch 2(
nsele pa M nsele
te Sy effle of ang, br co Sp ng, C
to a, J.
tio An tune m 30
do-B onsu B., prin on,
ublic ation 0.11
r, P P. W he d addl
G., chie C.
f the ersit
D., hird- 0.11 U., hase (2), er, J ath Mark er, chn ystem er, S f Bra R.
rand onsu prin C. H
mer ., Ju on a n In en, M marke
00-3 Balle
ume
&
nger H.
c an nal 108/
. H.
W., defi le R Ju ve
S. L e 14 ty B Jun -par 108/
&
e di 65- J., R
mo ketin J., nolo ms, S., &
and , &
d eq ume nger H. ( r loy untu and ntern
M., ets:
311.
este er lo Tib r.
(20 nd p Jo /IJQ
(19 Ben initi Rive untun
sati Lalw 4th Busi ntun rty s /JSM
Nas isson -77.
Ring odel ng – Hu gy 116
& K d Ma
& Sa quity er b r. do (200 yalt unen loy nati Jun A .
er, E oyal
bshi 016) priv
urn QRM
989) ndle ive er.
nen isfac wan Inte nes nen, serv M-0 sree nan gle, ling – Ad ubon res 6(1) Kelle anag arigö y an beha oi: 1 08).
ty. I n, J.
yalty iona ntun stud
E., &
ty. E iran ). O ate, al o M-03 ). M e, N
gui n, J.
ctio ni (E
erna s Sc , J., vice 06-2 en, R nce
, C.
g in dvan na,
sear ), 2- er, K
gem öllü nd t avio 0.1
Th Inter
., &
y in al Jo nen, dy a
& M Eur ni, R Outc
, ma of Q 3-20 Mana N. T.
ide ., Ju
n a Eds.
atio choo
Jug pro 2012 R. ( and M., n in nces G., rch:
-20.
K. L ment ü, E the ors.
007 he ef rna
& Gr n log
ourn J., amo
Mun rope R. J com anuf Qua 014 agin ., Pf to uga and .), G
nal ol, 4 ga, ovid 2-01 (201 d co &
nter s in
&
U . L. (2
t, 10 E. (2 mar In 7/97 ffec tion rant gist nal,
& J ong
nuer ean J. ( me o
fact ality
-00 ng b feife mea , J.
turn Glob Sym 408
J., ders 104 14).
onsu Sin rnati Inte Ra Upda 2003 0(6) 2014
rket ntern 78-1 ct of nal J t, D tics
20 Juga
log ra-A
Jou 199 of q turin y &
31 bran fer, P
asur , &
n co bal
mpo -41
& J s. Jo Th ume nkov iona erna ay, ated 3). T ), 42 4).
ting nati -49 f br Jou . B.
out (6), a, J.
gistic Alem
urna 94).
qual ng a
& Re nd e
P. E ring
& Ju orpo
supp osiu
4.
Junt ourn he em
er b vics al m atio
P. A d gu
The 21-4
How g mi
iona 939- rand rna (20 tsou , 49 . (20 cs s
mán al of
An lity and elia quit E., &
g m untu orat pply
um tune nal mpi beha s, R
mar onal A.
uide ma 445.
w b ix.
al s -027 d im
l of 010 urcin
6-5 011 serv
, J.
f Ma int
ma serv bili ty. M
& R mark unen te b
cha on en, of S irica avio R. R
rket l Ma
(20 elin arke
. bran
In T seri 77-4 mage f Ma ). S ng r 10.
). C ice
L.
Marke trod anag vice ity M
Mar Reibs ketin n, M
rand ains
Log M.
Serv al st our.
. (2 ting arke 016) nes.
eting nd a T. M ies 4_8 e on anag Serv
rela doi Corp
pur (20 etin duct gem e, S Man
rket stein ng p M. (
d eq s an gisti (20 vice tudy Jo 2009
. N eting ). U
In
g ad awa M. C
on n pu gem vice ation i: 10 pora rcha
001) ng, 3 tion ment
ME nag
ting n, D perf (200 quit nd in ics, 014) es M y of
urn 9). T New
g, 2 Usin dus
dvan arene Cho co ublic ment
qua nshi 0.11 ate b aser
). B 35(1 n to
pra E an geme
g Res D. J.
form 09).
ty in nter
No ). In Mar
f rel al o The w C 20, 2 ng P stria
ntag ess oi (E onsu
c re t, 25 ality ips.
108/
bran s. B
Bran 11/1 the acti nd la ent,
sear . (20 man
. U nto r-firm ottin
nves rketi latio
of M use Chal
277- PLS al M
ges o rela Ed.) ume latio 5(2) y an Ma /096 nd e Bran
nd tr 12), e bo ices arge
33
rch, 010 nce.
sing loy m n ngha stiga ing, onsh
Mar e of leng -319 pa Man
of s ates ), F er s ons ), 23 nd it anag 6045 equit nd M
rust 123 oots : D e org 3(9),
, 1(3 0). M NJ g lo yalty netw
am:
atin 28 hip rket f pa ges 9.
ath nage
tron s to Fash scie per 37-2 ts re ging 521 ty a Man
t in 38-1 strap Diffe
gan , 13 3), 2 Mark J: P ogis y. I work No ng b 8(3), betw ting artia to mo eme
ng b ma hion ence rcep 246.
elati g Se 011 and nage
the 125 ap. N
eren nizat 394 24-3 keti Pear tics n K ks. P ottin bran
, 21 wee g M
al le In deli ent
bran arke n bra
e. N ption .
ion ervi 1092
loy eme
e co 8.
New nces
tion -14 33.
ing son s se K. S
Proc ngha nd e
4-2 en p Mana east ntern
ing an
nds.
et o and New ns a to s ice Q
285 alty ent,
ontex w Y s am ns. I
05.
met n, U rvic S. P
ceed am
quit 222.
post agem
squ nati
in nd D
Jou outco ding w Y
and sati Qua
7 y in
18(
xt o York mon Inter do
trics Uppe ce t awa ding Un ty o do
pur men
uare iona new Dat urna
ome g an York
cus sfac ality B2B (4/5
of k:
ng r-
i:
s:
er to ar gs
i- of
i:
r- nt,
es al w ta al e, nd k:
s- c- y:
B ),