J. Global Business Advancement, Vol. 10, No. 5, 2017 527
Copyright © 2017 Inderscience Enterprises Ltd.
Impact of electronic word-of-mouth communication on building brand equity: an Indonesian perspective
M.S. Mahrinasari*
Faculty of Economics and Business, The University of Lampung,
Bandar Lampung, Bandarlampung, 35141, Indonesia Email: [email protected]
Christopher Marquette*
School of Business, Department of Finance,
American University of Ras Al Khaimah, Ras Al Khaimah, UAE
Email: [email protected]
*Corresponding authors
Satria Bangsawan
Faculty of Economics and Business The University of Lampung, Bandar Lampung, 35141, Indonesia Email: [email protected]
Abstract: The objective of this study is to develop a model of electronic word of mouth (eWOM) communication. We examine the effect of consumers’
restaurant experience (CREp) and country of origin (COO) on eWOM and the effect that eWOM and COO have on brand equity. We survey 360 diners in restaurants in Indonesia in which we get 323 usable responses and analyse the data with Tobit regressions. We find that CREp and COO have a significantly positive effect on eWOM and eWOM and COO have a significantly positive effect on brand equity.
Keywords: CREp; consumers’ restaurant experience; COO; country of origin;
eWOM; electronic word of mouth; brand equity.
Reference to this paper should be made as follows: Mahrinasari, M.S., Marquette, C. and Bangsawan, S. (2017) ‘Impact of electronic word-of-mouth communication on building brand equity: an Indonesian perspective’, J. Global Business Advancement, Vol. 10, No. 5, pp.527–545.
Biographical notes: M.S. Mahrinasari is an Associate Professor of Marketing and as a Vice Dean of Academic and Cooperation Affair, Faculty of Economics and Business, The University of Lampung. She got a PhD in Marketing, from Universitas Gadjah Mada, Indonesia in February 2014, and a Master degree in Business Administration, from College of Business, University of Illinois at
528 M.S. Mahrinasari et al.
Urbana-Champaign USA in January 1995. She was a member of American Marketing Association in 1994–1996. She has been joining with Academy for Global Business Advancement (http://agba.us/leadership.html) since 2016, as an AGBA Vice President for Southern Indonesia.
Christopher Marquette is an Associate Professor of Finance and Chair, Department of Accounting and Finance at American University of Ras Al Khaimah. He received a PhD in Finance from Texas A&M University in 1998 and has published numerous articles in well-respected business journals.
Satria Bangsawan is a Professor of Marketing and as a Dean, Faculty of Economics and Business, The University of Lampung. He received a PhD in Small Medium and Cooperative Business Management from Universitas Padjajaran, Indonesia in 1997 and a Master degree in Business Management, from Universitas Padjajaran, Indonesia in 1992. He is a well management consultant, affiliated with some companies (stated owned companies, such as PT Perkebunan Nusantara VII (Persero) Indonesia, private companies such as PT Great Giant Pineapple and PT Coca Cola Company, Indonesia), and government institution, such as Central Bank of Indonesia, Chapter Lampung.
1 Introduction
Recent advancement of internet technology has created different avenues for information dissemination that can affect sentiment about a firm and its products/services.
Information that is spread by consumers through electronic communication media is termed electronic word of mouth (eWOM). eWOM has a powerful impact on customers’
action (Litvin et al., 2008). Customers can publish their thoughts, opinions, and feelings about products and services online either by emailing or by writing on blogs (Schindler and Bickart, 2005). eWOM spreads more widely and rapidly than traditional WOM owing to eWOM’s unique characteristics. eWOM can be directed at multiple individuals, can be anonymous and is available at all times (Litvin et al., 2008). Consequently, eWOM can have a significant impact on building the marketing performance of a company, such as strengthening its brand equity.
Electronic WOM has been implemented more frequently than traditional WOM recently because of its greater accessibility to the consumer and its ability to reach a larger number of consumers (Chatterjee, 2001). It has become increasingly common for consumers to look for online product reviews when deciding on a purchase (Adjei et al., 2009; Zhu and Zhang, 2010). These reviews can form purchase intentions in the consumer (Zhang and Tran, 2009).
eWOM is considered to be able to build strong brand equity (Murtiasih et al., 2014) as well, which can increase customers’ trust in the product and influence the company’s future profits (Yoo and Donthu, 2001). Murtiasih et al. (2013) also show that country of origin (COO) can affect eWOM, i.e., a consumer will recommend products from countries that he or she considers to have high-quality products in general.
These findings indicate that identifying sources of positive eWOM can be beneficial to commercial firms. However, research on eWOM is still limited. Jeong and Jang (2011) state that the impact of eWOM in hospitality-related industries, especially the restaurant segment, has yet to be studied extensively.
Impact of electronic word-of-mouth communication 529 This study investigates eWOM in the restaurant industry in Indonesia. Its first objective is to investigate the effect of customers’ experience and COO on eWOM.
It also examines which restaurant experiences can induce customers to engage in positive eWOM and if eWOM builds brand equity. Lastly, it determines if COO has a positive direct effect on brand equity and/or an indirect effect on such through eWOM.
2 Literature review
2.1 Word of mouth (WOM)
Harrison-Walker (2001) defines WOM as “informal, person to person communication between a perceived noncommercial communicator and a receiver regarding a brand, a product, an organisation, or a service”. Hawkins et al. (2004) define WOM as a process that allows consumers to share information and opinions about a specific product, brand or service in order to direct buyers toward or away from the product, brand or service.
WOM is an effective means of disseminating an opinion because it is usually given face-to-face in the conversation between people who are familiar with each other and share some credibility as acquaintances or friends. Body language and voice intonation can also reinforce the message. Jeong and Jang (2011) give an example for that situation, a tongue sticking out in disgust for a negative review or eyes rolled heavenward for a positive one will be better remembered than words alone (Mazzarol and Sweeney, 2007).
Therefore, there are two kinds of eWOM emerging, concerning for other consumers and the desire to express positive feelings or self-enhancement, that are the main reasons people engage in eWOM communication. While the negative eWOM articulation on various websites will also emerge if they get something wrong in the products or services.
Zeithaml et al. (1996) proposes a model of the behavioural consequences of service quality and suggested that perceived service quality was related to positive behavioural intentions including WOM, purchase intentions, complaining behaviour, and price sensitivity. Alexandris et al. (2002) investigates the degree to which behavioural intentions can be explained by the dimensions of service quality. They used four behavioural intention criteria proposed by Zeithaml et al. (1996) to measure behavioural intentions and the five dimensions of SERVQUAL to measure perceived service quality.
Their results indicate that the service quality dimensions explained 93% of the variance in WOM. Harrison-Walker (2001) also investigates service quality as an antecedent of WOM communication and found partial support for the level of perceived service quality positively affecting the favourableness of an individual’s WOM communication. These studies’ findings support the idea that service quality is a reasonable antecedent of WOM communication. Due to the conceptual similarity between WOM and eWOM, utilising service quality as an antecedent of eWOM communication is also deemed reasonable.
Therefore, there should be a reasonable causal effect between the dining experience and eWOM motivation. Among the nine eWOM motives identified in the literature review, social benefits, economic incentives, and self- enhancement could be generated regardless of consumers’ dining experiences. For example, consumers who want to
530 M.S. Mahrinasari et al.
receive economic incentives such as free entrée coupons may write a positive review regardless of their actual dining experience. Tercia and Teichert (2016) find that German consumers view such incentives unfavourably but Indonesian consumers have a positive opinion of them. Consumers who desire social benefits from posting restaurant reviews online consider their dining experience as a communication tool that involves a virtual society; hence, the motivation might not necessarily be triggered by the consumer’s actual dining experience.
Motivations for writing online restaurant reviews can also be affected by the characteristics of the experience. It is logical that consumers’ positive or pleasant restaurant experiences may trigger positive, rather than negative eWOM. Restaurant consumers who had an unpleasant dining experience would be unlikely to conduct positive eWOM. Consequently, positive eWOM could play an important role in increasing consumers’ purchase intentions, creating a favourable image of the company and its brand value, and reducing promotional expenditures.
Previous studies reveal three positive eWOM dimensions that may be triggered by a positive restaurant experiences. These are concern for other consumers, desire to express positive feelings, and helping the company. Concern for others, according to Hennig-Thurau et al. (2004), is closely related to the concept of altruism. Preventing others from purchasing a bad product or service would be altruistic. ‘Concern for others’
is a very important factor in the restaurant industry because the intangibility of restaurant products leads consumers to rely on eWOM. In eWOM communication among restaurant consumers, consumers may initiate eWOM because of their genuine desire to help other restaurant consumers by sharing positive consumer experiences (Engel et al., 1969).
Expressing positive feelings is triggered by a positive consumption experience (Sundaram et al., 1998). The consumer’s positive restaurant experience contributes to a psychological tension inside the consumers itself because they have a strong desire to share the joy of the experience with other people. This tension can be released by articulating a positive dining experience online (Dichter, 1966; Hennig-Thurau et al., 2004).
Helping the company is similar to the concern for others factor eWOM: altruism or a genuine desire to help others. The only difference between helping the company and concern for others is whom being helped. Restaurant consumers may be motivated to engage in eWOM to “give the company something in return” for their positive dining experience (Hennig-Thurau et al., 2004).
2.2 Electronic word of mouth (eWOM)
The definition of eWOM comes from the definition of WOM as a traditional term. Arndt (1967) defines WOM as face-to-face communication about products or companies between people who were not commercial entities.
eWOM has emerged as a result of the development of internet technologies.
Litvin et al. (2008) defines eWOM from the traditional concept of WOM as: “all informal communications directed at consumers through internet-based technology related to the usage or characteristics of particular goods and services”. Hennig-Thurau et al. (2004) define eWOM as “any positive or negative statement made by potential, actual, or former customers about a product or company which is made available to the multitude of the people and institutes via the internet”. The difference between WOM and eWOM is the media used. WOM is typically face-to-face and eWOM is online.
Impact of electronic word-of-mouth communication 531 eWOM means that it can reach millions of people, will exist for a long period of time and can be found by virtually anyone interested in the particular products, services or companies. Furthermore, because the distinctive characteristics of eWOM allow web users to develop virtual relationships and communities, united groupings of critics are able to exert power over a company. On the other hand, if the eWOM information is posted anonymously online, traditional WOM communication becomes more credible.
2.3 Consumers’ restaurant experience (CREp)
Jeong and Jang (2011) state that experience is a general concept, including knowledge of our observation of objects or events through involvement in or exposure to them.
Similarly, consumers’ restaurant experiences are comprised of the knowledge or observation of restaurant attributes gained through the course of a dining experience.
Consumers’ positive and negative restaurant experiences are designated by their subjective judgement of the current experience and previous experiences.
Previous research has revealed three commonly accepted categories for measuring consumers’ restaurant experience: food quality, service quality, and atmosphere (Ha and Jang, 2010; Jang and Namkung, 2009). Food quality is a major factor in customer satisfaction and post-dining behavioural intentions, such as WOM or eWOM (Liu and Jang, 2009; Namkung and Jang, 2007; Pettijohn et al., 1997; Qu, 1997; Qin and Prybutok, 2008).
Researchers measure food quality by the attributes of the food. Qin and Prybutok (2008) use cleanliness, healthy options, freshness and variety as measures of food quality in fast-food restaurants. Kim et al. (2009) measure food quality by freshness, taste, and presentation. Namkung and Jang (2007) measure food quality using presentation, menu variety, healthy options, taste, freshness, and temperature as attributes. The study finds that presentation, taste, and temperature are significantly related to customer satisfaction. In a study on Chinese restaurants, Liu and Jang (2009) reach similar conclusions.
The impact of restaurant service quality on customer satisfaction and behavioural intentions such eWOM has been demonstrated by several studies (Kim et al., 2009;
Ladhari et al., 2008; Liu and Jang, 2009; Yuksel and Yuksel, 2003). To measure perceived service quality, Parasuraman et al. (1988) develop the SERVQUAL model.
Based on SERVQUAL, the DINESERV technique was developed to measure perceived service quality in restaurants (Stevens et al., 1995). DINESERV consists of five dimensions–reliability, assurance, responsiveness, tangibles, and empathy as measured by 29 items. Relying on the DINSERV model, Ladhari et al. (2008) find that perceived service quality affects customers’ satisfaction in terms of both positive and negative emotions and also influences their post-dining behaviours, such as eWOM. Liu and Jang (2009) employs the DINSERV items to measure restaurant service quality and finds that the service attributes for dependent and consistent service and friendly and helpful employees are significantly related to customer satisfaction.
The atmosphere has also been shown to be a powerful factor in customer satisfaction and trigger eWOM. Atmosphere generates an image of the surrounding space in customers’ minds, and the customers’ perceived value of the space modifies their affective state (Kotler, 1973). This impact may change or influence the consumer’s buying behaviour.
532 M.S. Mahrinasari et al.
Liu and Jang (2009) find that perceived fairness of price is positively related to customer satisfaction and loyalty, whereas perceived unfairness of price may lead to negative behavioural responses, including dissatisfaction and negative eWOM.
Kim et al. (2009) reveal the importance of price factors in a study of a university dining facility.
2.4 Country of origin (COO)
Johansson et al. (1985) and Ozsomer et al. (1991) define COO as the country where the corporate headquarters of the company marketing the product or brand is located.
Country of origin is inherent in certain brands. IBM and Sony, for example, imply US and Japanese origins, respectively.
A host of studies (Samiee, 1994; Bilkey and Nes, 1982; Cattin et al., 1982; Han and Terpstra, 1988; Lee and Schaninger, 1996; Papadopoulos, 1993; and White, 1979) define the product’s COO as “the country of manufacture or assembly”. Samiee (1994) states that “country of manufacture pertains to firms that maintain a relatively large global network of operations or do business with a variety of suppliers, e.g., contract manufacturing”. Bannister and Saunders (1978), Chasin and Jaffe (1979) and Nagashima (1970, 1977) use the term “made in——” to define the COO of the product.
Schooler (1965) suggests that the COO of a product can have an effect on a consumer’s opinion of the product. Koubaa (2008) finds that COO affects brand perception in Japanese consumers in the electronics market. Reierson (1966) finds that American students stereotyped foreign products. Reierson (1967) concludes that if the
“prejudice of consumers toward a nation’s product is not too intense, consumers’ attitude may be made significantly more favourable by even slight exposure to communication and promotional devices”. Thanasuta et al. (2009) find that Thai consumers are willing to pay a premium for German cars.
2.5 Brand equity
Keller (1998) defines brand equity as the value added to a brand or endowed to a product that is created in the minds of consumers in response to past investments in the marketing of the brand. Customer-based brand equity is generated when the customer is aware of a brand, perceives the overall quality of that brand to be superior to alternative products, and associates favourable attributes with the brand (Aaker, 1991). Aaker (1991) states that brand equity arises from customer brand-name awareness, loyalty, perceived quality and favourable brand symbolisms. The study indicates brand equity provides a competitive advantage which leads to greater future profitability. The equity that a strong brand possesses can give a company a loyal consumer base that brings substantial returns to the firm.
Kim (1990) suggests a brand is the totality of thoughts, feelings, sensations and associations it evokes. A brand is said to have equity if it has the ability to influence the behaviour of those who behold it and positively affect purchase behaviour.
Brand equity has four dimensions – brand awareness, associations, perceived quality, and loyalty. Past research has shown that brand awareness is a dominant factor in consumer choice (e.g., Cobb-Walgren et al., 1995; D’Souza and Rao, 1995; Reynolds and Olson, 1995). A higher the level of awareness in a brand is likely to increase the probability of the brand being considered in purchase decisions. Raising the level of
Impact of electronic word-of-mouth communication 533 awareness increases the likelihood that the brand will be in the consideration set (Nedungadi, 1990).
2.6 Hypotheses
2.6.1 The effect of consumers’ restaurant experience on eWOM
Consumption experiences are powerful sources of human motivation (Westbrook, 1987) that determine the nature of post-consumption behaviours, such as eWOM communication. Sundaram et al. (1998) state “it is reasonable to consider that consumption experience and motivation are closely related in the process of WOM transmission”. We assume that motivations for eWOM are similar to those found for WOM due to their conceptual closeness.
Expressing positive feelings is triggered by a positive consumption experience (Sundaram et al., 1998). The consumer’s positive restaurant experience contributes to a psychological tension because they have a desire to share the joy of the experience with other people. This tension can be released by articulating a positive dining experience online (Dichter, 1966; Hennig-Thurau et al., 2004).
Our first hypothesis is as follows:
H1: Positive consumer restaurant experience has a positive effect on generating eWOM.
2.6.2 The effect of eWOM on brand equity
Many researchers have focused extensively on the role of WOM in marketing topics, such as WOM as an important factor in consumer information searching, evaluation, and buying processes (Webster, 1991); WOM influences consumer attitudes toward a firm/product (Xia and Bechwati, 2008; Soderlund and Rosengren, 2007; Sen and Lerman, 2007; Kiecker and Cowles, 2001; Herr et al., 1991); WOM could persuade consumers to switch brands (Herr et al., 1991); and WOM influences expectations and perceptions during the information search phase and influences behaviour during the evaluation and pre-selection of various service providers (Woodside and Trappey, 1992). However, to date, research on the role of WOM or eWOM on brand equity is limited (Murtiasih et al., 2013). eWOM has the potential to drive brand equity. Past research (Danaher and Rust, 1996; Fullerton and Taylor, 2002; Sweeney and Soutar, 2001) shows that perceived service quality and perceived service value are positively related to WOM or eWOM transmission. Gil-Or (2010) shows that WOM can affect the formation of brand equity;
Macdonald and Sharp (2000) considers the influence of WOM on Brand Association, which is one dimension of brand equity (Murtiasih et al., 2013).
This leads to our second hypothesis:
H2: Positive eWOM has a positive effect on brand equity
2.6.3 The effect of COO on eWOM and brand equity
Consumers are known to develop stereotypical beliefs about products from particular countries. This COO image has the power to influence consumers’ beliefs about product attributes based on which country they originate (Srikatanyoo and Gnoth, 2002). The COO image is defined in some studies as consumers’ general perceptions about the
534 M.S. Mahrinasari et al.
quality of products made in a particular country (Han and Terpstra, 1988; Parameswaran and Yaprak, 1987). In other studies, it is viewed as the “defined beliefs about a country’s industrialisation and national quality standard” (Srikatanyoo and Gnoth, 2002).
The COO of a product may become a factor for an individual in referring products or services (WOM). When a consumer is planning to buy a car, for example, relatives or friends may refer to certain brands because of their perceived quality of goods from that brand’s COO.
Previous research suggests a product’s COO is an important factor in consumer decision-making (Khachaturian and Morganosky, 1990; Knight, 1999; Piron, 2000). It acts as a salient attribute in consumer product evaluation (Johansson, 1989), stimulates consumers’ interest in the product (Hong and Wyer, 1989), affects behavioural intentions through social norms (Fishbein and Ajzen, 1975) and influences buyer behaviour through effective processes as in the case of consumers’ patriotic feelings about their own country (Han and Terpstra, 1988). Therefore, COO can influence preference, purchase intention of a particular brand and have a positive effect on the brand’s equity.
Because of these effects we propose these three hypotheses:
H3: COO has a positive effect on eWOM.
H4: COO has a direct positive effect on brand equity
H5: COO has an indirect positive effect on brand equity through its effect on eWOM.
3 Methodology
3.1 Measurement
We develop a survey questionnaire that is based on questionnaires used in previous studies and administer it to 360 diners in either electronic or print format and get 323 useful responses. The questionnaire consists of three parts. The first section asks for general information about the respondent to be used for screening. The second section has statements regarding eWOM, COO and brand equity with which the respondents can agree or disagree on a one to seven scale. The third section has questions regarding the demographics of the respondent. The first section contains questions about respondents’
internet usage, including familiarity and frequency. It also has questions about whether the respondent had dined at any restaurants within the last 6 months and expressed their restaurant experience online. Respondents are also asked to recall their experience at a particular restaurant that they have dined at and have expressed eWOM about and to rate their level of agreement with each statement.
We use the methodology of previous studies (Jang and Namkung, 2009; Namkung and Jang, 2007; Stevens et al., 1995; Jeong and Jang, 2011), to determine a numerical representation of each respondents’ overall dining experience. This taxonomy uses nine statements regarding a dining experience including food quality, service quality and atmosphere attributes. Respondents are asked to state their agreement with each statement on a seven-point Likert scale where the response one represents “very strongly disagree”
and seven is for “very strongly agree”. Respondents were asked to rate their level of agreement on the importance of articulating positive eWOM regarding their restaurant experience. The eWOM section of the survey has two items for each of the three motives
Impact of electronic word-of-mouth communication 535 found to trigger positive eWOM in previous studies (Hennig-Thurau et al., 2004; Jeong and Jang, 2011).
The measurement of brand equity applies the methodology developed in Yoo and Donthu (2001) and used in Chang and Liu (2009) and Lai et al. (2010). The methodology uses three questions in four dimensions of brand equity. The four dimensions are brand awareness, brand association, brand perceived quality and brand loyalty.
We base the statements about COO on Wang and Yang (2008) and Mutiasih et al.
(2014). The survey includes statements regarding the respondents’ perception of the technology, innovation, prestige and quality of goods and services of the COO of the restaurant.
The last section of the questionnaire gathered respondents’ demographic information.
The section includes questions about each respondent’s age, gender, education, occupation, and household income. We collected data from respondents in diverse locations. We devised two levels of COO of the respondents, Indonesian and foreign.
There are 323 responses that fulfil the requirements of the sample out of the 360 surveys distributed.
We analyse the data using SAS Studio University Edition. We compile composite CREp, eWOM, COO and brand equity scores by taking the mean of the scores of the individual statements for each respondent. We do Tobit analysis with the dependent variable censored at lower and upper bounds of one and seven respectively to determine if the variables have the hypothesised explanatory power.
4 Results
4.1 Survey responses
The responses to the survey are summarised in Table 1. The questions for each section are listed below the table for that section. Table 1(a) summarises the responses to questions relating the CREp, Table 1(b) has the eWOM data, Table 1(c) is for the COO data and Table 1(d) has the information for brand equity.
In Table 1(a), we see that very few respondents strongly disagreed or disagreed with any of the statements and most respondents agreed or strongly agreed with the statements. This observation indicates that respondent was overall satisfied with their dining experience. This pattern of general agreement is also evident in Table 1(b)–(d), which is about eWOM, COO and brand equity.
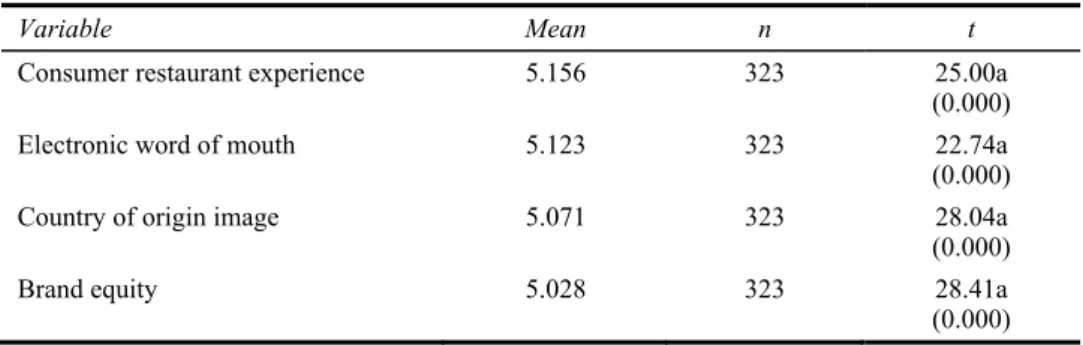
4.2 Univariate statistics
Table 2 shows the univariate statistics for the survey response composite scores. The mean for each composite score is listed along with statistics regarding a test of significance of the mean’s difference from four. We test for significance of difference from four because that is the number that corresponds to ‘neutral’. A mean significantly higher than four indicates general overall agreement with the underlying statements and one significantly less than four indicates general disagreement with the underlying statements.
All composite scores had a mean significantly greater than four at the 1% level.
This indicates that the diners had an overall good restaurant experience and had a positive
536 M.S. Mahrinasari et al.
image of the COO and brand equity. This is to be expected because of self-selection bias of the individual consumers. Diners are more likely to actually go to a restaurant in which they have an a priori positive brand and COO image and thus be more likely to have a good experience. The results on the eWOM composite indicate that the respondents have a general affinity to help other consumers and the restaurants where they had a good experience.
4.3 CREp and eWOM
Table 3 shows the results of the Tobit regressions testing the five individual hypotheses proposed. A Tobit model is chosen due to the categorical, bounded nature of the variables that would cause inconsistency in regression coefficients in an ordinary least squares model. The Tobit regressions are run using the QLIM procedure in SAS Studio University Edition with the dependent variable in each regression censored at a lower bound and upper bound of one and seven respectively.
Table 1(a) The distribution of responses to the indicated questions of the 323 people who responded to the questionnaire regarding their Customer Restaurant Experience (CREp). Survey respondents rated their agreement with each statement on a scale of 1 to 7 with 1 being “very strongly disagree” and 5 being “very strongly agree”.
Questions are listed below the table
Question number
Percent of diners who responded Very
strongly disagree (%)
Strongly disagree
(%) Disagree
(%) Neutral
(%) Agree (%)
Strongly agree
(%)
Very strongly
agree (%)
1 0.93 0.93 1.55 17.34 43.03 22.29 13.93
2 0.93 1.55 0.93 16.10 38.08 33.44 8.98
3 0.62 1.55 3.10 20.43 43.65 24.46 6.19
4 1.24 0.00 1.86 20.74 43.65 24.15 8.36
5 1.24 0.31 5.57 26.32 37.15 23.53 5.88
6 0.93 0.31 3.72 18.27 40.87 26.63 9.29
7 0.31 0.93 1.55 19.81 38.39 27.55 11.46
8 0.31 1.24 3.72 19.50 39.63 21.98 13.62
9 0.00 0.62 3.72 16.41 34.06 34.37 10.84
Questions:
1. The restaurant served tasty food
2. The food presentation was visually attractive 3. The food was served at the appropriate temperature 4. The restaurant servers provided attentive services 5. The restaurant is dependable and consistent 6. The restaurant had friendly and helpful employees 7. The restaurant employees were neat and well dressed 8. The restaurant dining areas were thoroughly clean
9. The interior design of the restaurant was visually appealing.
Impact of electronic word-of-mouth communication 537 Table 1(b) The distribution of responses to the indicated questions of the 323 people who
responded to the questionnaire regarding Electronic Word of Mouth (eWOM). Survey respondents rated their agreement with each statement on a scale of 1 to 7 with 1 being “very strongly disagree” and 5 being “very strongly agree”. Questions are listed below the table
Question number
Percent of diners who responded Very
strongly disagree (%)
Strongly disagree
(%) Disagree
(%) Neutral
(%) Agree (%)
Strongly agree
(%)
Very strongly agree (%)
1 2.17 0.62 4.02 21.36 41.18 25.39 5.26
2 1.24 1.55 1.86 21.98 38.08 27.86 7.43
3 0.62 0.93 1.55 20.12 46.13 22.91 7.74
4 0.00 1.86 2.79 19.50 40.87 25.39 9.60
5 1.24 0.93 2.48 19.20 38.39 30.03 7.74
6 1.24 0.93 2.17 12.69 37.77 32.82 12.38
1. I want to help others with my own positive restaurant experience 2. I want to give others the opportunity to have a good restaurant experience 3. This way I can express my joy about a good restaurant experience 4. I feel good when I can tell others about my great restaurant experience
5. I am so satisfied with the restaurant experience that I want to help the restaurant to be successful
6. In my opinion, good restaurants should be supported.
Table 1(c) The distribution of responses to the indicated questions of the 323 people who responded to the questionnaire regarding Electronic Word of Mouth (eWOM). Survey respondents rated their agreement with each statement on a scale of 1 to 7 with 1 being “very strongly disagree” and 5 being “very strongly agree”. Questions are listed below the table
Question number
Percent of diners who responded Very
strongly disagree (%)
Strongly disagree
(%) Disagree
(%) Neutral
(%) Agree (%)
Strongly agree
(%)
Very strongly agree (%)
1 0.31 1.55 5.57 21.05 42.72 19.20 9.60
2 0.31 0.62 3.41 20.12 44.89 20.43 10.22
3 0.00 0.31 3.72 15.48 46.13 25.39 8.98
4 0.00 0.93 3.41 15.79 45.82 25.70 8.36
5 0.93 0.93 6.50 20.74 46.75 20.12 4.02
1. I visit and use Foreign Restaurant because origin country providing foreign restaurant is innovative
2. I visit and use Foreign Restaurant because origin country providing foreign restaurant has high technology
3. I visit and use Foreign Restaurant because Foreign Restaurant’s interior design is interesting
4. I visit and use Foreign Restaurant because origin country providing foreign restaurant offer and maintain high-quality level
5. I visit and use Foreign Restaurant because origin country providing foreign restaurant has a prestige as a developed country.
538 M.S. Mahrinasari et al.
Table 1(d) The distribution of responses to the indicated questions of the 323 people who responded to the questionnaire regarding Electronic Word of Mouth (eWOM). Survey respondents rated their agreement with each statement on a scale of 1 to 7 with 1 being “very strongly disagree” and 5 being “very strongly agree”. Questions are listed below the table
Question number
Percent of diners who responded Very
strongly disagree (%)
Strongly disagree
(%) Disagree
(%) Neutral
(%) Agree (%)
Strongly agree
(%)
Very strongly
agree (%)
1 0.00 0.00 1.24 12.69 42.72 37.15 6.19
2 0.00 0.31 0.93 10.53 49.23 30.96 8.05
3 0.31 0.62 2.17 11.15 42.41 33.13 10.22
4 0.00 0.93 2.48 14.24 39.94 30.65 11.76
5 1.55 15.48 40.25 17.34 16.41 6.81 2.17
6 0.62 0.62 1.55 19.50 38.70 31.89 7.12
7 0.62 0.00 3.10 29.63 39.01 27.86 2.79
8 0.62 0.62 3.41 23.53 35.60 32.51 3.72
9 0.62 0.62 4.64 19.81 38.70 30.96 4.64
10 0.00 2.17 4.95 19.81 38.39 27.24 7.43
11 0.00 1.24 4.66 23.91 43.48 17.70 9.01
12 0.93 0.31 6.50 26.01 35.91 22.29 8.05
1. I can recognise this brand of the Restaurant’s products or services among competitive brands
2. I am aware of brand of the Restaurant’s products or services
3. Brand of the Restaurant’s products or services is a comparatively recallable brand to me
4. I can quickly recall the symbol or logo of the Restaurant company
5. I have difficulty in imagining the brand of the Restaurant’s products or services in my mind
6. The brand of the Restaurant’s products or services is of high quality
7. The probability that the brand of the Restaurant’s products or services would work well is very high
8. The likely quality of the brand of the Restaurant’s products or services is extremely high
9. The brand of the Restaurant’s products or services appears to be in very good quality 10. I consider myself to be loyal to the brand of the Restaurant’s products or services 11. The brand of the Restaurant’s products or services would be my first choice at all 12. I will recommend the brand of the Restaurant’s products or services to others.
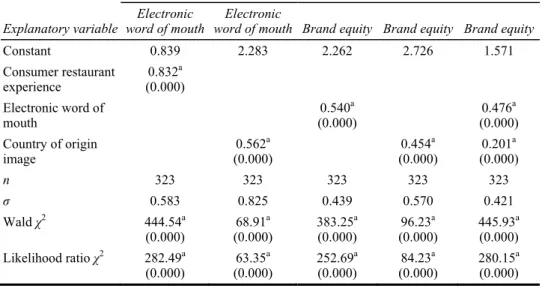
Table 3 shows the variable coefficient(s), constant, number of observations n, standard error of the regression σ, and statistics testing the significance of the coefficients and the model. The table has one column for each of the five regressions with the dependent variable listed at the top of each column. Regressor variables are listed in the table rows and a coefficient value is placed in the column of that row for the regressions that include that variable. p-values are in parentheses below each coefficient estimate and significance
Impact of electronic word-of-mouth communication 539 at the one, five or 10% level is indicated by a superscript of a, b or c to the right of the coefficient estimate.
The first regression was of eWOM on CREp. The coefficient is positive and significant at the 1% level. The model is significant at the 1% level under both the Wald and Likelihood Ratio test. These results indicate that CREp has a positive impact on eWOM.
Table 2 Univariate statistics
Variable Mean n t
Consumer restaurant experience 5.156 323 25.00a (0.000)
Electronic word of mouth 5.123 323 22.74a
(0.000)
Country of origin image 5.071 323 28.04a
(0.000)
Brand equity 5.028 323 28.41a
(0.000) Table shows mean response and significance of the difference between the means and 4 (neutral). Survey respondents rated their agreement with each statement on a scale of 1 to 7 with 1 being “Strongly disagree” and 7 being “Strongly agree”. t value is for a test of significant difference from 4 with p-values are in parentheses. n is the number of observations. a, b and c denote significance at the 1, 5 and 10% levels, respectively.
Table 3 Tobit regressions
Explanatory variable
Dependent variable Electronic
word of mouth Electronic
word of mouth Brand equity Brand equity Brand equity
Constant 0.839 2.283 2.262 2.726 1.571
Consumer restaurant
experience 0.832a (0.000) Electronic word of
mouth 0.540a
(0.000) 0.476a
(0.000) Country of origin
image 0.562a
(0.000) 0.454a
(0.000) 0.201a (0.000)
n 323 323 323 323 323
σ 0.583 0.825 0.439 0.570 0.421
Wald χ2 444.54a
(0.000) 68.91a
(0.000) 383.25a
(0.000) 96.23a
(0.000) 445.93a (0.000) Likelihood ratio χ2 282.49a
(0.000) 63.35a
(0.000) 252.69a
(0.000) 84.23a
(0.000) 280.15a (0.000) The table shows Tobit regressions of the different dependent variables on the explanatory variables. Dependent variables were censored at a lower and upper bound of one and seven respectively in each case. The results are the coefficients on the regressor variables.
n is the number of observations, σ is the standard error of the regression and the Wald and Likelihood Ratio χ2’s are test statistics of model significance. p-values are in parentheses below each coefficient. a, b and c indicate significance at the 1%, 5% and 10% levels, respectively.
540 M.S. Mahrinasari et al.
4.4 COO and eWOM
The second regression shows the impact of COO on eWOM. The coefficient on COO is positive and significant at the 1% level. The model is also significant at the 1% level.
These results support the hypothesis that COO has a positive effect on eWOM.
4.5 eWOM, COO and brand equity
We run three regressions with brand equity as the dependent variable to find the totality of the effect of the dependent variables. We run a Tobit model of brand equity on eWOM alone, on COO alone and on both eWOM and COO with the dependent variable censored at a lower and upper bound of one and seven in each. The first regression tells us if eWOM has an effect on brand equity, the second one tells us if COO has an effect on brand equity either directly or indirectly through eWOM or both. The third regression clarifies the situation of the effect of COO on eWOM.
In the first regression, the coefficient on eWOM is positive and significant at the 1%
level and the model is significant at the 1% level. This result indicates that eWOM affects brand equity in a positive way. The significantly positive coefficient on COO and the significant model shows that COO positively affects brand equity either directly or indirectly.
When we run the model on both eWOM and COO we see that the model is significant and the coefficients on both eWOM and COO are significantly positive at the 1% level.
This result indicates COO affects brand equity directly as well as any indirect effect it may have through its effect on eWOM.
5 Discussion, conclusions and managerial implications
eWOM communication has been increasingly common recently as more consumers are using internet technologies to gather pre-purchase information. If consumers are satisfied or disappointed with the services or products they purchase, they can immediately spread that information on social media sites such as Twitter or Facebook and potentially affect the purchase decisions of other members of the social media site in which they post.
Previous research has found that negative online product reviews can have a detrimental effect on consumer-based brand.
This study finds that consumers’ restaurant experience (CREp) has a positive effect on triggering eWOM communication in a study of 323 Indonesian diners. It also finds that eWOM has a positive effect on brand equity. These results indicate that a positive eWOM can increase profitability for firms by improving the firm’s image through eWOM. This improved image can potentially increase cash inflows by encouraging more people to purchase the firm’s products or services. It can also possibly reduce the cash outflows of the firm by reducing the need for expenditures on marketing.
The study finds the COO image affects eWOM as well as brand equity directly and indirectly through its effect on eWOM. This result indicates that firms can potentially increase their brand equity by emphasising their COO if they are from a country that has positive COO and de-emphasising their COO if they are from a country with a poor COO.
Impact of electronic word-of-mouth communication 541 These results lead to several important managerial implications that are left to future research. The first implication is what are the determinants of eWOM and how can management teams influence customers to give positive eWOM. A second implication is what the optimal level of expenditure is on customer restaurant experience to maximise long-term profitability. A better CREp has been shown to improve brand equity and thus potentially improve net cash flows, but it has not been determined how much expenditure is needed to improve CREp.
References
Aaker, D.A. (1991) Managing Brand Equity: Capitalizing on the Value of a Brand Name, Free Press, New York.
Adjei, M.T., Noble, S.M. and Noble, C.H. (2009) ‘The influence of C2C communications in online brand communities on customer purchase behavior’, Journal of the Academy of Marketing Science, Vol. 38, No. 5, pp.634–653.
Alexandris, K., Jame, J. and Kand, G.D. (2002) ‘Measurement of internal service quality:
application of the SERVQUAL battery to internal service quality’, Managing Service Quality:
An International Journal, Vol. 12, No. 5, pp.278–291.
Arndt, J.A. (1967) ‘Role of product-related conversations in the diffusion of a new product’, Journal of Marketing Research, Vol. 4, pp.291–295.
Bannister and Saunders (1978) ‘UK consumers’ attitudes towards imports: the measurement of national stereotype image’, European Journal of Marketing, Vol. 12, No. 9, pp.562–570.
Bilkey, W.J. and Nes, E. (1982) ‘Country-of-origin effects on product evaluations’, Journal of International Business Studies, Vol. 8, Spring, pp.89–99.
Cattin, P., Jolibert, A. and Lohnes, C. (1982) ‘A cross-cultural study of ‘made in concepts’ ’, Journal of International Business Studies, Vol. 13, No. 3, pp.131–141.
Chang, H.H. and Liu, Y.M. (2009) ‘The impact of brand equity on brand preference and purchase intentions in the service industries’, The Service Industries Journal, Vol. 29, No. 12, pp.1687–1706.
Chasin, J.B. and Jaffe, E.D. (1979) ‘Industrial buyer attitudes towards goods made in eastern Europe’, Columbia Journal of World Business, Vol. 15, No. 2, pp.74–81.
Chatterjee, P. (2001) ‘Online reviews: do consumers use them?’, in Gilly, M.C. and Myers-Levy, J. (Eds.): Association for Consumer Research Proceedings. ACR 2001 Proceedings, pp.129–134.
Cobb-Walgren, C.J., Ruble, C.A. and Donthu, N. (1995) ‘Brand equity, brand preference, and purchase intent’, Journal of Advertising, Vol. 24, No. 3, pp.25–40.
D’Souza, G. and Rao, R.C. (1995) ‘Can repeating an advertisement more frequently than the competition affect brand preference in a mature market?’, Journal of Marketing, Vol. 59, No. 2, pp.32–42.
Danaher, P.J. and Rust, R.T. (1996) ‘Indirect financial benefits from service quality’, Quality Management Journal, Vol. 3, No. 2, pp.63–85.
Dichter, E., (1966) ‘How word-of-mouth advertising works’, Harvard Business Review, Vol. 44, No. 6, pp.147–160.
Engel, J.E., Blackwell, R.D. and Kegerreis, R.J. (1969) ‘How information is used to adopt an innovation’, Journal of Advertising Research, Vol. 9, No. 4, pp.3–8.
Fishbein, M. and Ajzen, I. (1975) Belief, Attitude, Intention and Behavior: An Introduction to Theory and Research, Addison-Wesley, Reading, MA.
Fullerton, G. and Taylor, S. (2002) ‘Mediating, interactive, and non-linear effects in service quality and satisfaction with services research’, Canadian Journal of Administrative Sciences, Vol. 19, No. 2, pp.124–136.
542 M.S. Mahrinasari et al.
Gil-Or, O. (2010) ‘The potential of Facebook in creating commercial value for service companies’, Advances in Management, Vol. 3, No. 2, pp.20–25.
Ha, J. and Jang, S.C. (2010) ‘Effects of service quality and food quality: the moderating role of atmospherics in an ethnic restaurant segment’, International Journal of Hospitality Management, Vol. 29, No. 3, pp.520–529.
Han, C.M. and Terpstra, V. (1988) ‘Country-of-origin effects for uni-national and bi-national products’, Journal of International Business Studies, Vol. 19, No. 2, pp.235–255.
Harrison-Walker, L.J. (2001) ‘The measurement of word-of mouth communication and investigation of service quality and customer commitment as potential antecedents’, Journal of Service Research, Vol. 4, pp.60–75.
Hawkins, D.I., Best, R.J. and Coney, K.A. (2004) Consumer Behavior: Building Marketing Strategy, McGraw Hill-Irwin, Boston, MA.
Hennig-Thurau, T., Gwinner, K.P., Walsh, G. and Gremler, D.D. (2004) ‘Electronic word-of- mouth via consumer-opinion platforms: what motivates consumers to articulate themselves on the internet?’, Journal of Interactive Marketing, Vol. 18, No. 1, pp.38–52.
Herr, P.M., Krades, F.R. and Kim, J. (1991) ‘Effects of word-of-mouth and product-attribute information on persuasion: an accessibility-diagnosticity perspective’, Journal of Consumer Research, Vol. 17, No. 4, pp.454–462.
Hong, S.T. and Wyer, R.S. (1989) ‘Effects of country-of-origin and product-attribute information on product evaluation: an information processing perspective’, Journal of Consumer Research, Vol. 16, No. 2, pp.175–187.
Jang, S. and Namkung, Y. (2009) ‘Perceived quality, emotions, and behavioral intentions:
application of an extended Mehrabian–Russell model to restaurants’, Journal of Business Research, Vol. 62, No. 4, pp.451–460.
Jeong, S. and Jang, C. (2011) ‘Restaurant experiences triggering positive electronic word-of-mouth (eWOM) motivations international’, Journal of Hospitality Management, Vol. 30, pp.356–366.
Johansson, J.K. (1989) ‘Determinants and effects of the use of ‘made in labels’’, International Marketing Review, Vol. 6, No. 1, pp.47–58.
Johansson, J.K., Douglas, S.P. and Nonaka, I. (1985) ‘Assessing the impact of country of origin on product evaluations: a new methodological perspective’, Journal of Marketing Research, Vol. 22, November, pp.388–396.
Keller, K.L. (1998) Strategic Brand Management: Building, Measuring, and Managing Brand Equity, Prentice Hall, Upper Saddle River, NJ.
Khachaturian, J.L. and Morganosky, M.A. (1990) ‘Quality perceptions by country of origin’, International Journal of Retail and Distribution Management, Vol. 18, No. 5.
Kiecker, P. and Cowles, D. (2001) ‘Interpersonal communication and personal influence on the internet: a framework for examining online word-of-mouth’, Journal of Euromarketing, Vol. 11, No. 2, pp.71–88.
Kim, P. (1990) ‘A perspective on brands’, Journal of Consumer Marketing, Vol. 7, No. 4, pp.63–67.
Kim, W.G., Ng, C.Y.N. and Kim, Y.S. (2009) ‘Influence of institutional DINESERV on customer satisfaction, return intention, and word-of-mouth’, International Journal of Hospitality Management, Vol. 28, No. 1, pp.10–17.
Knight, G.A. (1999) ‘Consumer preferences for foreign and domestic products’, Journal of Consumer Marketing, Vol. 16, No. 2, pp.151–162.
Kotler, P. (1973) ‘Atmospherics as a marketing tool’, Journal of Retailing, Vol. 49, No. 4, pp.48–64.
Koubaa, Y. (2008) ‘Country of origin, brand image perception, and brand image structure’, Asia Pacific Journal of Marketing and Logistics, Vol. 20, No. 2, pp.139–155.
Impact of electronic word-of-mouth communication 543 Ladhari, R., Brun, I. and Morales, M. (2008) ‘Determinants of dining satisfaction and postdining
behavioral intentions’, International Journal of Hospitality Management, Vol. 27, No. 4, pp.563–573.
Lai, C.S., Chiu, C.J., Yang, C.F. and Pai, D. (2010) ‘The effects of corporate social responsibility on brand performance: the mediating effect of industrial brand equity and corporate reputation’, Journal of Business Ethics, Vol. 95, No. 3, pp.457–469.
Lee, D.H. and Schaninger, C.M. (1996) ‘Country of production/assembly as a new country image construct: a conceptual application to global transplant decisions’, in Cavusgil, S.T. (Ed.):
Advances in International Marketing, Vol. 7, pp.233–254.
Litvin, S.W., Goldsmith, R.E. and Pan, B. (2008) ‘Electronic word of mouth in hospitality and tourism management’, Tourism Management, Vol. 29, No. 3, pp.458–468.
Liu, Y. and Jang, S. (2009) ‘Perceptions of Chinese restaurants in the US: what affects customer satisfaction and behavioral intentions?’, International Journal of Hospitality Management, Vol. 28, No. 3, pp.338–348.
Macdonald, E.K. and Sharp, B.M. (2000) ‘Brand awareness effects on consumer decision making for a common, repeat purchase product: a replication’, Journal of Business Research, Vol. 48, No. 1, pp.5–15.
Mazzarol, T. and Sweeney, J. (2007) ‘Conceptualizing word-of-mouth activity, triggers and conditions: an exploratory study’, European Journal of Marketing, Vol. 41, No. 11, pp.1475–1494.
Murtiasih, S., Sucherly, S. and Siringoringo, H (2014) ‘Impact of country of origin and word of mouth on brand equity’, Marketing Intelligence and Planning, Vol. 32, No. 5, pp.616–629.
Murtiasih, S., Sucherly, S. and Siringoringo, H. (2013) ‘How word of mouth influence brand equity for automotive products in Indonesia’, Procedia–Social and Behavioral Sciences, Vol. 81, No. 28, pp.40–44.
Nagashima, A. (1970) ‘A comparison of U.S. and Japanese attitudes toward foreign products’, Journal of Marketing, Vol. 34, January, pp.68–74.
Nagashima, A. (1977) ‘A comparative ‘made in’ product image survey among Japanese businessmen’, Journal of Marketing, Vol. 41, No. 3, pp.95–100.
Namkung, Y. and Jang, S. (2007) ‘Does food quality really matter in restaurants? its impact on customer satisfaction and behavioral intentions’, Journal of Hospitality and Tourism Research, Vol. 31, No. 3, pp.387–409.
Nedungadi, P. (1990) ‘Recall and consumer consideration sets: influencing choice without altering brand evaluations’, Journal of Consumer Research, Vol. 17, No. 3, pp.263–276.
Ozsomer, A., Bodur, M. and Cavusgil, S.T. (1991) ‘Marketing standardisation by multinationals in an emerging market’, European Journal of Marketing, Vol. 25, No. 12, pp.50–64.
Papadopoulos, N. (1993) ‘What product and country images are and are not’, in Papadopoulos, N.
and Heslop, L.A. (Eds.): Product-Country Images: Impact and Role in International Marketing, International Business Press, New York, NY, pp.3–38.
Parameswaran, R. and Yaprak, A. (1987) ‘A cross-national comparison of consumer research measures’, Journal of International Business Studies, Vol. 18, No. 1, pp.35–49.
Parasuraman, A., Zeithaml, V.A. and Berry, L.L. (1988) ‘SERVQUAL: a multiple-item scale for measuring consumer perceptions of service quality’, Journal of Retailing, Vol. 64, No. 1, pp.12–40.
Pettijohn, L.S., Pettijohn, C.E. and Luke, R.H. (1997) ‘An evaluation of fast food restaurant satisfaction: determinants, competitive comparisons and impact on future patronage’, Journal of Restaurant and Food Services Marketing, Vol. 2, No. 3, pp.3–20.
Piron, F. (2000) ‘Consumers’ perceptions of the country-of-origin effect on purchasing intentions of (in) conspicuous products’, Journal of Consumer Marketing, Vol. 17, No. 4, pp.308–321.
544 M.S. Mahrinasari et al.
Qin, H. and Prybutok, V. (2008) ‘Determinants of customer-perceived service quality in fast-food restaurants and their relationship to customer satisfaction and behavioral intentions’, The Quality Management Journal., Vol. 15, No. 2, pp.35–50.
Qu, H. (1997) ‘Determinant factors and choice intention for Chinese restaurant dining: a multivariate approach’, Journal of Restaurant and Food Services Marketing, Vol. 2, No. 2, pp.35–49.
Reierson, C.C. (1966) ‘Are foreign products seen as national stereotypes-survey of attitudes in college students’, Journal of Retailing, Vol. 42, Fall, pp.33–40.
Reierson, C.C. (1967) ‘Attitude changes toward foreign products’, Journal of Marketing Research, Vol. 4, No. 4, pp.385–387.
Reynolds, T. and Olson, J. (1995) Identifying a Brand’s Key Equities, Report No. 95–111, Marketing Science Institute Working Paper Series, Marketing Science Institute, Cambridge, MA.
Samiee, S. (1994) ‘Customer evaluation of products in a global market’, Journal of International Business Studies, Vol. 25, No. 3, pp.579–604.
Schindler, R.E. and Bickart, B. (2005) Published Word of Mouth: Referable, Consumer-Generated Information on the Internet, Online Consumer Psychology, Understanding and Influencing Consumer Behavior in the Virtual World, Lawrence Erlbaum Associates, Mahwah, pp.32–57.
Schooler, R.D. (1965) ‘Product bias in the Central American common market’, Journal of Marketing Research, Vol. 2, No. 4, pp.394–397.
Sen, S. and Lerman, D. (2007) ‘Why are you telling me this? An examination into negative consumer reviews on the web’, Journal of Interactive Marketing, Vol. 21, No. 4, pp.76–94.
Soderlund, M. and Rosengren, S. (2007) ‘Receiving word-of-mouth from the service customer: an emotion-based effectiveness assessment’, Journal of Retailing and Consumer Services, Vol. 14, No. 2, pp.123–136.
Srikatanyoo, N. and Gnoth, J. (2002) ‘Country image and international tertiary education’, The Journal of Brand Management, Vol. 10, No. 2, pp.139–146.
Stevens, P., Knutson, B. and Patton, M. (1995) ‘DINESERV: a tool for measuring service quality in restaurants’, Cornell Hotel and Restaurant Administration Quarterly, Vol. 36, No. 2, pp.56–60.
Sundaram, D.S., Mitra, K. and Webster, C. (1998) ‘Word-of-mouth communications: a motivational analysis’, Advances in Consumer Research, Vol. 25, pp.527–531.
Sweeney, J.C. and Soutar, G.N. (2001) ‘Consumer perceived value: the development of a multiple item scale’, Journal of Retailing, Vol. 77, No. 2, pp.203–220.
Tercia, C. and Teichert, T. (2016) ‘Cultural context in word-of-mouth activity: how consumers respond to monetary incentives in WOM. Asia Pacific Journal of Marketing and Logistics, Vol. 28, No. 5, pp.827–840.
Thanasuta, K., Patoomsuwan, T. and Chaimahawong, C.Y. (2009) ‘Brand and country of origin valuations of automobiles’, Asia Pacific Journal of Marketing and Logistics, Vol. 21, No. 3, pp.355–375.
Wang, X. and Yang, Z. (2008) ‘Does country-of-origin matter in the relationship between brand personality and purchase intention in emerging economies? Evidence from China’s auto industry’, International Marketing Review, Vol. 25, No. 4, pp.458–474.
Webster, C. (1991) ‘Influences upon consumer expectations of services’, Journal of Services Marketing, Vol. 5, pp.516–33.
Westbrook, R.A. (1987) ‘Product/consumption-based affective responses and post purchase process’, Journal of Marketing Research, Vol. 24, No. 3, pp.258–270.
White, P.D. (1979) ‘Attitudes of U.S. purchasing managers toward industrial products manufactured in selected western European nations’, Journal of International Business Studies, Vol. 10, Spring/Summer, pp.81–90.
Impact of electronic word-of-mouth communication 545 Woodside, A.G. and Trappey, R.J. (1992) ‘Finding out why customers shop your store and buy
your brand: automatic cognitive processing models of primary choice’, Journal of Advertising Research, Vol. 32, No. 6, pp.59–77.
Xia, L. and Bechwati, N.N. (2008) ‘Word of mouse: the role of cognitive personalization in online consumer reviews’, Journal of Interactive Advertising, Vol. 9, No. 1, pp.3–13.
Yoo, B. and Donthu, N. (2001) ‘Developing and validating a multidimensional consumer-based brand equity scale’, Journal of Business Research, Vol. 52, No. 1, pp.1–14.
Yuksel, A. and Yuksel, F. (2003) ‘Measurement of tourist satisfaction with restaurant services: a segment-based approach’, Journal of Vacation Marketing, Vol. 9, No. 1, pp.52–68.
Zeithaml, V., Berry, L. and Parasuram, A. (1996) ‘The behavioral consequences of service quality’, Journal of Marketing, Vol. 60, No. 2, pp.31–46.
Zhang, R. and Tran, T.T. (2009) Helping E-Commerce Consumers Make Good Purchase Decisions: A User Reviews-Based Approach, E-Technologies: Innovation in an Open World, Ottawa, MCETECH, Springer, pp.23–37.
Zhu, F. and Zhang, X. (2010) ‘Impact of online consumer reviews on sales: the moderating role of product and consumer characteristics’, Journal of Marketing, Vol. 72, No. 2, pp.133–148.