Indianapolis–Marion County
Property Tax Abatements and the Local Economy
© 2001 Center for Urban Policy and the Environment (01-C17) 342 North Senate Avenue • Indianapolis, Indiana 46204-1708
Central Indiana’s Future:
Understanding the Region and Identifying Choices
Central Indiana’s Future: Understanding the Region and Identifying Choices, funded by an award of general support from the Lilly Endowment, is a research project that seeks to increase understanding of the region and to inform decision-makers about the array of options for improving the quality of life for Central Indiana residents. The Center for Urban Policy and the Environment faculty and staff, with other researchers from several universities, are working to understand how the broad range of investments made by households, governments, businesses, and nonprofit organizations within the Central Indiana region contribute to quality of life. The geographic scope of the project includes 44 counties in an integrated economic region identified by the U.S. Bureau of Economic Analysis.
The Center for Urban Policy and the Environment is part of the School of Public and Environmental Affairs at Indiana University–
Purdue University Indianapolis. For more information about the Central Indiana Project or the research reported here, contact the center at 317-261-3000 or visit the center’s Web site at www.urbancenter.iupui.edu.
Opinions expressed are solely those of the author and should not be attributed to the institution with which he is affiliated or the Center for Urban Policy and the Environment.
TABLE OF CONTENTS
ACKNOWLEDGEMENTS i
EXECUTIVE SUMMARY 1
INTRODUCTION 3
TAX INCENTIVES AFFECT THE LOCATION OF FIRMS 5
Tax Rate Differences Within Regions Have Greater Affect on Business Location 5 The Success of Tax Incentives as an Economic Development Tool May Depend on Local Characteristics 6
Why Do Governments Want to Influence Business Location? 8
PROPERTY TAX ABATEMENTS IN INDIANAPOLIS 9
Economic Impacts of Property Tax Abatements on Indianapolis 10
More Tax Abatements are Awarded in Center Township than in Other Townships 16
Tax Abatements Have Fiscal Impacts on School Districts 21
The Average Cost per Job Varies Widely Between Townships 23
The Quality of the Jobs Created is an Important Consideration 28
Indianapolis is Selective in Determining the Duration of a Tax Abatement Award 30
CONCLUSION 33
REFERENCES 35
APPENDIX: HOW IS THE WEIGHT APPLIED? 39
AUTHOR Yu-Che Chang Ph.D. Candidate Indiana University Bloomington
TABLE OF CONTENTS—TABLES AND FIGURES
TABLES
Table 1: Wage Rate Requirements for Property Tax Abatements in Indianapolis (as of November 1999) 9 Table 2: Economic Contributions from Firms Receiving Property Tax Abatements in Indianapolis
between 1994 and 1999 10
Table 3: Top 10 Investment Projects in the Contribution of New Jobs, 1993–2000 15
Table 4: Top 10 Investment Projects in the Contribution of Retained Jobs, 1993–2000 16
Table 5: Deduction from the Assessed Value of Personal Property by Township, 1982–98 ($000) 17 Table 6: Deduction from the Assessed Value of Real Property by Township, 1982–99 ($000) 18
Table 7: Use of Property Tax Abatements by Township, 1993–2000* 19
Table 8: Ratio of the Assessed Value of Personal Property Deducted to the Net Assessed Value of
Personal Property by Township, 1982–98 20
Table 9: Ratio of the Assessed Value of Real Property Deducted to the Net Assessed Value of
Real Property by Township, 1982–99 21
Table 10: Deduction from the Assessed Value of Personal Property by School District, 1992–98 ($000) 22 Table 11: Deduction from the Assessed Value of Real Property by School District, 1992–98 ($000) 22 Table 12: Ratio of the Assessed Value of Personal Property Deducted to the Assessed Value of
Personal Property by School District, 1992–98 23
Table 13: Ratio of the Assessed Value of Real Property Deducted to the Assessed Value of
Real Property by Township, 1992–98 23
Table 14: Total Tax Savings for Firms Awarded Property Tax Abatements, 1993–2000 24
Table 15: Cost per New Job, Weighted by the Number of New Jobs Created by Each Firm, 1993–2000 25 Table 16: Cost per New or Retained Job, Weighted by the Number of New and Retained Jobs by Each Firm , 1993–2000 25 Table 17: Cost per New Job When Discount Rate=0, Weighted by the Number of New Jobs Created by
Each Firm, by Township, 1993–2000 26
Table 18: Cost per New or Retained Job When Discount Rate=0, Weighted by the Number of
New and Retained Jobs by Each Firm, by Township, 1993–2000 26
Table 19: Cost per $1,000 Investment, Weighted by the Total Investment of Each Firm , 1993–2000 27 Table 20: Cost per $1,000 Investment When Discount Rate=0, Weighted by the Total Investment of
Each Firm, by Township, 1993–2000 27
Table 21: Cost Per Job Evaluation from Previous Research 28
Table 22: Mean of the Estimated Hourly Wage Rate for PTA-receiving Companies, Indianapolis, 1994–99
(Weighted by Number of Jobs) 28
Table 23: Mean of the Estimated Hourly Wage Rate for PTA-receiving Companies, by Township, 1994–99
(Weighted by Number of Jobs) 29
Table 24: Mean of the Estimated Hourly Wage Rate for New Jobs Generated by PTA-receiving Companies,
by Township, 1994–99 (Weighted by Number of New Jobs) 29
Table 25: Mean of the Estimated Hourly Wage Rate for Retained Jobs Kept by PTA-receiving Companies, by
Township, 1994–99 (Weighted by Number of New Jobs) 29
Table 26: Frequency Table for the Duration of Personal PTAs, 1993–2000 30
Table 27: Frequency Table for the Duration of Real PTAs, 1993–2000 30
Table 28: Frequency of Firms Receiving Different Years of Tax Abatements for Real Property, by Year, 1993–2000 31 Table 29: Frequency of Firms Receiving Different Years of Tax Abatements for
Personal Property, by Year, 1993–99 32
Table 30: Average Contributions of Firms to Local Economy, by Years of Real PTAs, 1993–2000 32 Table 31: Average Contributions of Firms to Local Economy, by Years of Personal PTAs, 1993–2000 32
FIGURES
Figure 1: Number of New Jobs Created by Each PTA-Recipient, 1993–2000 12
Figure 2: Number of Jobs Retained by Each PTA-Recipient, 1993–2000 12
Figure 3: Personal Property Investment by Each PTA-Recipient, 1993–2000 13
Figure 4: Real Property Investment by Each PTA-Recipient, 1993–2000 14
ACKNOWLEDGMENTS
The author would like to thank Ms. Kate Zoeller of the Indianapolis Department of Metropolitan Development for providing the dataset compiled from the applications of property tax abatements. In addition, Ms. Zoeller has kindly answered a number of questions through interviews and e-mails with regard to the administration and implementation of this program.
The author also appreciates the research contribution made by Mr. Drew Klacik of the Center for Urban Policy and the Environment regarding the handling of the local government dataset from the State Board of Tax Commissioners. Mr. Klacik has helped in solving several problems that have hindered the progress of this report.
Finally, the author would like to express special appreciation to his Dissertation Committee members—Dr. John Kirlin, Dr. Joyce Man, Dr. David Reingold, and Dr. Kurt Zorn—and Dr. Sam Nunn, for sharing their thoughts in the development of this study. Dr. Man and Dr. Nunn have both helped tremendously through constructive meeting sessions and comments on previous drafts of this report. Of course, any mistakes are my own responsibility.
—Yu-Che Chang
EXECUTIVE SUMMARY
Between 1994 and 1999, 198 investment projects were granted real or personal property tax abatements (PTAs) in Marion County.
The resulting expansions of firms or start-ups of new companies created 13,677 new jobs for the Indianapolis area and 52,558 jobs were retained. However, this retained jobs figure includes some double counting, as several companies counted the same positions in applying for multiple tax breaks in consecutive plant expansions.
Approximately $1.96 billion in personal property and $695 million in real property have been invested in Indianapolis by companies receiving abatements. Big companies have dominated these economic contributions. The top 10 investment projects provided 6,647 (48.6 percent) of the 13,667 new jobs. Similarly, the top 10 PTA applicants, out of a total of 198 (1994–99), accounted for the retention of 31,965 (60.8 percent) of the 52,558 employment positions saved. The average cost per new job is in the range of
$7,163 to $8,808.
On the whole, this program seems to have generated more positive economic stimulus in Center and other poor townships than in the wealthier ones. Center Township had 3,676 new jobs created and retained (as an upper limit) 20,411 existing jobs as a result of 88 approved PTA applicants since 1993. Big firms dominated these contributions (e.g., 8,700 of retained jobs were attributed to the 1999 Lilly expansion). In addition to Center Township, two other poor townships also were intensely assisted by PTAs. Warren Township generated 4,336 new jobs and retained 10,308 jobs from its 31 abatement recipients. Wayne Township was not far behind with 1,711 new jobs and 17,393 jobs retained.
Because poor townships have provided more property tax abatements, school districts in these economically deprived
neighborhoods usually lose more of their property tax revenues than those in wealthy areas. For example, the Indianapolis Public School District, most of it overlapping with Center Township, had a $149.7 million deduction in personal property and a $518.1 million deduction in real property from property tax rolls between 1992 and 1998. As local governments try to alleviate these negative fiscal impacts on school districts, discrepancies between different wealthier and poorer areas need to be taken into consideration.
INTRODUCTION
Indiana adopted legislation authorizing the use of property tax abatements (PTAs) by local jurisdictions in 1977. Since then, PTAs have become one of the few economy-stimulating mechanisms available to localities. Over the past two decades, a number of important revisions of this law have been passed, while jurisdictions in Indiana have continued using it to attract investment and boost the economy.
As the use of PTA programs continues to grow, the debate over their effectiveness, efficiency, and equality is increasing. Local economic development officials claim that tax abatements are responsible for attracting firms, creating jobs, and expanding the tax base, while others argue that the industries in question would choose to locate in the same sites without any abatements. Educators plead that school districts suffer from reduced property tax revenue without the opportunity to be heard in these abatement decisions.
Many economists argue that local tax incentives are a zero-sum game that helps nobody but the firms who try to maximize their
“corporate welfare.” However, many economists also acknowledge, somewhat ironically, that individual cities or counties probably would benefit by participating in this game once it gets started.
This report studies the operation of the PTA program and its various effects in the nine townships of Indianapolis–Marion County.1 Important local regulations regarding the implementation of PTAs are reviewed. The costs and economic benefits of PTAs are evaluated for the city as a whole as well as for individual townships. The impact of granting PTAs upon the financing of school districts is computed and taken into consideration. In addition to impacts concerning economic and equity, the administrative and implementation issues of this program also are examined. The factors that have determined the duration of PTAs awarded to each company are then examined.
The final section of the report offers conclusions about the PTA program.
1 Two sets of data are used in this analysis. First, the local government dataset compiled by the State Board of Tax Commissioners contains data on the total assessed value of property deducted each year for all tax jurisdictions in Indiana. This dataset is used to calculate the total deductions of PTAs for various jurisdictions.
The second dataset, obtained from the Indianapolis Department of Metropolitan Development, consists of records of individual firms that have been approved for some type of PTAs in Indianapolis between 1993 and 2000. It includes data on the size of investments, the number of jobs retained and created by each project, and the average hourly wages of those jobs, both estimated and actual. It also identifies whether or not the tax abatements of those firms have been terminated or whether they are under probation.
TAX INCENTIVES AFFECT THE LOCATION OF FIRMS
Traditionally, raw materials, markets, labor quality, and transportation costs have been identified as the most important factors in the locational choices of firms. However, because of technological improvements, the relative significance of proximity to raw materials and transportation costs has diminished. Most recent research has found that business climate, unionization, and personal reasons have become more important than they used to be.2 Research prior to the 1970s often reported that taxation was not an important consideration in location decisions. However, since the 1970s, more scholars have agreed that tax policy may have an influence on the choice of business location, especially with respect to intra-regional decisions.
One reason for this change in research findings is due to improvements in research methodology. Early statistical analysis used simple correlations alone without taking into consideration the effect of other variables. Survey studies, though commonly used, suffered from several critical methodological constraints.3 Scholars now generally agree that econometric analysis is the most appropriate method to estimate the economic effect of tax policies because of its capacity to isolate the effects of tax policy from those of other variables.
Tax Rate Differences Within Regions Have Greater Affect on Business Location
Since Tiebout’s monumental article four decades ago (Tiebout 1956), the relationship between tax burden and the movement of residents and capital has become one of the most important issues in public finance. In the Tiebout model, individuals move between communities based on their preferences for fiscal packages. Relatively high property or personal income taxes may reduce the supply of labor in a region and raise the wages that employers must pay to workers. High property taxes also increase the costs of structures and equipment. From the perspective of local economic development, the critical question is to what extent differences in local taxation influence business location decisions.
Most of the earlier empirical studies, such as those by John Due (1961), Dennis Carlton (1979), and Roger Schmenner (1982), found that difference in wages, energy costs, labor skills, and the amount of manufacturing already carried out (i.e., agglomeration economies) have influenced firms’ decisions to locate or expand in a given state. However, the level of state and local taxes was not found to have a very significant impact. The basic argument of these analyses was that tax savings were simply too small to have any substantial impact on the choice of firm and plant locations.
More recent studies, however, have found that sub-national government taxes do influence a business firm’s choice of locations among states and regions. Summarizing studies done between 1979 and 1991, Bartik (1991) argued that the long-run elasticity of business activity with respect to state and local taxes lay in the range of -0.1 to -0.6 for interregional business location decisions.
2 For a review of firm location literature, refer to Blair (1995) and Harrington and Warf (1995).
3 See Wolkoff (1981) and Bartik (1991) for reviews and critiques on research methodologies used in this field.
This means that a tax decrease of 10 percent would raise employment, investment, or firm creations somewhere between 1 and 6 percent.
In a recent review article, Wasylenko (1997) reached a similar conclusion, but suggested that -0.2 might be a more reasonable estimate for average interregional elasticity, instead of Bartik’s 1991 estimate of -0.3.
The smaller the area or region in which a firm is choosing a location, the more similar the non-tax factors tend to be across sub-areas. In the context of several similar sub-areas, fiscal factors tend to take on greater significance. As a result, the intra-regional tax elasticity is expected to be higher than interregional elasticity. Studies of business investment decisions within states or metropolitan areas are more consistent in finding that local fiscal policies, and especially property taxes, do have an influence on the location of the new investment. Research concerning the intra-urban location of businesses by Wasylenko (1980), found significant effects of tax differentials on the location of firms as well as differences in intra-regional employment growth. Bartik (1991) also reported that tax differences have substantially larger effects on economic growth within areas than among them. He suggested that the elasticity of intra-metropolitan area business location with respect to taxes is in the range of -1.0 to -3.0, about five to 10 times greater than the interregional effect.
This means that a 10 percent difference in taxes between two adjacent jurisdictions could lead to somewhere between a 10 to 30 percent difference in investment or job creation.
The Success of Tax Incentives as an Economic Development Tool May Depend on Local Characteristics
Since the 1970s, more states have provided various tax incentives to specific firms or to certain pre-specified areas. Much of the popular debate over tax incentives has focused on the highly publicized deals that states have negotiated in their attempts to attract a major industrial facility. Many, especially in the mainstream press, have called for an end to these “firm-specific incentives.”4 The three most popular state and local tax incentives are property tax abatements, enterprise zones, and tax increment financing (TIF). The focus here is on PTAs.
There are relatively few empirical studies focused on the impacts of property tax abatements. Morgan and Hackbart (1974) used cost-benefit analysis to evaluate the effectiveness of PTAs on a statewide level. For the tax abatement policy to pass the cost-benefit criteria, they found that state tax exemptions would have to stimulate 5 to 10 percent of increased value added in a state.
In an actual empirical analysis of Indiana, Coffin (1982) estimated that the present value of property tax abatements to be about 3.65 percent of total investment in Indiana. Given this small share, he argued that the tax break might not be an important factor in the locational decisions of firms. By comparing the trends concerning the assessed value of improvement and the value of building permits in Indianapolis before and after the adoption of PTA programs, he concluded that there was no clear evidence to suggest whether or not
4 For example, a TIME Magazine cover story (November 9, 1998) expressed an extremely negative view against state and local economic development programs.
PTAs were effective in stimulating the economy. Even though no clear causal relationship was found, Coffin noted that there was a reverse in the economic decline beginning two years after the PTA program was initiated.
Using a Jorgenson-type investment function and data from the city of Detroit, Wolkoff (1985) found that, on average, a 50 percent reduction in property taxes increased firm investment by 2 to 5 percent. Both Coffin and Wolkoff suggest that PTAs may simply be too small to have any substantial impact on business investment decisions. Nevertheless, by maximizing the objective function of net government revenue, Wolkoff derived the optimal amount of property tax abatements and concluded that government officials in the Detroit metropolitan area have been too generous in the provision of tax abatements. Wolkoff suggested that local economic development officials should be more selective in their granting of PTAs, based on the probability of investment as a result of offering PTAs and how each business investment would contribute to the local economy.
Wassmer (1992) used a simultaneous equations model to account for the interdependent relationship between the condition of a local economy and the offering of PTAs. Wassmer found that communities with higher property taxes and high crime rates tended to offer more PTAs to offset these disadvantages. He reported that PTAs awarded by cities in the Detroit metropolitan areas successfully attracted sufficient investment to increase the local tax base and local property tax revenue. However, while PTAs attracted more businesses into communities, the regression results showed that increase in PTAs would decrease local home values as well as local public expenditure per capita, increase user charges, and increase the local crime rate. When all these factors are taken into consideration, it is difficult to arrive at a conclusion about whether PTAs have helped or harmed communities in general.
To refine the evaluation of tax incentives as a metropolitan economic development policy instrument, scholars have argued that only the “additive effect” (that is, the positive economic effects that could be solely attributed to tax incentives) should be estimated (Storey 1990; Papke 1991). Following this argument, Wassmer (1994) estimated additive effects by controlling for “structural, cyclical, and other local influence.” By including interaction terms in the regression, Wassmer reported that whether PTAs were effective or not depended on certain characteristics of the city in question. For example, it was found that in cities with certain conditions that were unfavorable to firms, industrial PTAs could induce an elastic increase in real manufacturing value added. One important implication of this study was that the level of stimulating effect that tax incentives may have depends on the situation of the specific jurisdictions where they are applied.
Why Do Governments Want To Influence Business Location?
Clearly then, local fiscal policy has had some impact, especially when competing jurisdictions are close to each other (e.g., when they are part of the same metropolitan area or even in the same county). This raises another question: why is it desirable for the government to exert an influence over the choice of business locations within a given MSA, county, region, or state?5
Anderson and Wassmer (2000) have suggested that the theory of spatial mismatch can be used to answer this question. The basic argument of spatial mismatch theory is that structural barriers exist that serve to separate available jobs in the suburbs from unemployed laborers in center cities (Holzer 1991; Sjoquist 1995). Two primary factors have contributed to this spatial mismatch. First, the
decentralization of businesses and employment over the last couple of decades has moved job opportunities away from center cities.
Second, fiscal zoning and racial discrimination in housing have prevented poor minorities from moving to the suburbs. If tax incentives are capable of affecting the location of firms, it is sensible to use them to move jobs back to center cities, thereby alleviating the negative effects of spatial mismatch.
Bartik (1994) argued that even if the total number of jobs remains the same, moving jobs from areas with low unemployment to areas with high unemployment would increase total utility for the region. From the point of view of equity, creating jobs in areas of high unemployment can reduce the high tax burden suffered by the poor, and help revive the economy and fiscal health of poor neighborhoods.
Furthermore, jurisdictions with high unemployment tend to have underused public infrastructures and services. As a result, it also is more efficient to move jobs from areas with low to areas with high levels of unemployment since governments do not need to make as great a public expenditure to support the operation of new firms.
Following these lines of argument, Nunn (1994, p. 584) has suggested, “tax abatements could be restricted to use only in ‘needy’
areas.” Likewise, for Anderson and Wassmer (2000, p. 174), the “preferred policy prescription for the future use of local incentives in the metropolitan area is state-based encouragement (through intergovernmental revenue sharing) or regulation that targets the use of local incentives to only high unemployment and fiscally blighted areas.”
PROPERTY TAX ABATEMENTS IN INDIANAPOLIS
Since the enactment of the Indiana PTA legislation in 1977, Indianapolis has played an important role in this program. It was among the few jurisdictions that adopted this program in 1978. It has cooperated with the state to make possible some of the changes in this legislation. In 1994, Indianapolis was the first Indiana city to ask companies to sign a Memorandum of Agreement (memorandum) concerning their specific development goals when applying for property tax abatements. Many firms have lost their property tax abatements for failing to achieve these goals. Some even had to pay back their previous tax savings.
Estimated wages, total investment, and job creation goals must be specified in the memorandum. After the property taxes started to be abated, firms had to submit an annual survey regarding their actual economic contributions. Of the 162 firms that have been surveyed up to early 2000, 17 now are under probation, and 10 have lost their PTAs.6
Indianapolis established minimum average wage rate requirements for PTA applicants, which vary considerably in different townships to reflect their economic conditions (Table 1). This rate is substantially lower in Center Township than those in other inner suburban townships, presumably in order to attract more low-paying jobs and help the poor in the center city. Companies must have an average wage rate higher than the minimum average wage rate requirement to be eligible for PTAs in Indianapolis.
Table 1: Wage Rate Requirements for Property Tax Abatements in Indianapolis as of November 1999
Geographic Area Minimum Average Wage Rate
Center Township $10.45
Warren Township $12.10
Wayne Township $12.10
Decatur Township $13.75
Franklin Township $13.75
Perry Township $13.75
Lawrence Township $15.40
Pike Township $15.40
Washington Township $15.40
* Minimum Average Wage Rate refers to the blended average of salaried and hourly positions.
Source: Introduction to the Property Tax Abatement Programs, Department of Metropolitan Development, Indianapolis.
6 The final number of probations and terminations will be higher than noted here. For companies that are in just the first or second year of the annual survey, it is possible they may not meet the economic goals in later years.
Economic Impacts of Property Tax Abatements on Indianapolis
It is difficult to evaluate the contribution of tax incentives to a local economy because an evaluation can never prove definitively what might have happened had no tax breaks been offered. If the firm would have located in the same place even without PTAs, the offering of tax incentives is a waste of potential public revenue and did not result in expansion of the local economy. On the other hand, if without PTAs the company would have moved somewhere else, the tax abatements should not be regarded as a loss of tax revenue. Furthermore, employment opportunities and increased capital investments could be attributed to PTAs in this latter case.
Other complications also make an evaluation difficult. For example, tax abatements may be granted for personal or real property and the number of years of tax abatement granted varies.7 Also, some of the firms receiving PTAs have been offered other tax incentives from both the state and local governments (e.g., the Lilly expansion). Determining the total package of tax and other public incentives offered to firms in Indianapolis is beyond the scope of this study. Therefore, for purposes of simplification throughout the calculations of economic impacts, it is assumed any observed changes in employment positions and capital investments result from PTAs alone, although other public actions may well have had effects. As a counterbalance to these simplifying assumptions, when interpreting those numbers it has to be kept in mind that they actually represent the upper bound of the economic benefits of the PTA program.
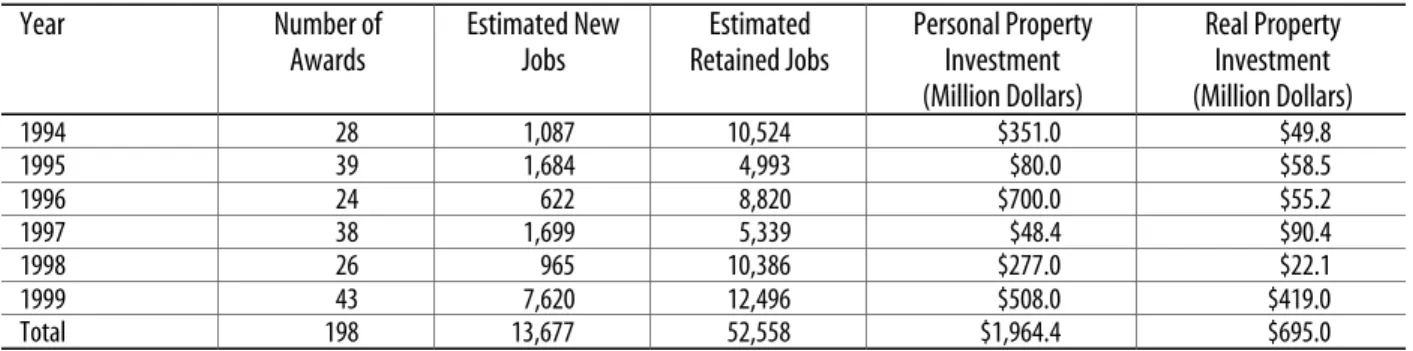
Table 2 lists the economic contributions of the PTA recipients between 1994 and 1999. Over the six years, 198 companies have been awarded some type of property tax abatements. Those companies promised to create 13,677 new jobs. Since the total employment for Indianapolis was 375,699 in 1992, if the employment goals are met, those new jobs would amount to a 3.6 percent increase in local employment. Primarily due to the expansion plans of two big companies, Eli Lilly and Company (Lilly) and Navistar International, more than 7,600 future new jobs were pledged in 1999 alone.
Table 2: Economic Contributions from Firms Receiving Property Tax Abatements in Indianapolis between 1994 and 1999
Year Number of
Awards
Estimated New Jobs
Estimated Retained Jobs
Personal Property Investment (Million Dollars)
Real Property Investment (Million Dollars)
1994 28 1,087 10,524 $351.0 $49.8
1995 39 1,684 4,993 $80.0 $58.5
1996 24 622 8,820 $700.0 $55.2
1997 38 1,699 5,339 $48.4 $90.4
1998 26 965 10,386 $277.0 $22.1
1999 43 7,620 12,496 $508.0 $419.0
Total 198 13,677 52,558 $1,964.4 $695.0
Source: Unless otherwise noted, the source for tables and figures was calculated by the author from the PTA application dataset obtained from the Indianapolis Department of Metropolitan Development.
The same companies promised in their PTA applications to retain more than 52,000 jobs. As will be explained later, there are some double-counting issues in this number, so that the real number of retained jobs is less than this estimate. There is no obvious trend in these economic variables. Regarding the growth in capital, $1.96 billion has been invested in eligible personal property, such as new manufacturing equipment. At the same time, $695 million has been invested in real property.
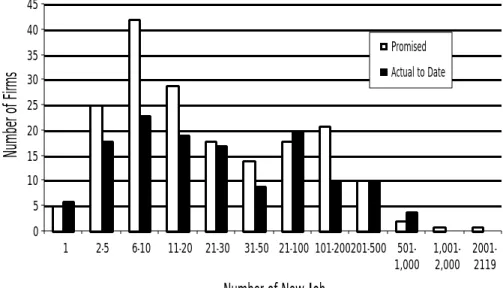
Figures 1 through 4 display the frequency distribution of jobs and investments affected by individual companies receiving PTAs.
Five of the 186 firms that have generated at least some new jobs created only one new job (Figure 1). Twenty-five firms have created two to five jobs.8 The median number of new jobs created is between 10 and 20 in each abatement award. More than 80 percent of the firms created fewer than 100 new jobs. Only two firms have promised to generate more than 1,000 jobs. Significantly, the “Actual to Date”
data indicate that many firms still have not fulfilled their promised job contributions.
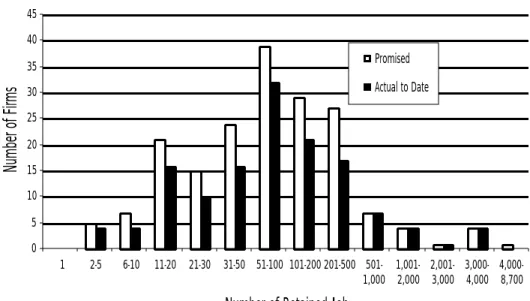
By comparing the statistics in Figure 1 and Figure 2, it is clear that the promised and reported number of retained jobs is much higher than the estimated and reported number of new jobs. Of the 184 companies reporting retained jobs, all retained at least two jobs.
The median number of retained jobs is between 50 and 100. Ten applicants have reported over 1,000 retained jobs. Similar to Figure 1, many firms either have not been surveyed for their actual retained jobs, or will need more time to accomplish their goals.
8 The display of figures 1–4 follows the same rule. Forty-two firms have generated six to 10 new jobs. Similarly, 29 firms have created 11 to 20 jobs, etc.
Figure 1: Number of New Jobs Created by Each PTA-Recipient, 1993–2000
0 5 10 15 20 25 30 35 40 45
1 2-5 6-10 11-20 21-30 31-50 21-100 101-200201-500 501- 1,000
1,001- 2,000
2001- 2119
Number of New Jobs
Number of Firms
Promised Actual to Date
Figure 2: Number of Jobs Retained by Each PTA-Recipient, 1993–2000
0 5 10 15 20 25 30 35 40 45
1 2-5 6-10 11-20 21-30 31-50 51-100 101-200 201-500 501- 1,000
1,001- 2,000
2,001- 3,000
3,000- 4,000
4,000- 8,700
Number of Retained Jobs
Number of Firms
Promised Actual to Date
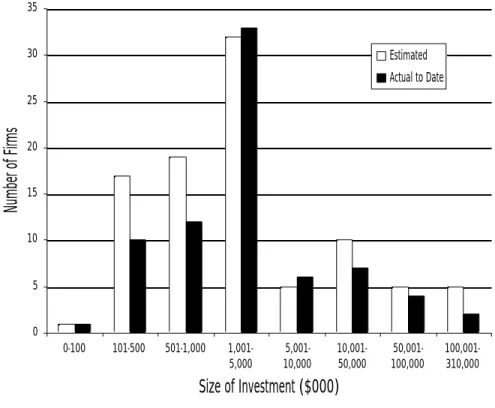
While impacts on jobs sometimes draw more attention, investments in capital are essential in enhancing the productivity of firms, which is critical to the long-term prosperity of a region. The ranges of the investment size for both personal property and real property are very broad (figures 3 and 4). The medians of both are between $1 million and $5 million. Ten applicants have promised to invest more than
$50 million in personal property.
Figure 3: Personal Property Investment by Each PTA-Recipient, 1993–2000
0 5 10 15 20 25 30 35
0-100 101-500 501-1,000 1,001- 5,000
5,001- 10,000
10,001- 50,000
50,001- 100,000
100,001- 310,000
Size of Investment ($000)
Number of Firms
Estimated Actual to Date
Figure 4: Real Property Investment by Each PTA-Recipient, 1993–2000
0 10 20 30 40 50 60
0-100 101-500 501-1,000 1,001- 5,000
5,001- 10,000
10,001- 50,000
50,001- 100,000
100,001- 300,000
Size of Investment ($000)
Number of Firms
Estimated Actual to Date
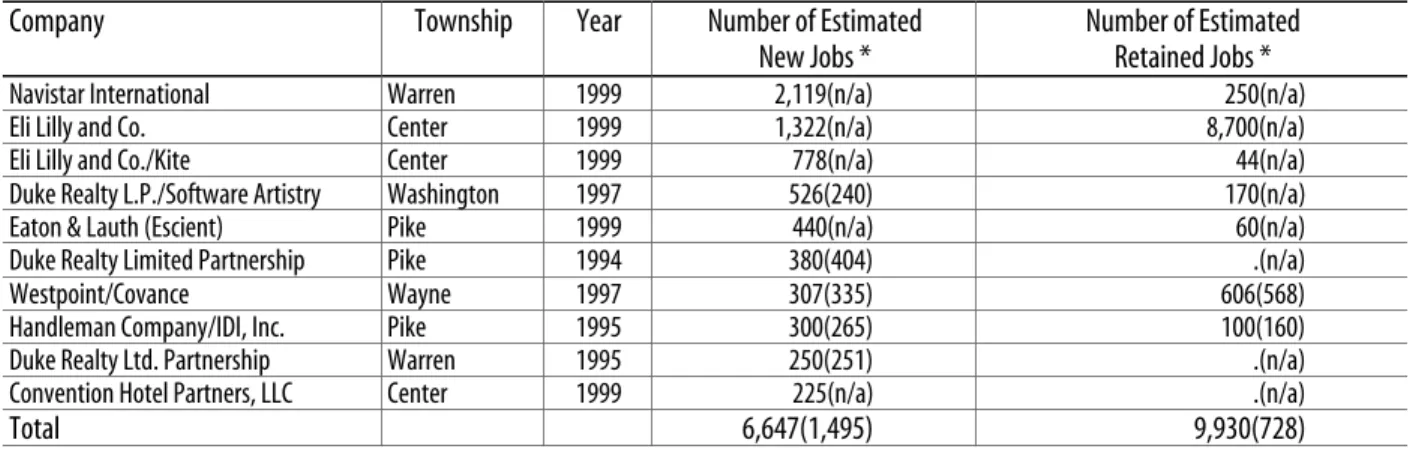
To understand how the contributions of big firms have dominated the expansion of the local economy, the next two tables list the top 10 investment projects in terms of the number of new jobs and the number of retained jobs. As stated previously, the total numbers of new and retained jobs contributed by PTA recipients between 1994 and 1999 were 13,677 and 52,558 respectively. However, the top 10 investment projects have committed to create 6,647 new employment opportunities during this period (Table 3), or about 49 percent of all the jobs created by the 198 abatement-receiving firms.
Table 3: Top 10 Investment Projects in the Contribution of New Jobs, 1993–2000
Company Township Year Number of Estimated
New Jobs *
Number of Estimated Retained Jobs *
Navistar International Warren 1999 2,119(n/a) 250(n/a)
Eli Lilly and Co. Center 1999 1,322(n/a) 8,700(n/a)
Eli Lilly and Co./Kite Center 1999 778(n/a) 44(n/a)
Duke Realty L.P./Software Artistry Washington 1997 526(240) 170(n/a)
Eaton & Lauth (Escient) Pike 1999 440(n/a) 60(n/a)
Duke Realty Limited Partnership Pike 1994 380(404) .(n/a)
Westpoint/Covance Wayne 1997 307(335) 606(568)
Handleman Company/IDI, Inc. Pike 1995 300(265) 100(160)
Duke Realty Ltd. Partnership Warren 1995 250(251) .(n/a)
Convention Hotel Partners, LLC Center 1999 225(n/a) .(n/a)
Total 6,647(1,495) 9,930(728)
* Numbers in parentheses are jobs that have been created or retained to date according to the annual survey of firms. “.” indicates that the company did not report any estimated jobs. “n/a” means there were no available annual survey data regarding the number of created or retained jobs.
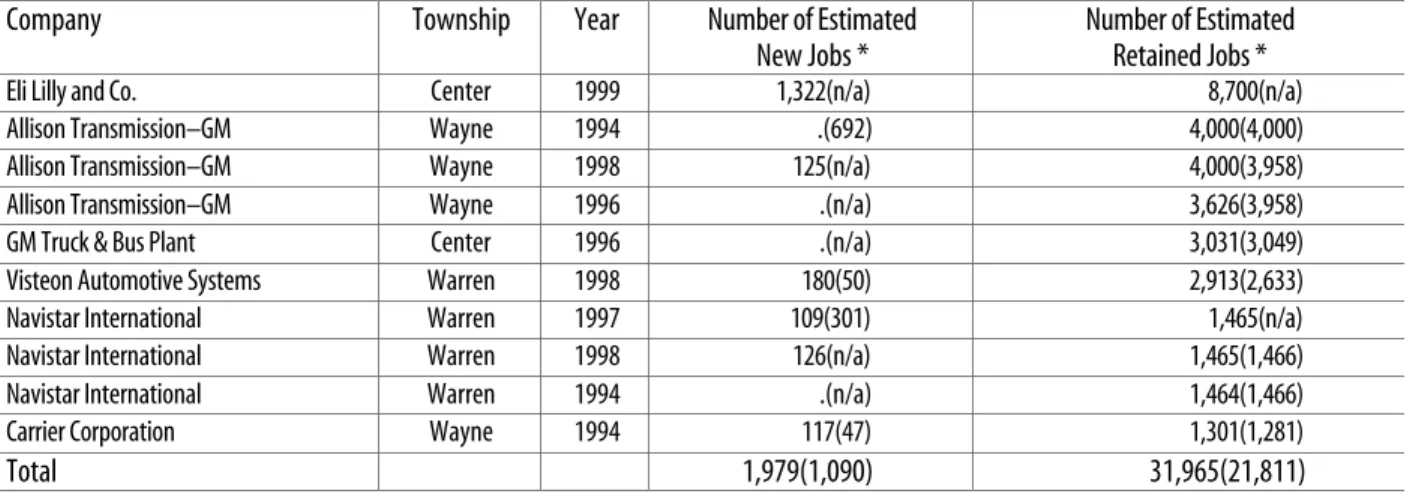
The case for retained jobs was even more extreme. The top 10 investment plans projected retainment of 31,965 jobs, which was 61 percent of the total estimated jobs retained by all 198 companies (Table 4). However, if the first and last columns of Table 4 are closely examined, the repetition of the same company names and the same numbers of retained jobs is evident. Allison Transmission–GM, located in Wayne Township, has been awarded personal property tax abatements three times between 1994 and 1998, and each time Allison estimated retained jobs of about 4,000 in the PTA application.
Similarly in three applications for personal property investments in 1994, 1997, and 1998, Navistar International, located in Warren Township, projected retained jobs at 1,464 or 1,465. Although it may be difficult to argue with these companies about how critical the tax abatements were in their efforts to keep those jobs, it also is a stretch in credibility to claim that Indianapolis has retained 12,000 jobs when in fact it is the same 4,000 jobs “retained” three times. Because of this, conclusions about the total number of retained jobs should be tempered by these likely over counts.
Table 4: Top 10 Investment Projects in the Contribution of Retained Jobs, 1993–2000
Company Township Year Number of Estimated
New Jobs *
Number of Estimated Retained Jobs *
Eli Lilly and Co. Center 1999 1,322(n/a) 8,700(n/a)
Allison Transmission–GM Wayne 1994 .(692) 4,000(4,000)
Allison Transmission–GM Wayne 1998 125(n/a) 4,000(3,958)
Allison Transmission–GM Wayne 1996 .(n/a) 3,626(3,958)
GM Truck & Bus Plant Center 1996 .(n/a) 3,031(3,049)
Visteon Automotive Systems Warren 1998 180(50) 2,913(2,633)
Navistar International Warren 1997 109(301) 1,465(n/a)
Navistar International Warren 1998 126(n/a) 1,465(1,466)
Navistar International Warren 1994 .(n/a) 1,464(1,466)
Carrier Corporation Wayne 1994 117(47) 1,301(1,281)
Total 1,979(1,090) 31,965(21,811)
* See Table 3
More Tax Abatements are Awarded in Center Township than in Other Townships
Like many center cities in this country, Center Township of Indianapolis has suffered from decreased tax base, lost employment positions, and serious financial burdens related to poor relief. The low-income population in Indianapolis is concentrated in Center Township.
As noted by Rosentraub and Nunn (1994, p. 3), in 1989, “41 percent of the children under the age of five in Center Township lived in households which had an income at or below poverty level.” As numerous wealthy residents and firms have moved to suburban townships or other counties in the Indianapolis metropolitan area, current population in Center Township consists of many who are not mobile and not well educated. Nonetheless, they are forced to share the burden of higher property tax rates as a result of reduced property tax base.
Even though Indianapolis–Marion County has adopted the consolidated Unigov structure, there are 57 different taxing jurisdictions in the county. The provision of public services and the property tax base of Indianapolis are not consolidated, but “instead, the most important public services are financed with a tax base from a smaller unit of government, the township” (Rosentraub and Nunn 1994, p. 18).
However, the Unigov structure allowed Indianapolis to institutionalize PTA administration through the appointment of the Indianapolis Metropolitan Development Commission as the designating body for all nine townships. This consolidated program administration makes it impossible for firms to seek multiple tax incentive offers from different townships after they have decided to locate in Marion County. Further, the distinctive minimum average wage requirements for the townships means that companies generating low-paying jobs with average wages less than $12.10 per hour (but at least $10.45) are eligible for PTAs only in Center Township.
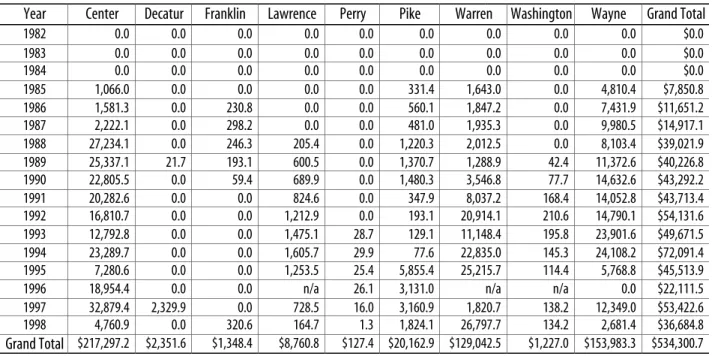
Center Township has deducted more taxes for both personal and real properties than any of the eight other townships, as shown in tables 5 and 6. For personal property, all the deductions prior to 1984 were zero because the legislation allowing personal property tax
abatements was not adopted until 1983. Overall, more than $534 million of personal property have been deducted in assessed value from the tax base in Indianapolis between 1985 and 1998 (Table 5). The share for Center Township was $217.3 million or 40.7 percent of the city total. Wayne Township deducted $154 million (28.9 percent) and Warren Township deducted $129 million (24.2 percent) in this period.
These three townships accounted for 93.7 percent of the personal property tax deductions in Indianapolis. They also are the townships that have the lowest average wage requirements for abatement eligibility.
Table 5: Deduction from the Assessed Value of Personal Property by Township, 1982–98 ($000)
Year Center Decatur Franklin Lawrence Perry Pike Warren Washington Wayne Grand Total
1982 0.0 0.0 0.0 0.0 0.0 0.0 0.0 0.0 0.0 $0.0
1983 0.0 0.0 0.0 0.0 0.0 0.0 0.0 0.0 0.0 $0.0
1984 0.0 0.0 0.0 0.0 0.0 0.0 0.0 0.0 0.0 $0.0
1985 1,066.0 0.0 0.0 0.0 0.0 331.4 1,643.0 0.0 4,810.4 $7,850.8
1986 1,581.3 0.0 230.8 0.0 0.0 560.1 1,847.2 0.0 7,431.9 $11,651.2
1987 2,222.1 0.0 298.2 0.0 0.0 481.0 1,935.3 0.0 9,980.5 $14,917.1
1988 27,234.1 0.0 246.3 205.4 0.0 1,220.3 2,012.5 0.0 8,103.4 $39,021.9
1989 25,337.1 21.7 193.1 600.5 0.0 1,370.7 1,288.9 42.4 11,372.6 $40,226.8
1990 22,805.5 0.0 59.4 689.9 0.0 1,480.3 3,546.8 77.7 14,632.6 $43,292.2
1991 20,282.6 0.0 0.0 824.6 0.0 347.9 8,037.2 168.4 14,052.8 $43,713.4
1992 16,810.7 0.0 0.0 1,212.9 0.0 193.1 20,914.1 210.6 14,790.1 $54,131.6
1993 12,792.8 0.0 0.0 1,475.1 28.7 129.1 11,148.4 195.8 23,901.6 $49,671.5
1994 23,289.7 0.0 0.0 1,605.7 29.9 77.6 22,835.0 145.3 24,108.2 $72,091.4
1995 7,280.6 0.0 0.0 1,253.5 25.4 5,855.4 25,215.7 114.4 5,768.8 $45,513.9
1996 18,954.4 0.0 0.0 n/a 26.1 3,131.0 n/a n/a 0.0 $22,111.5
1997 32,879.4 2,329.9 0.0 728.5 16.0 3,160.9 1,820.7 138.2 12,349.0 $53,422.6
1998 4,760.9 0.0 320.6 164.7 1.3 1,824.1 26,797.7 134.2 2,681.4 $36,684.8
Grand Total $217,297.2 $2,351.6 $1,348.4 $8,760.8 $127.4 $20,162.9 $129,042.5 $1,227.0 $153,983.3 $534,300.7
Source: Calculated by the author from the taxing unit dataset compiled by the State Board of Tax Commissioners.
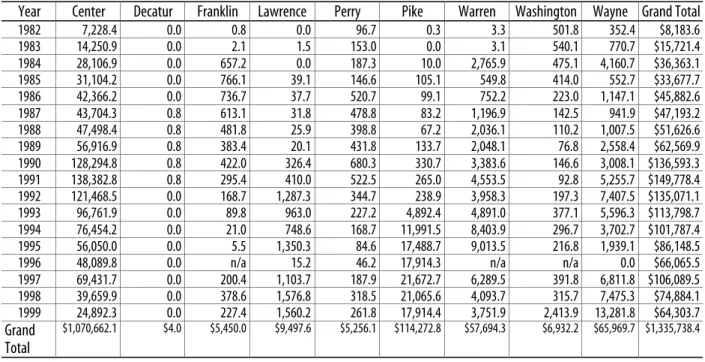
More than $1.3 billion of real property was deducted from the property tax base in Indianapolis from 1982 to 1999 (Table 6).
Companies in Center Township accounted for $1.1 billion (80.5 percent) of deduction from the total. Even though the time trend seems to indicate that the use of real PTAs has decreased in Center Township since 1992 as other townships increased, the leading role of Center Township in using this tax incentive is clear.
Table 6: Deduction from the Assessed Value of Real Property by Township, 1982–99 ($000)
Year Center Decatur Franklin Lawrence Perry Pike Warren Washington Wayne Grand Total
1982 7,228.4 0.0 0.8 0.0 96.7 0.3 3.3 501.8 352.4 $8,183.6
1983 14,250.9 0.0 2.1 1.5 153.0 0.0 3.1 540.1 770.7 $15,721.4
1984 28,106.9 0.0 657.2 0.0 187.3 10.0 2,765.9 475.1 4,160.7 $36,363.1
1985 31,104.2 0.0 766.1 39.1 146.6 105.1 549.8 414.0 552.7 $33,677.7
1986 42,366.2 0.0 736.7 37.7 520.7 99.1 752.2 223.0 1,147.1 $45,882.6
1987 43,704.3 0.8 613.1 31.8 478.8 83.2 1,196.9 142.5 941.9 $47,193.2
1988 47,498.4 0.8 481.8 25.9 398.8 67.2 2,036.1 110.2 1,007.5 $51,626.6
1989 56,916.9 0.8 383.4 20.1 431.8 133.7 2,048.1 76.8 2,558.4 $62,569.9
1990 128,294.8 0.8 422.0 326.4 680.3 330.7 3,383.6 146.6 3,008.1 $136,593.3
1991 138,382.8 0.8 295.4 410.0 522.5 265.0 4,553.5 92.8 5,255.7 $149,778.4
1992 121,468.5 0.0 168.7 1,287.3 344.7 238.9 3,958.3 197.3 7,407.5 $135,071.1
1993 96,761.9 0.0 89.8 963.0 227.2 4,892.4 4,891.0 377.1 5,596.3 $113,798.7
1994 76,454.2 0.0 21.0 748.6 168.7 11,991.5 8,403.9 296.7 3,702.7 $101,787.4
1995 56,050.0 0.0 5.5 1,350.3 84.6 17,488.7 9,013.5 216.8 1,939.1 $86,148.5
1996 48,089.8 0.0 n/a 15.2 46.2 17,914.3 n/a n/a 0.0 $66,065.5
1997 69,431.7 0.0 200.4 1,103.7 187.9 21,672.7 6,289.5 391.8 6,811.8 $106,089.5
1998 39,659.9 0.0 378.6 1,576.8 318.5 21,065.6 4,093.7 315.7 7,475.3 $74,884.1
1999 24,892.3 0.0 227.4 1,560.2 261.8 17,914.4 3,751.9 2,413.9 13,281.8 $64,303.7
Grand Total
$1,070,662.1 $4.0 $5,450.0 $9,497.6 $5,256.1 $114,272.8 $57,694.3 $6,932.2 $65,969.7 $1,335,738.4
Source: See Table 5
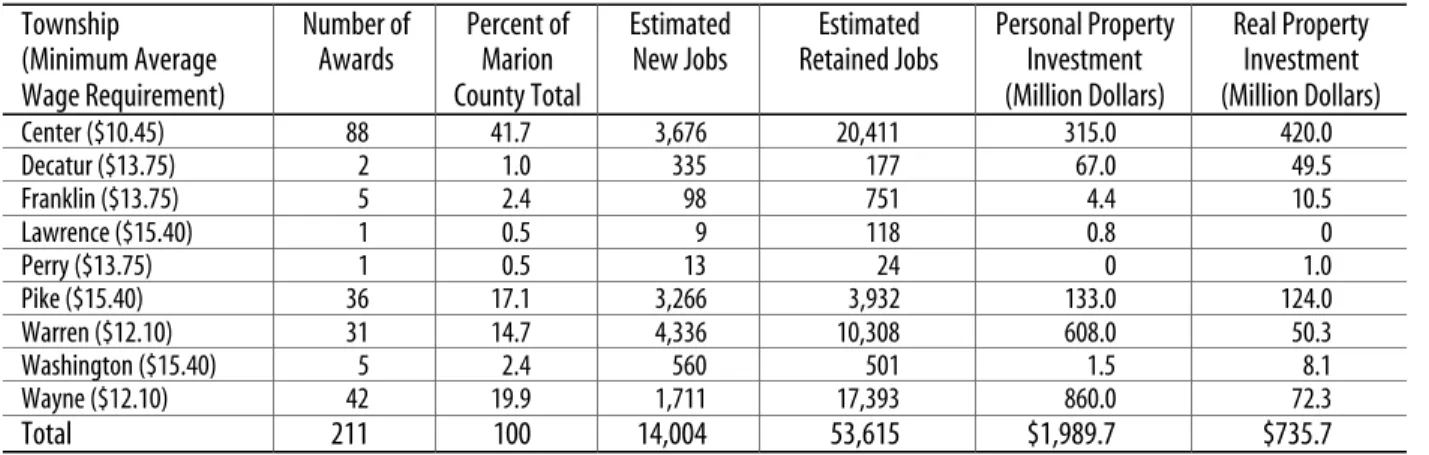
Table 7 depicts how the returns of this investment have been distributed among the nine townships. On the whole, this program has generated more positive economic stimulus in Center and other poor townships than in the wealthy ones. Eighty-eight of the 211 applicants approved between 1993 and 2000 (42 percent) located in Center Township. The other two poor townships, Wayne and Warren, also have awarded many of the tax abatements. The only surprise was relatively wealthy Pike Township, which offered property tax abatements to 36 firms. None of the other townships approved more than five awards during the 1993–2000 period.
According to company applications, Warren Township commitments would generate 4,336 new jobs from 31 projects. Navistar International alone committed to create 2,119 new jobs in Warren Township with an expansion in 1999. Center Township would have 3,676 more new jobs because of the 88 awards there. Again, the contribution from big companies made a substantial difference. The two expansion plans submitted by Eli Lilly in 1999 are expected to create 2,100 new jobs. Even though the greatest single contribution in new jobs was only 440 in Pike Township, overall 3,266 new jobs are expected to be generated there.
Table 7: Use of Property Tax Abatements by Township, 1993–2000 * Township
(Minimum Average Wage Requirement)
Number of Awards
Percent of Marion County Total
Estimated New Jobs
Estimated Retained Jobs
Personal Property Investment (Million Dollars)
Real Property Investment (Million Dollars)
Center ($10.45) 88 41.7 3,676 20,411 315.0 420.0
Decatur ($13.75) 2 1.0 335 177 67.0 49.5
Franklin ($13.75) 5 2.4 98 751 4.4 10.5
Lawrence ($15.40) 1 0.5 9 118 0.8 0
Perry ($13.75) 1 0.5 13 24 0 1.0
Pike ($15.40) 36 17.1 3,266 3,932 133.0 124.0
Warren ($12.10) 31 14.7 4,336 10,308 608.0 50.3
Washington ($15.40) 5 2.4 560 501 1.5 8.1
Wayne ($12.10) 42 19.9 1,711 17,393 860.0 72.3
Total 211 100 14,004 53,615 $1,989.7 $735.7
* Data in years 1993 and 2000 are not complete.
Source: See Table 5
If all projections are met, property tax abatements will help Center Township retain 20,411 jobs, of which 8,700 can be attributed to the 1999 Eli Lilly expansion. Wayne Township was not far behind with 17,393 retained jobs. However, given the triple counting of the 4,000 jobs in Allison Transmission–GM, the more reasonable number should be around 10,000 retained jobs. Similarly, the 10,308 jobs retained in Warren Township included the triple counting of the 1,465 jobs in Navistar International, so the real number of retained jobs in Warren Township should be about 7,500.
The companies receiving PTAs in the three poorest townships also have invested a significant amount of money in both personal and real property (Table 7). Center Township attracted the most real property investments through PTA projects. More than 50 percent ($216 million) of the $420 million real property investments in Center Township came from the 1999 Lilly project. According to application commitments, this single project has provided more capital investment than the total of any other individual township during the eight- year period.
To understand how significant a role PTAs have played in local finance, tables 8 and 9 list the ratio of property assessed value deducted to the net assessed value of property in each township. For personal property, Center Township was ranked number three, behind Wayne and Warren, in terms of the average percentage of property deducted (Table 8). More importantly, this ratio in Center Township has started to decline since the early 1990s. In contrast, the ratio in Warren Township has been increasing consistently.
With regard to real property, Center Township continued to dominate in terms of the ratio of property tax deduction to local tax base (Table 9). However, in the 1990s this ratio decreased continuously and substantially in Center Township. Previous research has reported the existence of the copycat behavior that resulted in the short-lived stimulating effects for economically depressed areas (Wassmer 1993). However, because there is only one designating body for all the Marion County townships, it is not possible for this phenomenon to happen inside the Marion County area. Nonetheless, city officials should be concerned about the reason the PTA program in Center Township is losing its attractiveness to firms.
Table 8: Ratio of the Assessed Value of Personal Property Deducted to the Net Assessed Value of Personal Property by Township, 1982–98 Year Center % Decatur % Franklin % Lawrence % Perry % Pike % Warren % Washington % Wayne %
1982 0.00 0.00 0.00 0.00 0.00 0.00 0.00 0.00 0.00
1983 0.00 0.00 0.00 0.00 0.00 0.00 0.00 0.00 0.00
1984 0.00 0.00 0.00 0.00 0.00 0.00 0.00 0.00 0.00
1985 0.25 0.00 0.00 0.00 0.00 0.27 0.79 0.00 1.85
1986 0.35 0.00 0.70 0.00 0.00 0.40 0.88 0.00 2.59
1987 0.47 0.00 0.96 0.00 0.00 0.36 0.92 0.00 3.48
1988 5.37 0.00 0.85 0.24 0.00 0.86 0.92 0.00 2.74
1989 4.93 0.07 0.60 0.64 0.00 0.88 0.59 0.04 3.87
1990 4.10 0.00 0.19 0.67 0.00 0.84 1.51 0.06 4.32
1991 3.76 0.00 0.00 0.76 0.00 0.18 3.35 0.13 3.89
1992 3.01 0.00 0.00 1.06 0.00 0.08 8.16 0.17 4.02
1993 2.18 0.00 0.00 1.23 0.03 0.06 4.23 0.15 5.97
1994 3.79 0.00 0.00 1.27 0.03 0.03 8.53 0.10 5.68
1995 1.10 0.00 0.00 0.97 0.03 2.29 8.63 0.08 1.51
1996 2.89 n/a n/a 0.00 0.02 1.10 n/a n/a 0.00
1997 4.93 3.57 0.00 0.49 0.01 1.04 0.51 0.07 2.83
1998 0.68 0.00 0.57 0.11 0.00 0.60 6.77 0.07 0.59
Average Ratio 2.22% 0.23% 0.24% 0.44% 0.01% 0.53% 2.86% 0.05% 2.55%
Source: See Table 5
Table 9: Ratio of the Assessed Value of Real Property Deducted to the Net Assessed Value of Real Property by Township, 1982–99 Year Center % Decatur % Franklin % Lawrence % Perry % Pike % Warren % Washington % Wayne %
1982 1.36 0.00 0.00 0.00 0.04 0.00 0.00 0.10 0.09
1983 2.63 0.00 0.00 0.00 0.06 0.00 0.00 0.10 0.20
1984 4.72 0.00 0.90 0.00 0.07 0.01 0.79 0.09 1.06
1985 5.51 0.00 1.03 0.01 0.05 0.05 0.16 0.07 0.14
1986 7.43 0.00 0.97 0.01 0.19 0.04 0.22 0.04 0.29
1987 7.24 0.00 0.77 0.01 0.17 0.03 0.35 0.02 0.23
1988 8.18 0.00 0.59 0.01 0.14 0.02 0.58 0.02 0.24
1989 9.49 0.00 0.45 0.00 0.14 0.04 0.57 0.01 0.60
1990 13.14 0.00 0.32 0.05 0.16 0.06 0.63 0.01 0.43
1991 13.97 0.00 0.21 0.06 0.12 0.05 0.84 0.01 0.74
1992 13.15 0.00 0.12 0.17 0.08 0.04 0.71 0.02 1.04
1993 10.56 0.00 0.06 0.13 0.05 0.76 0.86 0.03 0.77
1994 8.90 0.00 0.01 0.09 0.04 1.78 1.44 0.03 0.51
1995 6.64 0.00 0.00 0.17 0.02 2.45 1.51 0.02 0.27
1996 5.45 n/a n/a 0.01 0.01 2.20 n/a n/a 0.00
1997 7.36 0.00 0.10 0.12 0.03 2.53 0.91 0.03 0.80
1998 4.47 0.00 0.17 0.16 0.06 2.38 0.57 0.03 0.88
1999 2.85 0.00 0.10 0.16 0.04 1.94 0.51 0.19 1.52
Average Ratio 7.39% 0.00% 0.34% 0.06% 0.08% 0.80% 0.63% 0.05% 0.55%
Source: See Table 5
Tax Abatements Have Fiscal Impacts on School Districts
Property tax is an important revenue source for school districts and, as a result, many scholars and policymakers have expressed concerns about how education has been affected by PTAs for the sake of economic stimulation. The designating bodies rarely consult school districts regarding PTA awards. Even if the tax base will increase in the long run, school districts are forced to deal with the immediate loss in property tax revenue when PTAs are granted.
Between 1992 and 1998, more than $371 million in assessed value of personal property was deducted in the 11 school districts in Marion County (Table 10), and $695.4 million in real property (Table 11). The magnitude of the fiscal impacts of PTAs changes considerably across districts. School districts in economically deprived neighborhoods usually lose more of their potential property tax revenues than those in the wealthy areas. For instance, Indianapolis Public School (IPS), with most of its jurisdiction overlapping with Center Township, had a $149.7 million deduction in personal property and a $518.1 million deduction in real property, the highest among all school districts.
As state and local government officials try to alleviate these negative fiscal impacts on school districts, such geographic discrepancies should be taken into consideration.
Table 10: Deduction from the Assessed Value of Personal Property by School District, 1992–98 ($000)
School District 1992 1993 1994 1995 1996 1997 1998 Grand Total
Decatur Township 0.0 0.0 0.0 0.0 1,360.6 2,329.9 0.0 $3,690.5
Franklin Township 0.0 0.0 0.0 0.0 0.0 0.0 320.6 $320.6
Lawrence Township 1,212.9 1,475.1 1,605.7 1,253.5 1,066.9 728.5 164.7 $7,507.3
Perry Township 0.0 0.0 0.0 0.0 5.3 0.0 0.0 $5.3
Pike Township 193.1 129.1 77.6 5,855.4 3,131.0 3,160.9 1,842.1 $14,389.2
Warren Township 14,188.8 10,832.6 17,210.5 17,577.0 21,183.7 1,820.7 26,346.8 $109,160.1
Washington Township 0.0 0.0 0.0 0.0 2.9 67.7 71.7 $142.3
Wayne Township 13,950.7 12,956.1 12,909.5 3,961.1 4,792.6 5,117.1 812.0 $54,499.1
Beech Grove City 0.0 0.0 0.0 37.8 0.0 1,518.4 1,277.7 $2,833.9
Indianapolis Public 23,905.3 13,968.4 30,101.5 16,631.7 27,832.5 32,509.6 4,786.1 $149,735.1
Speedway City 680.8 10,310.1 10,186.6 197.4 365.0 6,169.8 1,081.2 $28,990.9
Grand Total $54,131.6 $49,671.4 $72,091.4 $45,513.9 $59,740.5 $53,422.6 $36,702.9 $371,274.3 Source: See Table 5
Table 11: Deduction from the Assessed Value of Real Property by School District, 1992–98 ($000)
School District 1992 1993 1994 1995 1996 1997 1998 Grand Total
Decatur Township 0.0 0.0 0.0 0.0 0.0 0.0 0.0 $0.0
Franklin Township 0.0 0.0 0.0 0.0 0.0 0.0 0.0 $0.0
Lawrence Township 1,287.3 963.0 748.6 1,350.3 1,559.7 1,103.7 1,576.8 $8,589.4
Perry Township 343.2 227.2 98.0 29.8 1.0 157.2 366.1 $1,222.5
Pike Township 238.9 4,892.4 11,991.5 17,488.7 17,914.3 21,672.7 21,065.6 $95,264.1
Warren Township 2,967.2 3,244.3 7,113.7 8,099.2 5,674.6 5,412.7 3,642.9 $36,154.6
Washington Township 0.0 0.0 0.0 0.0 0.0 0.0 1.0 $1.0
Wayne Township 7,248.4 5,573.6 3,684.4 1,885.3 2,265.5 6,788.3 6,758.7 $34,204.2
Beech Grove City 169.3 89.8 21.0 5.5 303.7 200.4 378.6 $1,168.3
Indianapolis Public 122,816.7 98,808.4 78,130.1 57,289.7 49,798.6 70,754.6 40,457.2 $518,055.3
Speedway City 0.0 0.0 0.0 0.0 0.0 0.0 700.1 $700.1
Grand Total $135,071.0 $113,798.7 $101,787.3 $86,148.5 $77,517.4 $106,089.6 $74,947.0 $695,359.5 Source: See Table 5
Since school districts may differ from each other substantially in the size of their tax bases, assessed value deducted should not be used as the only indicator on their fiscal impacts. To provide another perspective, tables 12 and 13 record the percentages of tax bases that have been abated. This provides a somewhat different picture from tables 10 and 11. The greatest impact from personal PTAs was in Speedway City School District in 1993 and 1994, during which more than 15 percent of the net assessed value of personal property was abated (Table 12). For PTAs on real property, IPS has been affected more seriously than all the others (Table 13).
Table 12: Ratio of the Assessed Value of Personal Property Deducted to the Assessed Value of Personal Property by School District, 1992–98
School District 1992 1993 1994 1995 1996 1997 1998
Decatur Township 0.00% 0.00% 0.00% 0.00% 2.49% 3.57% 0.00%
Franklin Township 0.00% 0.00% 0.00% 0.00% 0.00% 0.00% 1.11%
Lawrence Township 1.15% 1.33% 1.38% 1.06% 0.85% 0.54% 0.12%
Perry Township 0.00% 0.00% 0.00% 0.00% 0.01% 0.00% 0.00%
Pike Township 0.08% 0.06% 0.03% 2.31% 1.11% 1.05% 0.61%
Warren Township 7.24% 5.35% 8.13% 7.66% 8.28% 0.66% 8.65%
Washington Township 0.00% 0.00% 0.00% 0.00% 0.00% 0.05% 0.05%
Wayne Township 6.01% 5.32% 4.90% 1.85% 2.06% 2.05% 0.31%
Beech Grove City 0.00% 0.00% 0.00% 0.13% 0.00% 3.72% 3.13%
Indianapolis Public 3.15% 1.76% 3.66% 1.89% 3.07% 3.50% 0.49%
Speedway City 1.18% 15.01% 15.10% 0.26% 0.45% 7.28% 1.34%
Source: See Table 5
Table 13: Ratio of the Assessed Value of Real Property Deducted to the Assessed Value of Real Property by Township, 1992–98
School District 1992 1993 1994 1995 1996 1997 1998
Decatur Township 0.00% 0.00% 0.00% 0.00% 0.00% 0.00% 0.00%
Franklin Township 0.00% 0.00% 0.00% 0.00% 0.00% 0.00% 0.00%
Lawrence Township 0.20% 0.14% 0.11% 0.19% 0.19% 0.13% 0.18%
Perry Township 0.08% 0.05% 0.02% 0.01% 0.00% 0.03% 0.07%
Pike Township 0.04% 0.79% 1.83% 2.52% 2.25% 2.59% 2.43%
Warren Township 0.74% 0.78% 1.65% 1.82% 1.11% 1.01% 0.68%
Washington Township 0.00% 0.00% 0.00% 0.00% 0.00% 0.00% 0.00%
Wayne Township 1.68% 1.27% 0.83% 0.42% 0.44% 1.28% 1.26%
Beech Grove City 0.25% 0.13% 0.03% 0.01% 0.39% 0.25% 0.46%
Indianapolis Public 7.54% 6.10% 5.01% 3.71% 2.96% 4.04% 2.43%
Speedway City 0.00% 0.00% 0.00% 0.00% 0.00% 0.00% 0.59%
Source: See Table 5
The Average Cost per Job Varies Widely Between Townships
Another way of looking at tax incentives is to examine the cost of jobs “purchased” by abatements as well as cost of private capital investment reportedly generated by PTAs. What is the cost of jobs and investments contributed by companies that are beneficiaries of the Indianapolis PTA program? To calculate cost per job, the estimated taxes foregone by townships and the number of jobs retained and created by firms should be considered. Estimated values of real and personal investments are used as the foundation for the calculation of tax savings.9
9 Since actual investments to date may include only part of the planned project, it makes more sense to use the promised values provided by the firms in their application for evaluation purposes.
Data on several factors are needed to compute the amount of property taxes sacrificed for PTAs. Real values on state property tax replacement credits (PTRC) and property tax rates of each jurisdiction are used to make calculation as accurate as possible.10 Because of data constraints, however, the tax board rate is assumed to be 0.5 for the computation of true tax value. Since tax savings to companies are distributed over multiple years, three discount rates have been applied to examine the present value of the tax savings. Table 14 lists some summary statistics for the total tax savings (sum of real and personal property tax savings) of the 201 firms that have provided enough information for this evaluation. Because the magnitude of investments varies among different companies, the range of tax savings is extremely wide, ranging from $6,350 to $31.5 million, assuming the discount rate is 0. On average, the value of PTAs is worth about
$1 million.
Table 14: Total Tax Savings for Firms Awarded Property Tax Abatements, 1993–2000
Discount Rate Observation Mean Standard Deviation Minimum Maximum
0 201 $1,031,558 $3,868,098 $6,350 $31,500,000
5% 201 $912,910 $3,341,147 $5,866 $26,900,000
10% 201 $821,214 $2,945,105 $5,462 $23,400,000
After the tax savings for each firm is calculated, respective costs per new job can be computed by dividing the tax savings by the number of new jobs created. Table 15 lists descriptive statistics for the cost per new job variable. The average cost per new job of the 177 firms that generated new jobs is between $7,163 and $8,808 (depending upon the discount rate chosen). The range of the cost per job is extremely wide for different companies. When the discount rate is 0, the lowest cost per job is $72, generated by Aircom Manufacturing Inc. Aircom invested only $500,000 in real property, but created 208 new jobs. Interestingly, Aircom was offered only three years of PTAs for its contribution.11
On the other hand, the most expensive new jobs, which cost more than $1 million each, were generated by DTE. DTE invested
$48.5 million but generated only two new jobs. The company reported no estimated retained jobs as a result of its project. It was the only company that cost the government more than $100,000 in foregone property tax revenue in order to create a new job.
10 For the definition of those terms, and an introduction to the Indiana property taxes, see Indiana Legislative Service Agency (1999), Indiana Handbook of Taxes, Revenues, and Appropriations, Indianapolis, Indiana.
Table 15: Cost per New Job, Weighted by the Number of New Jobs Created by Each Firm, 1993–2000 (Discount Rate = 0, 0.05, 0.10) *
Discount Rate Median Mean Standard Deviation Minimum Maximum
0 $2,865 $8,808 $22,764 $72 $1,404,215
0.05 $2,648 $7,886 $20,958 $70 $1,297,362
0.10 $2,468 $7,163 $19,466 $68 $1,207,861
* Number of firms: 177; Number of new jobs: 13,629
If both new and retained jobs are considered at the same time, the cost per job drops considerably. For each created or retained job, the city lost about $3,000 in property tax revenues on average (Table 16). The maximums in Table 15 and Table 16 are the same because DTE did not report any retained jobs in its PTA application. As a result, its new job contribution and total job contribution (new plus retained) are the same.
Table 16: Cost per New or Retained Job, Weighted by the Number of New and Retained Jobs by Each Firm, 1993–2000 (Discount Rate = 0, 0.05, 0.10) *
Discount Rate Median Mean Standard Deviation Minimum Maximum
0 $1,870 $3,098 $10,122 $56 $1,404,215
0.05 $1,656 $2,742 $9,270 $52 $1,297,362
0.10 $1,489 $2,466 $8,577 $48 $1,207,861
* Number of firms: 198; Number of total jobs: 66,761
Instead of calculating the cost per job for the Indianapolis PTA program as a whole, tables 17 and 18 report the cost effectiveness of this program in the nine townships. Washington Township lost $1,002 in property tax revenue for each of the 560 new jobs generated.
At the other extreme, Decatur Township lost $34,209 for each of its 335 new jobs. By paying $9,588 per new job, Center Township ranked fifth of the nine townships, and was a bit higher than the city average $8,808 (Table 15).
When new and retained jobs are considered at the same time, again, the cost per job number drops significantly. The mean now ranges from $383 in Lawrence Township to $13,749 in Decatur Township (Table 18). The cost in Center Township was $2,794, lower than the city average of $3,098.
Table 17: Cost per New Job When Discount Rate=0, Weighted by the Number of New Jobs Created by Each Firm, by Township, 1993–2000 *
Township (Minimum Wage Requirement)
Sum of New Jobs
No. of Firms Median Mean Standard
Deviation
Minimum Maximum
Decatur ($13.75) 335 2 $34,209 $21,010 $22,712 $1,467 $34,208
Franklin ($13.75) 98 5 $11,820 $11,152 $10,876 $1,354 $25,837
Warren ($12.10) 4,236 28 $14,860 $11,105 $8,951 $72 $34,997
Wayne ($12.10) 1,609 36 $1,835 $10,126 $12,349 $453 $53,414
Center ($10.45) 3,503 64 $7,758 $9,588 $8,755 $641 $98,806
Lawrence ($15.40) 9 1 $5,403 $5,403 . $5,403 $5,403
Pike ($15.40) 3,266 35 $1,585 $4,387 $43,340 $181 $1,404,215
Perry ($13.75) 13 1 $4,234 $4,234 . $4,234 $4,234
Washington ($15.40) 560 5 $807 $1,002 $968 $807 $5,822
* Data in years 1993 and 2000 are not complete.
Table 18: Cost per New or Retained Job When Discount Rate=0, Weighted by the Number of New and Retained Jobs by Each Firm, by Township, 1993–2000 *
Township (Minimum Wage Requirement)
Sum of New and Retained Jobs
No. of Firms Median Mean Standard
Deviation
Minimum Maximum
Decatur ($13.75) 512 2 $18,147 $13,749 $10,395 $1,467 $18,148
Warren ($12.10) 14,317 30 $1,828 $3,623 $4,462 $65 $13,292
Wayne ($12.10) 19,002 41 $2,115 $3,460 $3,815 $114 $18,152
Center ($10.45) 23,658 78 $1,870 $2,794 $3,378 $56 $68,851
Pike ($15.40) 7,198 35 $1,189 $1,991 $29,079 $59 $1,404,215
Perry ($13.75) 37 1 $1,488 $1,488 . $1,488 $1,488
Franklin ($13.75) 849 5 $1,520 $1,287 $808 $378 $1,987
Washington ($15.40) 1,061 5 $610 $529 $243 $278 $3,057
Lawrence ($15.40) 127 1 $383 $383 . $383 $383
* Data in years 1993 and 2000 are not complete.
Capital investment is essential to the long-term prosperity of a region. Tables 19 and 20 evaluate the cost effectiveness of the PTA program from the perspective of capital investment. Cost for capital investment can be computed by dividing the tax saving by the amount of capital investment.12
12 A special feature of this calculation is that the size of capital investment is necessarily included when computing tax savings. Therefore, the size of capital investment will show up in both nominator and denominator when we calculate the cost for capital investment. As a result, it will cancel out in this calculation and will not influence the statistics in Table 19 and Table 20. Factors that determine these different numbers include number of years in PTAs awarded to each firm, variations
The range of cost per $1,000 of capital investment shown in tables 19 and 20 is not as large as the cost per job range. In order to attract $1,000 in capital, Indianapolis had to forego on average $76, assuming the discount rate is 0. For the extreme cases, it may be as little as $10, or as much as $121 (Table 19). Center Township was paying substantially more tax revenue, $91 per $1,000 investment, than that of the other eight townships.
Table 19: Cost per $1,000 Investment, Weighted by the Total Investment of Each Firm, 1993–2000 (Discount Rate = 0, 0.05, 0.10) *
Discount Rate Median Mean Standard Deviation Minimum Maximum
0 $72 $76 $23 $10 $121
0.05 $66 $67 $18 $10 $103
0.10 $61 $61 $15 $10 $90
* Number of firms: 201; Total Investment: $2,712 million
Table 20: Cost per $1,000 Investment When Discount Rate=0, Weighted by the Total Investment of Each Firm, by Township, 1993–2000 *
Township (Minimum Average Wage Requirement)
Sum of Investment
(Million $)
No. of Firms Median Mean Standard
Deviation
Minimum Maximum
Center($10.45) 731.5 80 $87 $91 $25 $35 $121
Warren ($12.10) 658.1 30 $62 $79 $22 $30 $101
Franklin ($13.75) 14.9 5 $79 $74 $8 $60 $79
Wayne ($12.10) 931.8 41 $57 $71 $18 $10 $89
Lawrence ($15.40) 0.8 1 $61 $61 . $61 $61
Decatur ($13.75) 116.5 2 $60 $60 $4 $60 $79
Washington ($15.40) 9.6 5 $61 $59 $5 $48 $61
Pike ($15.40) 256.8 36 $58 $56 $10 $27 $74
Perry ($13.75) 1.0 1 $55 $55 . $55 $55
* Data in years 1993 and 2000 are not complete.
For comparison purposes, Table 21 lists results of other analyses of cost per job from several previous studies. In general, with its mean at $8,808 per new job, the Indianapolis PTA program was cost effective compared to these cases.13
13 However, when doing this comparison it has to be kept in mind that results generated in this report are an average of about 200 firms with different sizes, while cases in Table 21 were all individual big firms. As they went through the auction-like process to lure the best incentive packages from multiple states, they were in a dominant position during the negotiation process. Moreover, this analysis considers only PTA tax savings, while some investment projects, especially the big ones, might have received multiple tax incentives. It would make this comparison more meaningful if there were other comprehensive evaluations of a tax incentive program from other jurisdictions. Unfortunately, there are few such studies.
Table 21: Cost Per Job Evaluation from Previous Research
Year State Business Total Incentives Incentives Per Job
1978 Pennsylvania Volkswagon $71 million $ 11,800
1981 Tennessee Nissan n/a $ 11,000
1985 Tennessee Saturn n/a $ 26,000
1985 Kentucky Toyota $150 million $ 50,000
1991 Indiana United Airlines $291 million $ 50,000
1993 Alabama Mercedes $300 million $200,000
n/a Kentucky n/a $140 million $350,000
Sources: Fisher (1996, p. 673); Brace (1997); Nunn, Klacik, and Schoedel (1996).
The Quality of The Jobs Created is an Important Consideration
In addition to the cost effectiveness of tax incentives in generating or keeping jobs, another important concern is the quality of those jobs.
While there are several possible measurements for the quality of jobs, the only variable available in this analysis is the average wage rate. The average hourly wages offered by companies receiving these PTAs have been increasing consistently since 1994 (Table 22).
The substantial increase in wages evident in 1998 and 1999 was because of several large projects that generated thousands of high- paying jobs.
Table 22: Mean of the Estimated Hourly Wage Rate for PTA-receiving Companies, Indianapolis, 1994–99 (Weighted by Number of Jobs)
Year New Jobs Retained Jobs
1994 $10.80 $17.32
1995 10.87 13.31
1996 13.00 18.88
1997 15.46 15.57
1998 18.19 20.57
1999 22.45 30.38
PTA-recipients located in wealthy townships generally were paying higher wages, such as those in Washington, Lawrence, Pike, and Decatur (Table 23). However, one surprising finding in this township comparison is that the employers in Center Township were paying the highest wages in Indianapolis. To understand this seemingly unusual finding, we have to break up the numbers over time. As shown in tables 24 and 25, companies awarded PTAs in Center Township usually did not offer high-paying jobs prior to 1999. The big jump in hourly wages by about $20 in 1999 was mainly due to the thousands of new and retained high-paying jobs promised in the Lilly project.