The importance of REDD+ was also clearly reflected in the document of the 1st Indonesian Nationally Determined Contribution (NDC), while REDD+ is an important component and the backbone of land use and forestry sector to achieve the NDC target. The importance of REDD+ is clearly reflected in the document of the 1st Indonesian National Determined Contribution (NDC), where REDD+ is an important component and a backbone of land use and forestry sector to achieve the NDC target.
Introduction
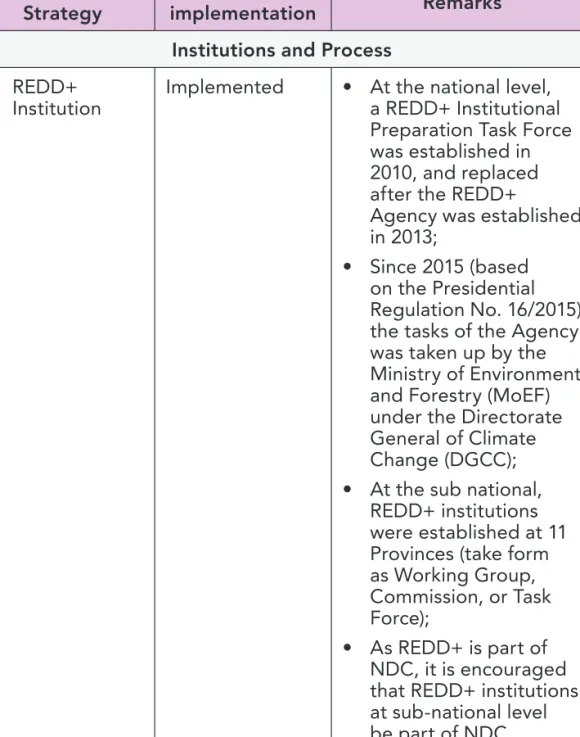
REDD+ National Strategy
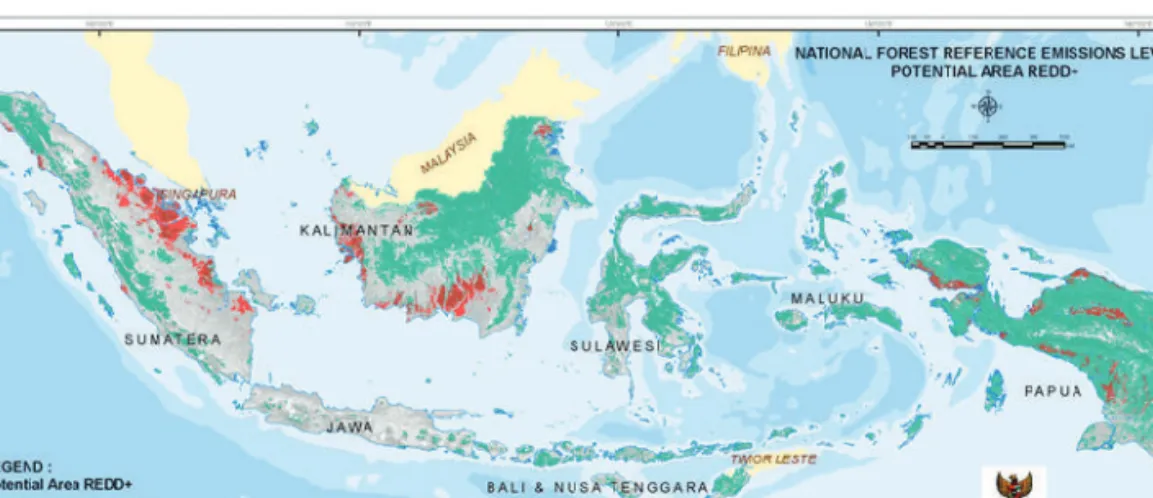
National Baseline
Summary of the FREL Establishment
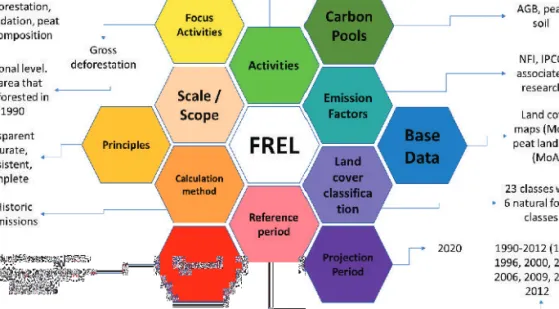
Thus, the term deforestation used in the FREL document (FREL document 2016) is defined as a one-time conversion of natural forest cover to other land cover categories. As Indonesia prioritizes the protection of its tropical natural forests, the REDD scheme considers only "large-scale deforestation". The. Carbon stocks calculated in FREL are only aboveground biomass (AGB) and soil carbon in peatlands.
Thus, the definition of forest defication used in the FREL document (FREL, 2016) leads to a change within a natural forest from undisturbed/primitive forest to disturbed/degraded/secondary forest. The definition refers to a working definition related to the practicality, simplicity and clarity of the data used (land cover class identification and classification processes); This is an area that has changed from intact forest to pristine forest, in the sense that it has been fragmented or subjected to forest exploitation, including for the extraction of timber and/or non-timber forest products, which changes the canopy cover and the overall structure of the forest.
Information on the Assessed FREL
At the beginning of period 1, the land cover data were generated with 14 land cover classes (MoFor-NFI, 1996). The activity data, emission factors and procedures for estimating CO2 emissions from peat degradation are the same as in the FREL. Similarly, this report analyzed the performance of REDD+ in Indonesia using the same methods as in the FREL development.
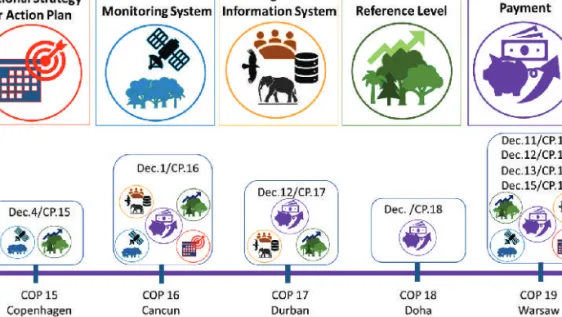
Indonesia is working on improving the methodology for activity data to reduce uncertainties and include emissions from peatland fires in the FREL. National Forest Reference Emission Level for Deforestation and Forest Degradation: In the context of Decision 1/CP.16 para 70 UNFCCC (Encourage developing country parties to contribute to mitigation actions in the forest sector).
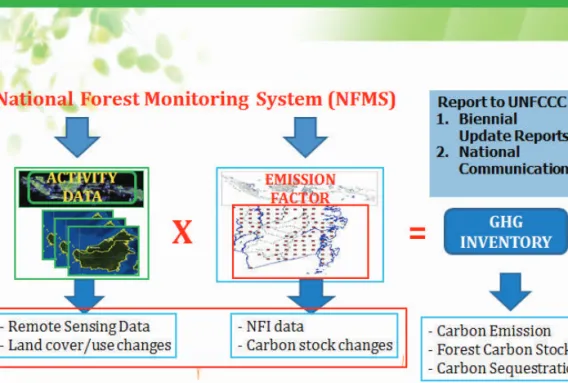
Robust National Forest Monitoring System
Design of NFMS
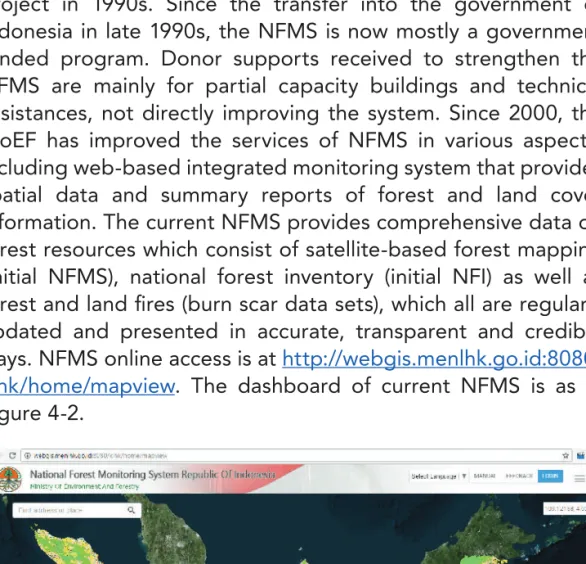
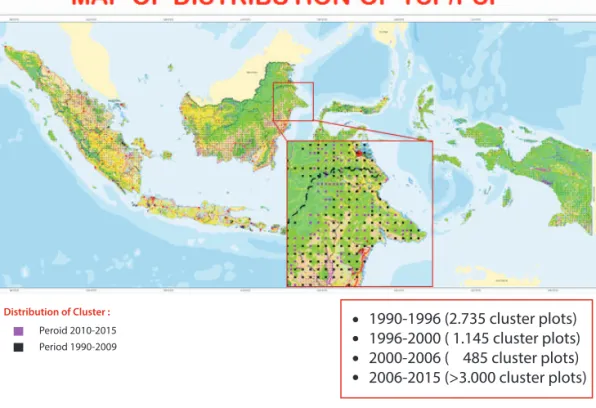
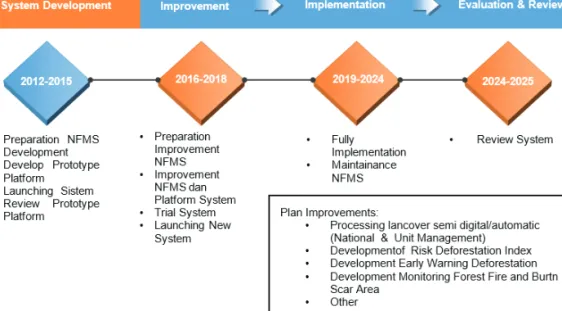
Indonesia's forest resource monitoring system was initiated in 1986, coinciding with the initiation of the NFI program supported by the Food and Agriculture Organization (FAO). The initial NFI has built a substantial foundation for the establishment of a system to monitor Indonesia's forest resources, which consists of four main components: (a) forest resource assessment (status); b) monitoring of forest resources (amendment); c) geographic information system (GIS); and (d) user involvement (MoFor-NFI, 1996; . Sugardiman in Mora et.al, 2012). Since the transfer to the Government of Indonesia in the late 1990s, the NFMS is now mostly a government-funded program.
Donor support received for strengthening the MFMS is mainly for partial capacity building and technical assistance, not for direct improvement of the system. NFMS became the only provider of wall-to-wall spatial land cover and time series data for Indonesia.
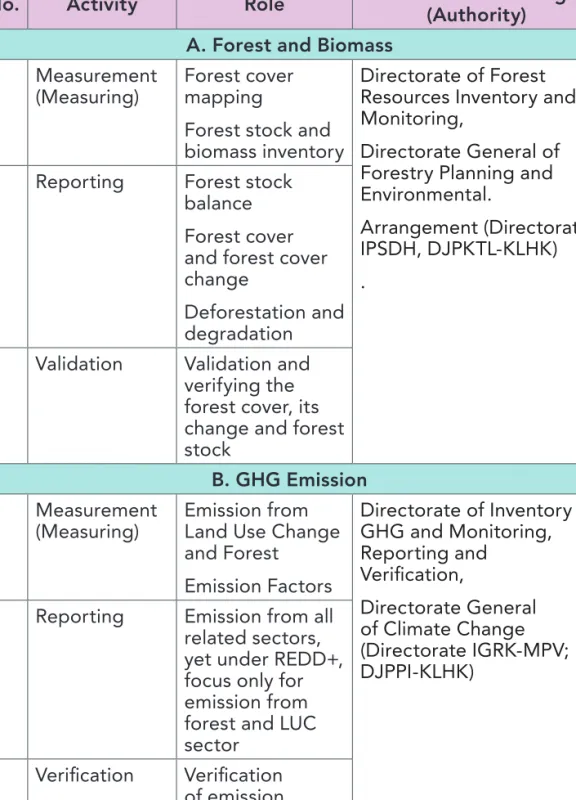
NFMS: the Institutional roles
The forest inventory subunit is responsible for terrestrial plot measurements, including providing data sources for calculation of emission factor for each land cover class. The forest monitoring sub-unit performs the satellite-based land coverage and changes mapping regularly. Arrangement between the Directorate for Forest Resource Inventory and Monitoring, the Directorate General for Forestry Planning and the Environment.
Finally, IPSDH is responsible for quality control/quality assessment (QA/QC) and integration of land cover maps produced by BPKH. In addition, the integrated land cover map will contribute to the national geodatabase at (http://tanahair.indonesia.go.id/portal) to support the One Map Policy coordinated by BIG.
Continuous Improvement of Land Cover Mapping
During this period, due to limited availability of satellite images, the land cover maps were generated only every five and six years, ie. in period 2, new Indonesia land cover classes with 23 classes were finally generated, considering more classes than the previous ones. map (MoFor, 2003) (See Box 4.1). Taking advantage of data abundance, started in 2011 (Period 3), Indonesia has improved the frequency of land cover mapping to annual basis.
During periods 4 and 5, very high resolution images (SPOT 5 and SPOT 6) were added to the system to provide better interpretation of land cover and mapping of burn scars. During the delineation process, several sets of ancillary data (including concession boundaries, both logging and plantation, forest land use boundary) were used to provide additional information valuable for land cover type classification.
Improvement of Peat Fire Data
Since the beginning of 2017 (Period 5), the MoEF is able to generate maps of burn scars on a monthly basis, which can be effectively used for planning purposes, fire prevention, mitigation measures, emissions monitoring as well as forest restoration. This means that areas with recurring fires, especially within peatlands, must use a smaller emission factor. For Indonesia, it is unfortunate that the areas with recurrent fires are not yet available, so only one peat fire emission was used for calculation for all of Indonesia, regardless of first fire occurrence or recurrent fires.
However, several unpublished studies conducted by the Ministry of Agriculture of Indonesia even report a relative average burning depth of 5 cm. Different information on the depth of peat burning gives a high uncertainty of peat fire emissions in Indonesia.
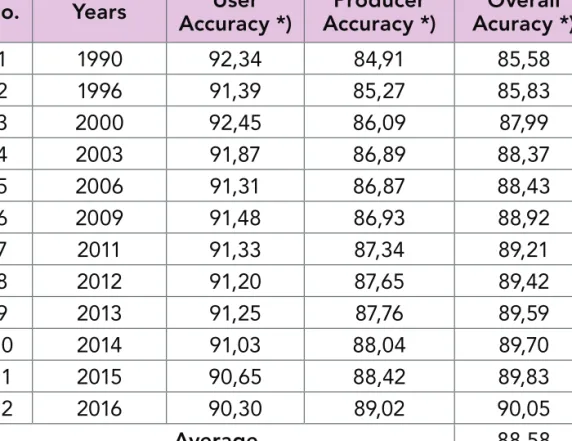
Quality assessment for the NFMS
Indonesia's MRV scheme for REDD+ officially, as stated earlier, presented in the Annex of the Ministerial Regulation on Guidelines for REDD+ Implementation in Indonesia (Ministerial Regulation No. 70/2017). In accordance with Law 23/2014, the provincial level plays a decisive role in planning, implementing and ensuring the integration of regional development. The equation provides a more realistic baseline emission projection from peat decomposition and will therefore be proposed and submitted in the next FREL submission.
The success of the REDD+ implementation in Indonesia, as shown in the emission reduction results explained in the earlier chapters and in accordance with the submission of national FREL, is also the result of policy interventions. National Forest Reference Emission Level for Deforestation and Forest Degradation: In the context of Decision 1/CP.16 para 70 UNFCCC (Encourage developing country parties to contribute to mitigation actions in the forest sector): Post-technical assessment by UNFCCC.
Safeguards Information System (SIS)
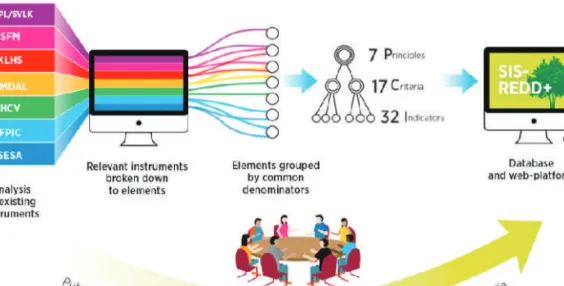
Development of Principle, Criteria, and Indicator (PCI)
The formulation of the PCI was carried out through extensive consultation with safeguards and REDD+ stakeholders to obtain technical and regulatory input to ensure that the PCI fits the Indonesian context. This resulted in several revisions to the initial design, such as combining existing elements and mapping them back to the PCI framework. SIS-REDD+ Indonesia has evolved from PCI as a database on the implementation of the 7 Cancun Safeguards into an online platform.
Two simultaneous public consultation processes for the development of the PCI and the development of the SIS-REDD+ Indonesia web-. MoFor then (now MEF) formulated the Measures Implementation Assessment Tool (APPS in Indonesian) according to the principles of simplicity, transparency, accountability, completeness and comparability.
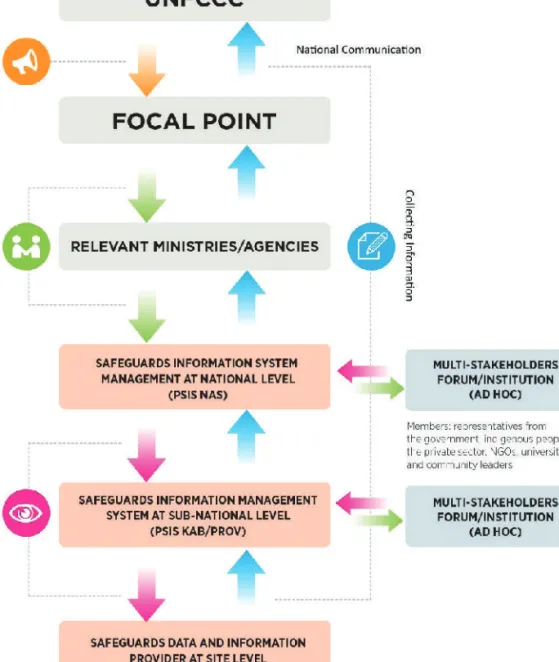
Institutional Structure and Information Flow in SIS
It is important to note that the management agencies and safeguards information system on REDD+, both at the subnational and national level, do not necessarily have to be new institutions. The Protection Information Systems Management (PSIS) can also leverage existing agencies and systems by strengthening the capacity and infrastructure needed to effectively implement SIS-REDD+. On the SIS-REDD+ website, REDD+ implementers or users can report their activities by filling in the checklists and uploading the necessary documents required by the APPS.
In the improvement plan for SIS REDD+, the DGCC of MEF is considering the option to link the web-platforms with other forest instruments that have protective elements important for REDD+. The website is designed not only to provide information on the implementation of safeguards under REDD+, but also data on REDD+ activities, such as project names, locations, implementers, partners, duration and scope of activities.
Operationalization of the SIS-REDD+
Transparency Frameworks
MRV Scheme for Indonesia REDD+
- Finance for REDD+
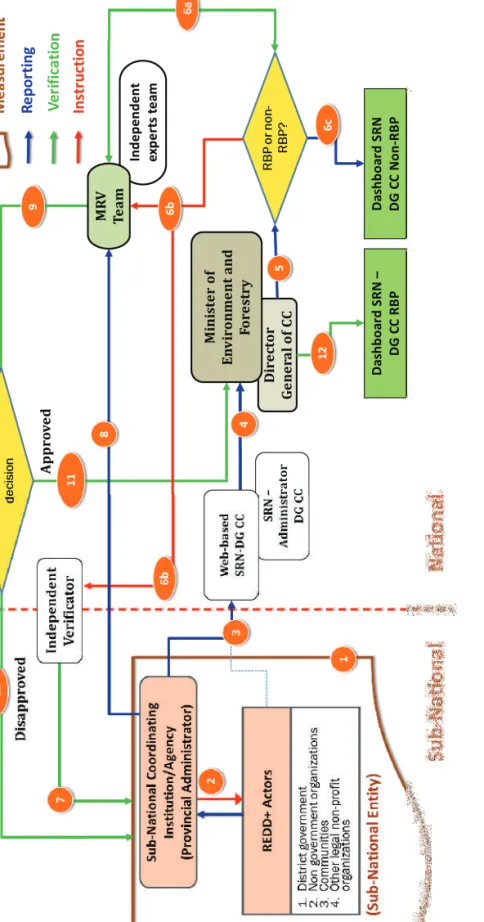
The MRV scheme for REDD+ uses concept of "National approach with sub-national implementation." Under such an approach, Indonesia is introducing the use of FREL Sub-nationally. Under the first scheme, the MRV of REDD+ starts at the subnational level at the process of "measurement" by REDD+ actors (1) and at their project site level (2). The REDD+ actors will simultaneously report to the MRV team of DGCC (8) for further assessment if necessary, as well as for approval (9).
The second scheme shows the multiple roles of the REDD+ coordinating institution/agency at the provincial level to coordinate and promote REDD+ actors in their area of jurisdiction. For this, REDD+ actors submit implementation reports to the REDD+ coordination institution/agency at the provincial level (2), which are recorded and further registered in the SRN at the provincial level (3).
National Registry System
Emission Reduction Results
Emissions Reduction from Deforestation and Forest
Emissions reduction from peat decomposition
Aggregate Emission Reduction
Plans for Improvement and Support Needs
Progress to date towards REDD+ Implementation
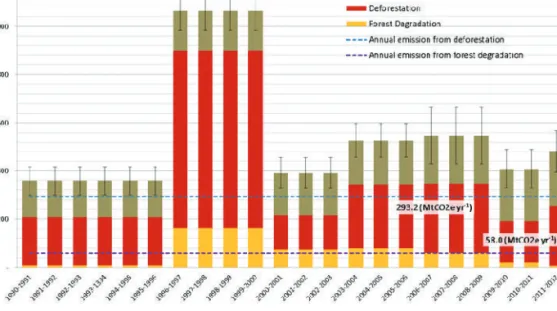
During the implementation period in 2013-2017, Indonesia reduced emissions from deforestation and forest degradation by 20.4%, or 10.4% if peat degradation is included. The total emissions from deforestation, forest degradation and peat degradation combined from period 2012-2013 to 2016/2017 are 299 MtCO2 from all proposed activities or 259 MtCO2 excluding peat degradation, both of which values with and without our peat degradation emissions are still lower than baselines. In contrast, deforestation and forest degradation contributed to the actual reduction in emissions in the period 2016-2017, significantly given the reduced fire event in the period.
On the other hand, peat decomposition alone contributed more emissions than the baseline, with total additional emissions of 88 MtCO2e or 40 MtCO2e using the old baseline projection or the adjusted projection, respectively. However, the significant reduction in deforestation alone has improved the growth of forest degradation and peat decomposition, respectively, to achieve a total reduction on average below the baseline.
Plans for Improvement
- Technical aspect for continuing REDD+
- Policy aspects for REDD+ implementation
However, further assessment of the accuracy of existing research should be done before integration into the national database. There are several policies adopted in Indonesia that have positively impacted emissions reduction efforts in the forestry sector and other land-based sub-sectors. The continued implementation of these policies will be important to improve mitigation actions in the forest and peat sectors, thereby improving the emission reduction performance of the REDD+ program in Indonesia.
Continued implementation and enforcement of policy reforms will also help increase the country's ambition in setting its national emissions reduction target. Following the issuance of Government Regulation 46/2017 on the economic instrument for the environment as the legal basis for the establishment of the BPDLH, a financial institution will soon be established to manage the financing of environmental management.
Support Needs
In addition, near-real-time monitoring of deforestation, forest degradation and peatland drying is critical to halting further emissions. Technology and knowledge transfers are the key to successful forest monitoring and REDD+ implementation in the future, which will upgrade data sources and develop new methods integrated with existing NFMS. Derivation of burn scar depth and estimation of carbon emissions with LIDAR in an Indonesian peatland.
Mapping and monitoring deforestation and forest degradation in Sumatra (Indonesia) using Landsat time series data sets from 1990 to 2010. Mora B, Herold M, De Sy V, Wijaya A, Verchot L and Penman J (eds): Capacity development in national forest monitoring : Lessons learned and progress for REDD+.
Bibliography