Environmental Protection Agency Science to Achieve Results (STAR) Estuarine and Great Lakes (EaGLe) program with funding from the Atlantic Slope Consortium, USA The ASC Synthesis Report and accompanying CD detail the findings of the Atlantic Slope Consortium project to develop ecological and socioeconomic indicators that describe state of water resources in the mid-Atlantic region.
SUMMARYSUMMARYSUMMARY
EPIL EPIL
LITERA LITERA
ATLANTIC SL ATLANTIC SL
THESES AND DISSERT THESES AND DISSERT
LIST OF APPENDICESLIST OF APPENDICESLIST OF APPENDICES
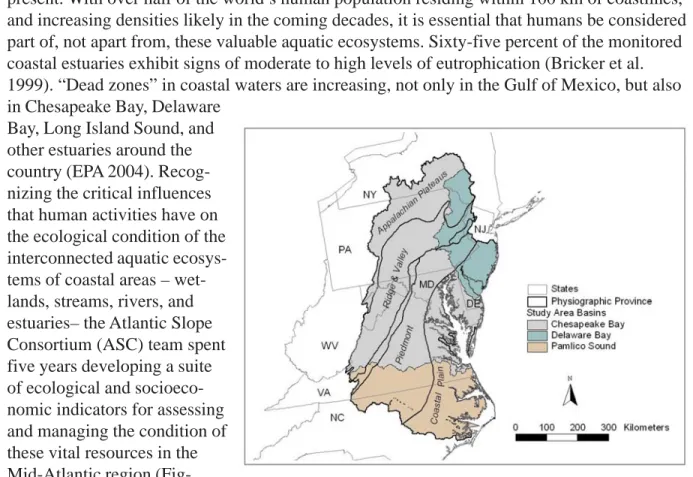
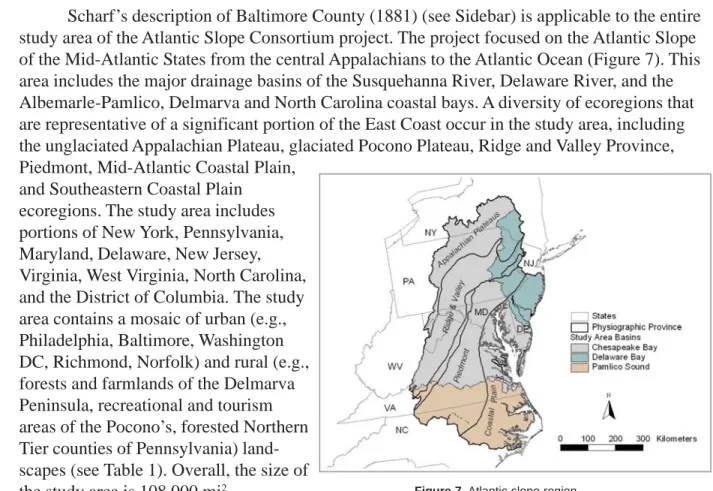
Scharf's description of Baltimore County (1881) (see sidebar) applies to the entire study area of the Atlantic Slope Consortium project. Development, Testing, and Application of Ecological and Socioeconomic Indicators for Integrated Assessment of Atlantic Slope Aquatic Ecosystems in the Mid-Atlantic States.
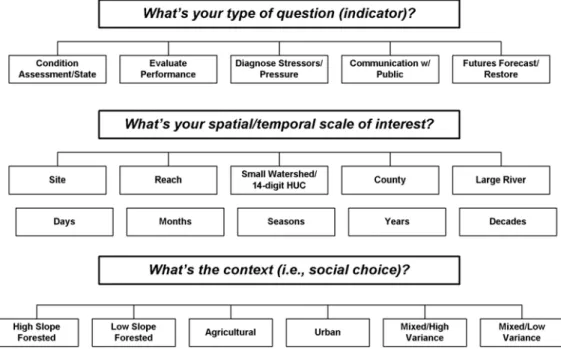
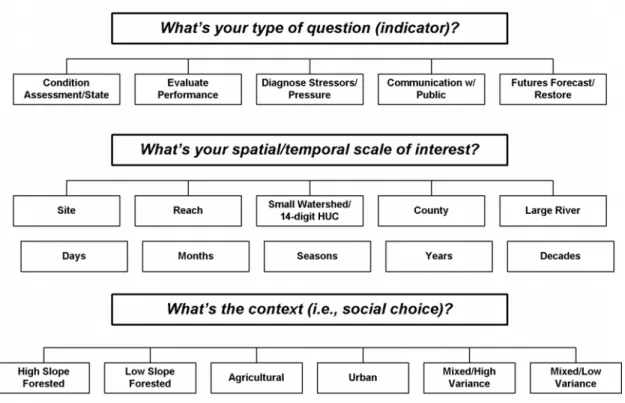
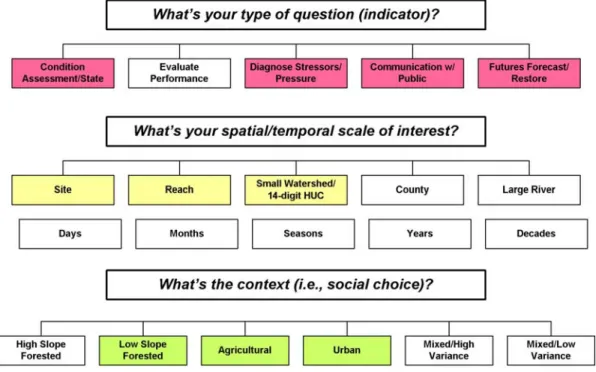
S PATIAL AND T EMPORAL S CALE
These indicators could then be used to predict future biotic responses to a given coastal state scenario.
C ONTEXT OF THE Q UESTION
Scientists from the Smithsonian Environmental Research Center (SERC) and the Virginia Institute of Marine Science (VIMS) selected the estuary segments primarily based on land use patterns. In some cases, the indicators responded to land use patterns only at the watershed level.

BLBLBL
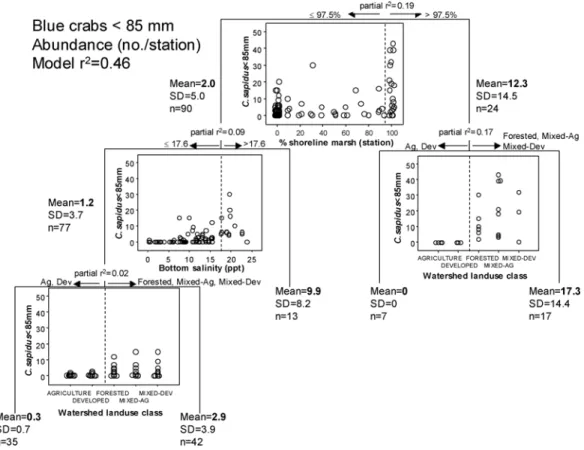
BL BLUE CRAB AND BIV UE CRAB AND BIV UE CRAB AND BIV UE CRAB AND BIVAL UE CRAB AND BIV AL AL ALVE ABUNDANCE AL VE ABUNDANCE VE ABUNDANCE VE ABUNDANCE VE ABUNDANCE
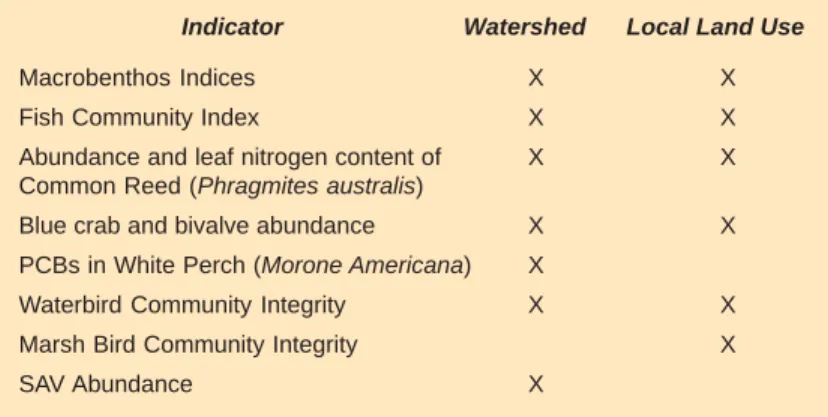
Within habitat characteristics (salinity, shoreline condition, substrate type, abundance of wetlands) are important factors influencing the occurrence of blue crabs and mussels. The use of blue crabs and mussels within the framework of ASC indicators can be found in Appendix A.
ABUNDANCE AND LEAF NITROGEN CONTENT OFABUNDANCE AND LEAF NITROGEN CONTENT OFABUNDANCE AND LEAF NITROGEN CONTENT OF
Land use can therefore be used as an indicator of estuarine status, but the target organisms (blue crabs and mussels) can also be monitored to monitor conditions in subestuarine habitats.
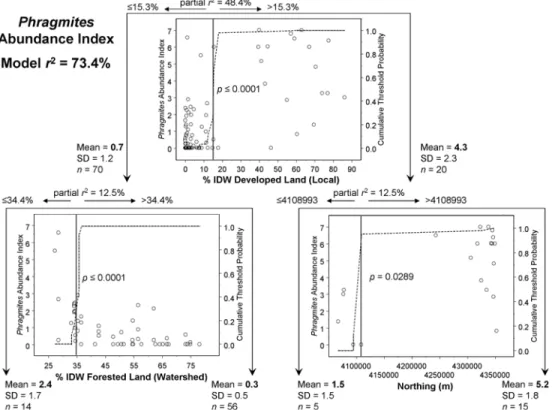
COMMON REED ( COMMON REED (
The vertical line in each graph identifies the value of the predictor (x) that best explained N in leaves of Phragmites. The vertical line in each graph identifies the value of the predictor (x) that best explained the variation in Phragmites abundance.
MACROBENTHOS INDICESMACROBENTHOS INDICESMACROBENTHOS INDICES
The addition of coastline land use information improved the discriminative ability of the indices in a given landscape. The integration of shoreline and watershed land-use measures with macrobenthos indices can lead to practical management tools with particular application at small watershed scales.
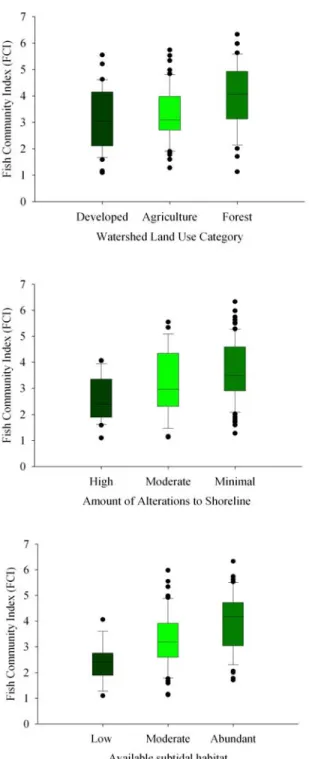
FISH COMMUNITY INDEX (FCI)FISH COMMUNITY INDEX (FCI)FISH COMMUNITY INDEX (FCI)
Fish Community Index (FCI) scores were significantly lower in developed and agricultural catchments than in forest-dominated catchments (Figure 16, top), and negative impacts were associated with local land-use patterns and riparian habitat conditions. The connections between habitat conditions were substantiated in the relationships between the subtidal habitat and the state of the river bank, as well as the coastal and neighboring watershed uses.
MARSH BIRD COMMUNITYMARSH BIRD COMMUNITYMARSH BIRD COMMUNITY
The dominant land use in watersheds was reflected in shoreline land use conditions for all three categories (developed, agricultural, forested) (Figure 18). These measurements can be used as indicators of estuarine status, in addition to the biological functional response as reflected in the FCI.
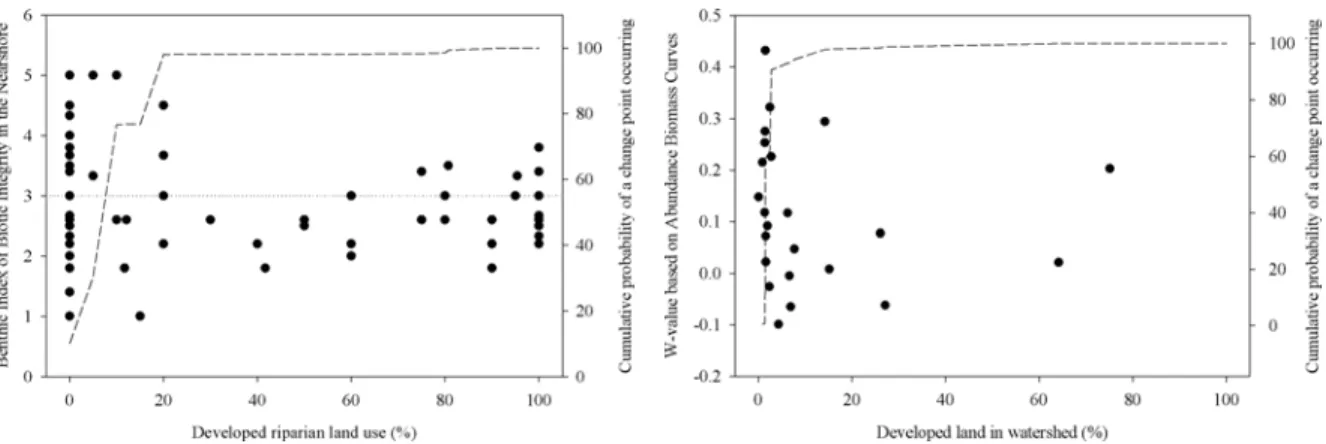
INTEGRITY INTEGRITYINTEGRITYINTEGRITY
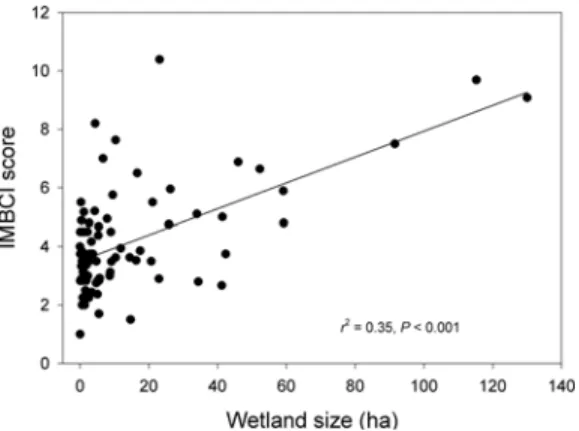
The change points identified in this study represent ecological thresholds, above which the ecological integrity of the marsh bird community and potentially the entire marsh ecosystem is significantly compromised. We have shown that the IMBCI is a reliable indicator of the integrity of the wetland bird community and can help assess the integrity of the entire wetland ecosystem.
WAWAWA
These relationships were only identified at relatively local scales (500 m and 1000 m buffers), so it appears that local land cover is the best predictor of swamp ecosystem integrity. Furthermore, our results indicate that developed land use is the most important stressor for wetland bird communities in the Chesapeake Bay.
WA WATERBIRD COMMUNITY INTEGRITY TERBIRD COMMUNITY INTEGRITY TERBIRD COMMUNITY INTEGRITY TERBIRD COMMUNITY INTEGRITY TERBIRD COMMUNITY INTEGRITY
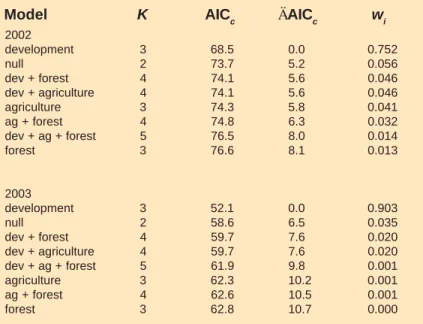
While overall development increased, IWCI scores decreased significantly at the watershed, IDW, and 500 m scales in 2002 and 2003 (Table 6). Increasing urban land cover also led to lower IWCI scores in 2002 and 2003 at the watershed scale, however, the relationship between IWCI scores and the IDW and 500 m scales was not linear.
PCBS IN WHITE PERCH (PCBS IN WHITE PERCH (PCBS IN WHITE PERCH (
A compromised waterfowl community at the top of an estuarine food web can have significant ecosystem-wide implications through altered top-down food web relationships and controls (Baird et al. 2004).
PCBS IN WHITE PERCH ( PCBS IN WHITE PERCH (MORONE AMERIC MORONE AMERIC MORONE AMERIC MORONE AMERICANA MORONE AMERIC ANA ANA ANA))))) ANA
All unweighted measures of developed land use were significant predictors of t-PCBs in white perch, explaining 51% to 69% of the variance among the 14 estuary segments. All land use classes remained significant predictors of t-PCB using a reduced (n=12) set of observations.

BIO-OPTICAL INDICABIO-OPTICAL INDICABIO-OPTICAL INDICA
BIO-OPTICAL INDICA BIO-OPTICAL INDICATTTTTORS ORS ORS ORS ORS
Weller et al. 2003) and available data on the physical, chemical, and biotic condition of streams from the Maryland Biological Stream Survey (cite them). Similarly, the amount and spatial arrangement of developed soil (or impervious surface) significantly affect the response thresholds of stream macroinvertebrate communities (King et al. 2005, manuscript in preparation).
INVERSEINVERSEINVERSE
We identified a number of spatial challenges that arise in relating land cover to stream responses and presented statistical methods to overcome those challenges (King et al. 2005). Our analyzes show that both the amount and spatial arrangement of agricultural land and development in a watershed can have a significant impact on nutrient discharges (King et al. 2005, manuscript in preparation).
INVERSE INVERSE-DIST -DIST -DIST -DISTANCE WEIGHTED CROPLAND -DIST ANCE WEIGHTED CROPLAND ANCE WEIGHTED CROPLAND ANCE WEIGHTED CROPLAND ANCE WEIGHTED CROPLAND Background
Analyzes incorporating these metrics show that river buffer configuration is correlated with reduced nutrient discharge in some but not all provinces within the Chesapeake Bay watershed (Baker et al. in preparation). In one application, cropland distance weighting improved predictions (higher r2) of stream nitrate concentrations measured in the Maryland Biological Stream Survey for small coastal common watersheds (<600 ha or 1,500 ac), but not for larger watersheds (King et al. 2005).
INVERSE INVERSE-DIST -DIST -DIST -DISTANCE WEIGHTED DEVEL -DIST ANCE WEIGHTED DEVEL ANCE WEIGHTED DEVEL ANCE WEIGHTED DEVELOPED LAND ANCE WEIGHTED DEVEL OPED LAND OPED LAND OPED LAND OPED LAND Background
Scatter plots of the threshold effect of developed land on macroinvertebrate assemblage composition (Bray-Curtis dissimilarity expressed as non-metric multidimensional scaling [nMDS]. Samples within the watershed-scale threshold zone of 21–32% developed land in panel ( A) are highlighted in black in panels (A)-(C).
![Figure 24. Scatterplots of the threshold effect of developed land on macroinvertebrate assemblage composition (Bray-Curtis dissimilarity expressed as nonmetric multidimensional scaling [nMDS] Axis 1 scores)](https://thumb-ap.123doks.com/thumbv2/123dok/11200423.0/61.918.485.798.125.740/scatterplots-threshold-developed-macroinvertebrate-assemblage-composition-dissimilarity-multidimensional.webp)
SOURCESOURCE
SOURCE-----SPECIFIC MEAN RIP SPECIFIC MEAN RIP SPECIFIC MEAN RIP SPECIFIC MEAN RIPARIAN BUFFER WIDTH SPECIFIC MEAN RIP ARIAN BUFFER WIDTH ARIAN BUFFER WIDTH ARIAN BUFFER WIDTH ARIAN BUFFER WIDTH Background
Source-specific mean riparian buffer width considers only that part of the riparian system that is likely connected to a source area and then integrates the buffer potential along the likely flow lines from source areas to streams. This indicator is derived from the combination of measurements on the characteristics of the riparian buffer along the source-to-stream transects (Lowrance et al. 1997).
STREAMSTREAMSTREAM
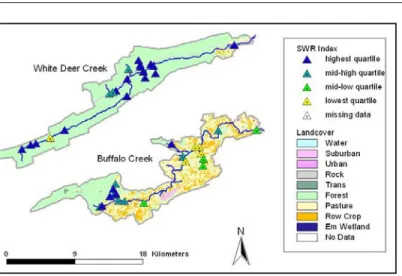
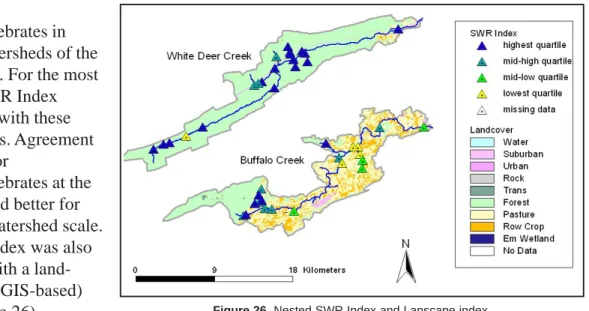
For sites where we had Tier 2 and Tier 3 measurements, we found a highly significant correlation between the SWR Index and benthic IBI, but the correlation with fish IBI was weaker and the correlation with NO3 was very weak. Although the correlation with benthic IBI was somewhat weaker than the site-by-site comparison, the relationships of the SWR Index with fish and nitrate were strengthened.
SPOSPOSPO
Since their development, both the SWR Index and the Landscape Index have been incorporated into the monitoring programs of specific units of the National Park Service and the State of North Carolina.
SPO SPOT SAMPLED AVERAGE STREAM NITRA T SAMPLED AVERAGE STREAM NITRA T SAMPLED AVERAGE STREAM NITRA T SAMPLED AVERAGE STREAM NITRATE CONCENTRA T SAMPLED AVERAGE STREAM NITRA TE CONCENTRA TE CONCENTRA TE CONCENTRA TE CONCENTRATION TION TION TION TION Background
The high level of agreement between intensive automated stream sampling and stream nitrate sampling provides confidence that this indicator is reliable. Because of the cost savings, the approach can be applied to many more streams and ranges, thereby improving the effectiveness of water quality monitoring programs.
BEABEABEA
BEA BEAVER IMPOUNDMENT PRESENCE VER IMPOUNDMENT PRESENCE VER IMPOUNDMENT PRESENCE VER IMPOUNDMENT PRESENCE VER IMPOUNDMENT PRESENCE Background
The ASC included the human dimension because we think it is critical to understand and resolve conflicts between social choices (land uses) and societal choices (designated uses). Choices about types of indicators, the scales at which they are collected, and the precision with which they are measured should be guided by the value of the information for management relative to the cost of developing and maintaining the indicators.
DESIRED CHARACTERISTICS AND USE OF INDICADESIRED CHARACTERISTICS AND USE OF INDICA
DESIRED CHARACTERISTICS AND USE OF INDICATTTTTORS ORS ORS ORS ORS Background
Each official and agency involved in indicator development had specific objectives for indicator application. A range of indicators increases the ability of officials to use a variety of different formats and approaches for communicating with stakeholders.
DESIGNING ENVIRONMENTDESIGNING ENVIRONMENTDESIGNING ENVIRONMENT
Development and use of indicators was most successful when there was an ongoing dialogue between scientists, managers and stakeholders, and when all parties involved in water resource issues worked to communicate their data and knowledge in creative and audience-specific ways. Suite of indicators that not only describe condition but also help to diagnose the underlying factors or stressors that contribute to that condition should be provided to managers.
DESIGNING ENVIRONMENT DESIGNING ENVIRONMENTAL INDICA AL INDICA AL INDICA AL INDICA AL INDICATTTTTOR SYSTEMS FOR PUBLIC OR SYSTEMS FOR PUBLIC OR SYSTEMS FOR PUBLIC OR SYSTEMS FOR PUBLIC OR SYSTEMS FOR PUBLIC DECISIONS
DECISIONS DECISIONSDECISIONSDECISIONS
Similarly, small headwater stream indicators may not be appropriate for assessing conditions in the Susquehanna River. The delivery system must be able to provide clearly understood and interpretable information where and when it is needed in the decision-making process.
A NEW “A NEW “A NEW “
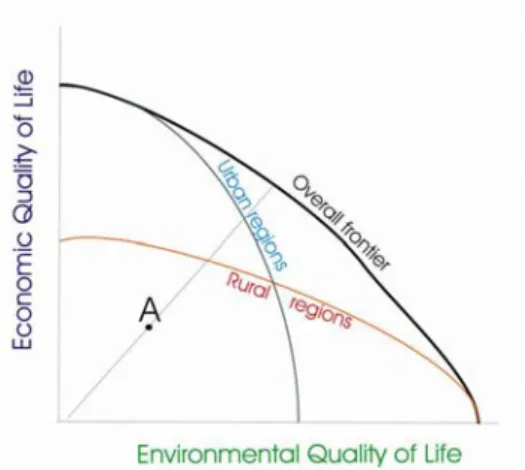
A NEW “ A NEW “FRONTIER FRONTIER FRONTIER FRONTIER FRONTIER” FOR ANAL ” FOR ANAL ” FOR ANAL ” FOR ANALYZING ENVIRONMENT ” FOR ANAL YZING ENVIRONMENT YZING ENVIRONMENT YZING ENVIRONMENT YZING ENVIRONMENTAL AND AL AND AL AND AL AND AL AND SOCIOECONOMIC INDICA
SOCIOECONOMIC INDICA SOCIOECONOMIC INDICA
SOCIOECONOMIC INDICA SOCIOECONOMIC INDICATTTTTORS ORS ORS ORS ORS Background
DEA provides estimates of how a country performs with respect to a theoretical maximum frontier in manufacturing quality of life in the Mid-Atlantic Region (Figure 28). VEA produced a wide range of value-effectiveness in the quality of life for Mid-Atlantic counties (Figure 27).

HUMAN PERCEPTIONS VERSUS SCIENTIFIC ASSESSMENTSHUMAN PERCEPTIONS VERSUS SCIENTIFIC ASSESSMENTSHUMAN PERCEPTIONS VERSUS SCIENTIFIC ASSESSMENTS
AQUAAQUAAQUA
AQUA AQUATIC ECOSYSTEMS AND QUALITY OF LIFE TIC ECOSYSTEMS AND QUALITY OF LIFE TIC ECOSYSTEMS AND QUALITY OF LIFE TIC ECOSYSTEMS AND QUALITY OF LIFE TIC ECOSYSTEMS AND QUALITY OF LIFE Background
For each watershed, the average stated willingness to pay (WTP) per month per household for water quality improvements that would affect 10% of streams in the watershed was estimated. Out of 9 watersheds, respondents in 6 watersheds indicated that runoff from development is the greatest threat to water quality.
VALVALVAL
Willingness to pay values for the Klein Contentnea were not significantly different from zero. There is an apparent relationship between citizens' willingness to pay to maintain or improve water resources in better quality watersheds.
VAL VALUA UA UA UA UATION OF INFORMA TION OF INFORMA TION OF INFORMA TION OF INFORMA TION OF INFORMATION INVESTMENTS TION INVESTMENTS TION INVESTMENTS TION INVESTMENTS TION INVESTMENTS Background
The public may be more willing to pay to conserve water resources after restoring or improving the quality of those resources. The expected value of information tools can contribute to the selection of indicators used in the decision-making process.
EPILEPILEPIL
EPIL EPILOGUE OGUE OGUE OGUE OGUE
LITERALITERALITERA
LITERA LITERATURE CITED TURE CITED TURE CITED TURE CITED TURE CITED
2004) Influence of land use on the integrity of wetland bird communities of the Chesapeake Bay, USA. Using landscape and land use parameters for classification and characterization of Mid-Atlantic watersheds in five physiographic provinces.
ATLANTIC SLATLANTIC SLATLANTIC SL
ATLANTIC SL ATLANTIC SLOPE CONSORTIUM OPE CONSORTIUM OPE CONSORTIUM OPE CONSORTIUM OPE CONSORTIUM RESEARCH MEETINGS
RESEARCH MEETINGS RESEARCH MEETINGSRESEARCH MEETINGS
THESES AND DISSERTTHESES AND DISSERTTHESES AND DISSERT
THESES AND DISSERT THESES AND DISSERTA AA AATIONS TIONS TIONS TIONS TIONS
AA AATLANTIC SL TLANTIC SL TLANTIC SL TLANTIC SL TLANTIC SLOPE CONSORTIUM - PUBLICA OPE CONSORTIUM - PUBLICA OPE CONSORTIUM - PUBLICA OPE CONSORTIUM - PUBLICA OPE CONSORTIUM - PUBLICATIONS TIONS TIONS TIONS TIONS
Watershed land use is strongly associated with PCBs in white bass in the Chesapeake Bay subestuaries. Ecosystem health and its measurement at the landscape scale: towards the next generation of quantitative assessments.