The Effect of Room Volume on Speech Recognition in Enclosures with Similar Mean Reverberation Time
By Jason A. Galster
Dissertation
Submitted to the Faculty of the Graduate School of Vanderbilt University
in partial fulfillment of the requirements for the degree of
DOCTOR OF PHILOSOPHY In
Hearing and Speech Science December, 2007 Nashville, Tennessee
Approved:
Todd A. Ricketts Ph.D.
D. Wesley Grantham Ph.D.
Benjamin W. Hornsby Ph.D.
Kenneth A. Cunefare Ph.D.
To my mother, Connie, eternally supportive and resourceful and
Elizabeth, the love and true joy of my life
TABLE OF CONTENTS
Page
DEDICATION………….………ii
LIST OF TABLES………..………..……...…v
LIST OF FIGURES………...……….vi
CHAPTER I. INTRODUCTION.……….……….6
Sound Propagation in a Closed Space……….…....9
Prediction of the Effects of Room Acoustics on Speech Recognition…….…..…12
II. LITERATURE REVIEW………..18
Performance Expectations of Normal-Hearing and Hearing-Impaired Speech Recognition under Reverberant Listening Conditions………...………18
The Effects of Room Size on Speech Recognition…..………..22
Research Hypotheses………..……….………….…….…28
III. RESEARCH METHODS………..……..29
Methodology……….….……....29
Participants……….………29
Generation of Test Materials……….………..….……….31
Test Procedures……….….……34
Data Analysis……….……….…...…37
IV. RESULTS..……….38
Speech Recognition Testing……….…….38
The STI as a Predictor of Speech Recognition Performance………41
V. DISCUSSION AND CONCLUSIONS...……….44
General Discussion………44
Prediction of Room Effects using the STI……….47
Potential Factors Underlying the Effect of Room Size……….…….48
Conclusions……….……….……..50
REFERENCES………..……51
LIST OF TABLES
TABLE PAGE 1. Physical and Acoustic Measurements from each test room. Area, Calculated Critical Distance, Measured Critical Distance, Mean Free Path, and Total Room Absorption are provided………...30 2. Mean (500, 1000 and 2000 Hz) and frequency-specific reverberation times (RT) for each test room……….…...30 3. Measured Speech Transmission Index (STI) values in each test room as a function of all Signal-to-Noise Ratio (SNR) conditions………..41
LIST OF FIGURES
TABLE PAGE 1. Average hearing thresholds (dBHL), plotted as a function of frequency (Hz) for the 13 hearing impaired participants……….………..…..29 2. Average deviation from NAL-NL1 target, as a function of frequency (Hz). The largest single deviation from the NAL-NL1 target was 4 dB at 4000 Hz……….…35 3. Average normal-hearing Connected Speech Test (CST) performance in each test room plotted as a function of SNR……….…...………..37 4. Average normal hearing CST performance collapsed across SNR, plotted as a function of room type……….………..38 5. Average hearing-impaired CST performance in each test room plotted as a function of SNR. Error bars show standard error of the mean………..………...………39 6. Average hearing-impaired CST performance collapsed across SNR, plotted as a
function of room type………..…….………..40 7. Average normal-hearing CST performance, plotted as a function of measured STI value………...……..43 8. Average hearing-impaired CST performance, plotted as a function of measured STI value………..……….43 9. Average pilot CST performance with average test performance of the same
participants, in test rooms RC and LH, plotted as a function of SNR………..…….52
CHAPTER I
INTRODUCTION
The acoustic properties of a room are affected by many characteristics of the space, including the room’s volume and the materials within the room. Real-world rooms are of a variety of sizes; this single variation can affect the acoustic properties of the room (Gelfand & Silman, 1979; Lochner & Buger, 1964; Nabelek & Robinette, 1978).
The interaction between room size and acoustics is important because research has shown that room acoustics can have dramatic effects on speech recognition (Lochner & Burger, 1964). There are many factors of room acoustics that are expected to affect speech recognition; however it is common to focus on reverberation. When a sound passes through a room, it is filtered by the room itself. The acoustic alterations applied to any signal as it propagates or is transmitted through a room can be measured or estimated mathematically. The most fundamental of these measures is a room’s reverberation time (RT). Quantified as a measure of level decay, RT is the time required for a signal to decrease in level by 60 dB after its offset (ANSI S1.1-1994 [R1991]). RT can be reported in a number of ways. Frequency-specific RT provides a measure of a room’s sound decay for each measured frequency. More commonly, mean RT is reported, averaging
frequency-specific RT across 500, 1000, 2000, and 4000 Hz (Plomp, 1976) or across 500, 1000, and 2000 Hz (Nabelek & Pickett, 1974a). Peutz (1971) supported the use of mean RT measures stating that, although rooms have frequency-dependent RTs, the RTs at 1000 and 2000 Hz are most representative of how a room affects the integrity of speech
for the purposes of recognition. Increases in RT between 250 Hz and 4000 Hz have been shown to systematically introduce distortion to speech and result in decreased speech recognition ability, under a multitude of listening conditions, environments, and signal- to-noise ratios (SNRs) (Bolt & Macdonald, 1964; Bradley, et al., 1999; Danhauer &
Johnson, 1991; Gelfand & Hochberg, 1976; Helfer & Wilber, 1990; Helfer, 1994;
Houtgast & Steeken, 1971; Irwin & McAuley, 1987; Libby & Rogers, 2004; Lochner &
Burger, 1964; Loven & Collins, 1988; Nabelek & Pickett, 1974a; Nabelek & Mason, 1981; Nabelek & Letowski, 1985; Nabelek, et al., 1989; Peutz, 1971). As a result of its ease of measurement and the predictable relationship between RT and speech
recognition, RT is commonly used to represent the acoustic quality of a room (Bradley, 1999).
It can be assumed that for most rooms, increasing RT will introduce distortion that smears speech and prolongs the duration of speech components, resulting in
decreased speech recognition. Thus, the goal of acoustic design is often to minimize RT, with the expectation that speech recognition will be improved. As a result of these assumptions, as well as of a body of literature supporting decreased speech recognition ability with increased RT, standards have been developed which establish maximum acceptable classroom RTs. One such example is ANSI S12 60-2002 Acoustical Performance Criteria, Design Requirements, and Guidelines for Schools which
recommends a maximum RT for classrooms as a function of classroom size. The standard sets limitations for classrooms < 283 m3 at 0.6 seconds and for classrooms between 283 m3 and 566 m3 at 0.7 seconds. Spaces larger than 566 m3 represent rooms similar to the size of auditoria and are subject to different acoustical expectations. The development of
standards such as ANSI S12 60-2002 reflects the general acceptance that RT is an adequate indicator of how a room’s acoustics will affect speech recognition ability.
Equation 1 describes the calculation of RT. The constant k = 0.161 when the room's volume (V) is in cubic meters and the sound absorption area (A) is expressed in square meters.
A kV
RT = (1).
The total area of sound absorption (A) in the room is calculated using Equation 2. Total sound absorption is determined by the sum of the products of the surface area Si and the sound absorption coefficient (α) for each surface considered in the equation. AR represents any residual sound absorption, such as furniture or curtains.
R i
iS A
S S
S
A=α1 1+α2 2 +α3 3 +...+α + (2).
Absorption coefficients will vary with frequency and are often reported between 125 Hz and 4000Hz. A material’s absorption coefficient represents the sound power that is absorbed (not reflected) by a material. An absorption coefficient of 0.50 indicates that 50 percent of the sound energy that strikes a material is absorbed. Formula 1 shows that a room’s reverberation time is dependent upon its size and reflective characteristics. The contributions of a room’s volume and total sound absorption make it apparent that rooms of different size and total absorption levels may result in similar mean RTs. For instance, a large room with high levels of absorption may yield the same RT as a small room with lower levels of absorption.
While it is apparent that two rooms of different size are capable of having
identical RTs, they may exhibit reverberant and filtering characteristics that are different.
halls can have identical reverberation times, yet sound remarkably different”. Although spaces such as those alluded to by Schroeder may exhibit similar RTs, it is likely that the reflection patterns of each space were different and may have contributed to his
observations. The impact of room factors other than reverberation is of considerable interest because the effect of hearing loss, hearing aid processing, and other factors on speech recognition is often measured in small, highly reverberant rooms (e.g. 2.5 x 2.75 x 1.98 m) with the assumption that this work can be generalized to larger rooms such as classrooms and churches (Cox, 1987; Danhauer and Johnson, 1991; Helfer & Wilber, 1990; Nabelek & Robinette, 1978).
Sound Propagation in Closed Spaces
To understand how room acoustics may affect speech recognition, the
propagation of sound within a room should first be considered. When an acoustic signal is presented into a room, the sound propagation follows two different paths. The first of these is the direct sound propagation. This is the sound that reaches the listener without first contacting any surfaces in the room. The second type of sound propagation, reverberant sound, occurs because sound also contacts surfaces within the room and is then reflected. After a continuous sound source is activated, the number of reflections in a room will grow until a constant number of reflections is reached; this field with an
approximately fixed number of reflections is referred to as the reverberant field. The distance a reflection travels between a room’s walls is quantified through a measure of a room’s Mean Free Path (MFP). This is represented as:
S MFP= 4V (3),
where V is the room volume and S is the room surface area. The calculation of MFP indicates that sound will travel a shorter distance between reflections in a small room than in a large room. In the smaller room, this implies that reflections occur more often, as predicted by the MFP, and less energy is lost in each reflection, yielding a greater number of reflections, over an equivalent amount of time, in the smaller room when compared to the larger room. Based on this relationship, it can be expected that the reverberant field in a small room would inherently contain more reflections, or a denser reverberant field, than that of a larger room.
Not only is the distance sound travels between reflections important, but the distance from a sound source to a listener also plays an important role in the relationship between a direct sound and the reverberant field. As the distance from the sound source increases, the level of the direct sound will decrease (consistent with the inverse square law), while the level of the reverberant sound is comparatively constant. The distance at which the level of the direct signal is equal to that of the reverberant signal is referred to as the critical distance (CD) (Egan, 1988; Peutz, 1971). There are a number of different methods for establishing CD, and one estimate of CD has been proposed by Peutz (1971).
Given that the current investigation aimed to evaluate speech recognition as a function of a room’s acoustics this empirically derived formula was deemed most appropriate.
Formula 4 outlines this calculation of theoretical CD T V
CD =0.20 (4),
where T is the room’s mean RT and V is the volume of the room in m3 (Peutz, 1971).
Specifically, this measure of CD is the distance for which additional increases in distance from a speech sound source no longer affect speech recognition. This method has been
widely accepted for use in existing literature on the topic of speech understanding in reverberant environments (Hawkins & Yacullo, 1984; Leeuw & Dreschler, 1991;
Nabelek & Robinette, 1978; Nabelek & Pickett, 1974(a); Ricketts & Dhar, 1999; Ricketts
& Hornsby, 2003).
The reverberant field refers to the whole of the reflected sound. However, the reflections can be classified by the amount of time that passes between the onset of the direct sound at its source location and the point at which the reflected sound reaches the listener. For example, consider a brief sound impulse. Direct sound arrives first and without reflection. The level of the direct sound is dependent upon the listener’s distance from the source. After a brief delay, the initial reflections of the direct sound will reach the listener’s ears. Subsequent reflections continue to arrive at the listeners ears as time passes. The perception of these reflections will continue until the reflection’s energy dissipates and the sound is no longer audible. The earliest echoes are strongly correlated with the direct signal and effectively increase the level of the direct signal at the position of the listener (Bradley et al., 2003). Echoes occurring later in time, are no longer
correlated to the direct signal and do not benefit the listener. Rather, they prolong the duration of the original signal, causing it to smear, resulting in degradation of speech recognition ability. The exact time delay that defines early and late reflections has been suggested to be as late as 0.095 seconds (Lochner and Burger, 1964), but is more commonly regarded to be within the first 0.050 seconds following direct signal
presentation (Bradley, 1986; Bradley et al., 1999). The preceding description of acoustic propagation through a room encapsulates the transmission of speech as well. However, the fact that speech energy may be continuously produced can result in overlap between
the reflected and direct sound energy of both the same speech sounds and adjacent speech sounds.
Prediction of the Effects of Room Acoustics on Speech Recognition
Two rationales supporting the idea that speech recognition ability will be different in two reverberant rooms with similar RTs have been introduced in the existing literature.
They will be discussed independently then reintroduced as an effect that considers each of the two rationales as a single time-varying factor. The first of these, introduced by Nabelek and Robinette (1978), suggests that observed performance differences may result from a decrease in the time during which early reflections are beneficial to the listener. Recall that reflections reaching the listener within 0.05 seconds of direct signal onset are strongly correlated to the direct signal and improve speech recognition. The decreased distance between reflective surfaces and the decrease in absorption in the smaller room will result in a greater number of reflections in a given period, when compared to a large room, leading to an increase in the rate at which reflections or uncorrelated iterations of the direct signal reach the listener. This causes poorly
correlated reflections to reach the listener an earlier point in time than in a larger room, functionally decreasing the time during which early reflections are most useful to the listener. This hypothesis would predict a decrease in speech recognition with decreasing room size, if RT is held constant.
A second similar rationale was proposed by Gelfand and Silman (1979). The authors suggest that differences in performance may arise from an increase in the number of overlapping reflections, or an increase in the density of reflections, in smaller, more
reflective rooms, when compared to larger, less reflective rooms. For the purpose of this study, a change to the number of overlapping reflections in a reverberant sound field will be referred to as a change in reverberation density. Increasing reverberation density would increase the efficiency of the reverberation as a masker, decreasing modulation and causing it to take on properties more similar to those of a steady-state signal, with a spectrum resembling, although likely not identical, to that of the direct sound.
These rationales suggest that in a small highly reflective room, the period during which early reflections are beneficial will decrease and the reverberant sound field will contain more reflections, effectively decreasing modulation and increasing masking efficiency as the signal becomes more steady-state. The Speech Transmission Index (STI) has been developed for the purpose of predicting the effects of room acoustics on speech recognition (Bifista and Bradley, 2000; Bradley, 1986; Houtgast and Steeneken, 1971, 1973, 1984, 1985; Houtgast et al., 1980; Humes et al., 1986; Humes et al., 1997;
Steeneken and Houtgast, 1980, 1999). Therefore, it is of interest to examine whether the STI would be sensitive to changes in room size. Since its inception, numerous versions of the STI have been proposed, many offering different manipulations of the original
method in order to account for specific changes in environment or listener characteristics.
While each version of the STI serves a specified purpose, they all share a similar theoretical standpoint that compares the differences between two signals. The STI quantifies the difference between these two signals as the room’s modulation transfer function (MTF). The first signal is a known “clean” version and the second is a recorded iteration of the “clean” signal that has been played into a room and recorded. A
comparison can be made between the original and altered signals to derive a measure that
allows for the prediction of speech recognition. The MTF itself, for the purpose of use in the STI, is measured using a random noise that is modulated using pure tones of varying frequencies. Fourteen pure tone frequencies, similar to the range of speech modulation rates (0.63, 0.80, 1.00, 1.25, 1.60, 2.00, 2.50, 3.15, 4.00, 5.00, 6.30, 8.00, 10.00, and 12.50 Hz) are used to modulate the noise. The modulated test signal is analyzed at the location of the listener after being played in a given acoustic condition. The recorded signal is then compared to the original signal to quantify the reduction of the modulation depth. The MTF itself is represented by the modulation reduction factor m and is
determined through the formula
t r
m F m m
MTF = ( )= (5),
where m is the amount of modulation reduction or the modulation reduction factor at a modulation frequency of F, mr is the modulation measured in the recorded signal, and mt
is the modulation of the original signal. The MTF is then measured in seven octave- centered frequency bands (fi) from 125 to 8000 Hz, at each of 14 modulation rates (F), for a total of 98 modulation reduction factors. The seven octave-centered frequency bands are individually weighted to represent the average long term speech spectrum. This ensures that the frequencies most important to speech understanding have the greatest contribution to the calculation of the STI. The original versions of the STI did not use this same method of weighting the analysis bands, but rather a comparatively flat weighting spectrum was initially implemented. Each modulation reduction factor is used to establish an apparent SNR (SNRappi) which is expressed by Equation 6 where m(F) is the
modulation transfer function for a specified modulation rate,
F dB m
F SNRappi m
) ( 1
) log (
10 −
= (6).
At this stage the STI calculation is determined by averaging the 14 SNRappj values within each of 7 octave bandwidths. The SNRappi values are then weighted according to the proportion of the total speech recognition importance of each octave band. The product of these weighted SNR values are then summed to provide a single number ranging from 0 to 1.0, where 0 indicates no speech information is available and 1.0 indicates that all of the speech information is accessible. The STI always assumes a speech dynamic range of
± 15 dB. The equation for the described derivation of the STI is expressed as
30 15
7 1
=
∑
+=
appi i
i
w SNR
STI (7).
A number of studies have compared predicted (based on STI measures) and measured speech recognition abilities. Bradley (1986a) used the STI and
useful/detrimental ratios to predict speech intelligibility in classroom environments. The useful/detrimental ratio is a comparison of sound levels at specific times after a sound is played into a room. Specifically, the ratio of the beneficial early period of reverberant sound and the late reverberant sound is compared. Normal-hearing students in the seventh and eighth grades were evaluated in this study. The Fairbanks Rhyme Test was used to assess speech recognition ability in the classroom. Testing was completed during a school day to ensure that students were exposed to typical classroom noise levels.
Acoustic measures of the occupied classrooms were obtained to support the calculations required for the derivation of the predictive indices. It was determined that both the STI and useful/detrimental ratio offered speech understanding predictions that were highly correlated to the empirical data. The author ultimately advocated the use of the
useful/detrimental ratio as the measure of choice due to its relative ease of acquisition when compared to that of STI measures and the fact that both measures provided acceptably accurate predictions of speech recognition ability.
As early as 1980, work was being done to validate the use of the STI in predicting the speech recognition ability of hearing-impaired listeners (Duquesnoy and Plomp, 1980). Early findings suggested that the STI offered a valid prediction of average speech recognition in normal-hearing and presbycusic populations. Humes and colleagues (1986) followed this work with a retrospective analysis of the accuracy of the STI when
predicting the performance of hearing-impaired listeners. It was found that the effects of temporal distortions in the form of reverberation were well characterized by the STI.
However, in the case of subjects with sloping, high-frequency hearing loss, it was noted that the STI was not an accurate predictor of speech recognition of hearing-impaired listeners. The authors hypothesized that the octave band weighting suggested by the original STI may have resulted in the lack of agreement, specifically because the original version of the STI did not weight its predictions based on frequency-specific
contributions of speech to speech understanding. In an attempt to improve on the accuracy of the original flat-weighting spectrum, a modified version of the STI was proposed by the authors in order to account for changes in signal audibility resulting from the listener’s hearing loss. Once the listener’s hearing loss was allowed for, the modified STI was able to accurately predict changes in performance that resulted from both temporal and spectral distortions in the hearing-impaired listeners. In addition to the findings of Humes and colleagues (1986), there is some data to suggest that changes in performance (as opposed to predictions of absolute performance) by impaired listeners
can be predicted by the STI (e.g. Hohmann & Kollmeier, 1995; Ricketts & Hornsby, 2003).
Two related rationales have been introduced to support the possibility of finding performance differences in two rooms of different size that are matched for mean RT.
Both of these suggest that a small room will generate a denser reverberant field than a large room, when the two are match for reverberation time; this is expected to alter the room’s MTF and should be represented in the final prediction of STI for that room. The larger room would be expected to have a higher STI and the smaller more reflective room a lower STI.
To date, there has not been a systematic investigation of how speech recognition may vary in two rooms of different size that yield similar RTs. This study investigated the speech recognition ability of normal-hearing and hearing-impaired listeners in three rooms matched for mean RT, but differing in overall volume and dimension. Speech recognition is expected to differ when listening in two large rooms as compared to a highly reflective small room, when all of the rooms have similar mean RTs. The
differences are expected because of the varying reflective characteristics of each room as detailed below.
CHAPTER II
LITERATURE REVIEW
Performance Expectations of Normal-Hearing and Hearing-Impaired Speech Recognition under Reverberant Conditions
The effects of reverberation on speech recognition ability have been compared to the effects of broadband and low-pass noise maskers (Gelfand & Silman, 1979; Lochner
& Burger, 1964). However, masking by reverberation is more complex due to the distortion of speech that occurs as a result of reverberant conditions. Two forms of masking that are associated with reverberation have been found to result in decreased speech recognition ability in reverberant environments. These are overlap-masking (Bolt
& MacDonald, 1949; Knudsen, 1929; Libbey & Rogers, 2004; Nabelek et al., 1989) and self-masking (Bolt & MacDonald, 1949; Nabelek et al., 1989). Both masking effects occur through temporal smearing, which is introduced to speech by the prolongation of reflected signals. Overlap-masking occurs when a preceding phoneme’s energy is delayed and “overlaps” with the subsequent phoneme. For instance, the intensity of vowel sounds is greater than that of most consonants. In a vowel-consonant (VC)
syllable, the occurrence of overlap-masking would result in the vowel’s energy obscuring the recognition of the following consonant. This effect can be minimized by slowing the rate of speech (Bolt & MacDonald, 1949; Haas, 1972). Self-masking refers to the prolongation of energy within a single phoneme. Although there are masking
characteristics specific to reverberation, error patterns similar to those observed with
reverberant listening conditions. Gelfand & Silman (1979) found that the use of a small (1.83 x 1.60 x 2.34m), reverberant test environment resulted in performance
characteristics similar to those observed when speech was masked by a speech-shaped noise. They suggested that their performance trends resulted from reflections overlapping so densely that they act as a speech-shaped masking noise rather than reverberation alone.
They proposed that their study should be repeated in a large room in order to assess the effects of reverberation that was less “compactly spaced”.
Evidence suggests that all listeners, both normal-hearing and hearing-impaired suffer a degradation of speech recognition ability in sufficiently reverberant
environments. A substantial body of work has addressed the speech recognition ability of hearing-impaired listeners under such conditions (Gelfand & Hochberg, 1976; Harris &
Swenson, 1990; Helfer & Wilbur, 1990; Nabelek, 1988; Nabelek & Dagenais, 1986;
Nabelek & Litowski, 1985; Nabelek & Mason, 1981; Nabelek & Pickett, 1974b; Nabelek
& Robinette, 1978; Ricketts and Hornsby, 2003). Of these studies, a subset has directly contrasted the speech recognition performance of both normal-hearing and hearing- impaired listeners on tasks of speech recognition (Gelfand & Hochberg, 1976; Harris &
Swenson, 1990; Helfer & Wilbur, 1990; Nabelek, 1988; Nabelek & Pickett, 1974b;
Nabelek & Robinette, 1978).
Under quiet listening conditions, normal-hearing listeners have been found to be resilient to the effects of reverberation, whereas hearing impaired listeners show
decreased speech recognition ability (Harris & Swenson, 1990; Helfer & Wilbur, 1990;
Nabelek, 1988; Nabelek & Pickett, 1974b). A normal-hearing listener may not make any errors when listening in a quiet reverberant environment, but under the same conditions, a
hearing impaired listener may make numerous errors. Nabelek and Pickett (1974b) found that normal-hearing participants performed at maximal levels on the MRT until a
competing babble was introduced at an SNR of -5 dB, at which point mean performance dropped to 76.6% and 82.5% for RTs of 0.3 and 0.6 seconds, respectively. In contrast, hearing-impaired participants listening to speech at their most comfortable listening level, in quiet, performed at significantly lower levels (64.9% and 57.1% for RTs of 0.3 and 0.6 seconds). This trend is consistent throughout the literature. Comparing the results of multiple investigations, it is not until RT reaches a mean of 0.6 seconds or greater that the performance of normal-hearing listeners, in quiet, begins to decrease as a result of
reverberation alone (Gelfand & Hochberg, 1976; Harris & Swenson, 1990; Helfer &
Wilbur, 1990; Nabelek, 1988; Nabelek & Pickett, 1974b; Nabelek & Robinette, 1978).
For the purpose of comparison, it has been typical to test normal-hearing and hearing-impaired listeners under different conditions in order to yield performance results within a range that is not compromised by maximal or minimal performance levels. In order to investigate the effects of reverberation on normal-hearing listeners at moderate RTs, the task must be made more difficult. Either the presentation level must be reduced to decrease the audibility of speech, or a masking noise must be introduced at a level sufficient to compromise reception of the target speech. Nabelek and Pickett (1974b) completed one of the few investigations that assessed speech recognition in both normal- hearing and hearing-impaired listeners at more than two SNRs. It was necessary for the authors to use different SNRs for the testing of the two groups. In order to elicit a range of performance scores, normal-hearing participants were tested at SNRs of -5, -10, and -15 dB, while the hearing-impaired group was tested in quiet and at SNRs of 10, 5, 0, and
-5 dB. Each of the groups showed a systematic decline in performance as the listening condition became more difficult. Listeners completed all test conditions at RTs of 0.3 and 0.6 seconds. For each group, performance in the higher RT environment decreased in comparison to performance in the lower RT condition. The difference in performance between RTs did not interact with SNR, indicating that the effect of additive noise on reverberant speech is relatively stable as a function of SNR.
The addition of background noise to reverberant speech reveals an interaction that hints to the unique characteristics of reverberation as a masker. The combination of both noise and reverberation does not yield a simple additive masking effect. Rather, the deterioration of speech recognition under reverberant conditions is greater in the presence of both reverberation and noise than would be predicted through simple addition of each individual effect (Irwin & McAuley, 1987; Nabelek & Mason, 1981; Nabelek & Pickett, 1974a; Yacullo & Hawkins, 1987). It has been suggested that this effect is the result of temporal smoothing of the speech envelope (Irwin & McAuley, 1987). Both
reverberation and background noise will reduce the modulation depth of any modulated signal to which they are added, assuming the intensity of the reverberation or noise is great enough to be the dominant energy when the level of the primary signal is reduced.
Harris and Swenson (1990) assessed the recognition ability of normal-hearing and hearing-impaired listeners for reverberant speech. Testing was completed in a small, sound-treated room (size not reported) with a low RT (not reported) and a reverberation chamber (11.92 m3) with higher mean RTs of 0.54 and 1.55 seconds. Performance of the normal-hearing listeners on the identification of single words in quiet decreased by 27.2 points when the RT increased from a low level to 1.55 sec and a background noise was
added at an SNR of +10 dB; for hearing-impaired listeners with mild hearing loss, performance decreased by 44.2 percentage points and for hearing impaired listeners with moderately-severe hearing loss, performance decreased by 43.0 percentage points.
Smaller increases in RT from 0.54 sec to 1.55 sec, in both quiet and noise also had a greater effect on the hearing-impaired listeners. The findings of Harris and Swenson (1990) revealed trends similar to those found by both Nabelek and Pickett (1974b) and Helfer and Wilbur (1990). In each of these studies, performance was reported in percent correct and the task required word identification (although the tests were not identical).
This agreement amongst results from multiple investigations provides further support to the increased effects of reverberation and noise on the speech identification ability of hearing-impaired listeners when compared to their normal-hearing counterparts.
The Effects of Room Size on Speech Recognition
It is common in research on reverberant environments to use a single room, such as a reverberation chamber, for testing speech recognition under multiple reverberation times. Speech recognition performance in small, highly reverberant rooms such as reverberation chambers has often been generalized to performance in larger rooms such as classrooms or churches (Cox, 1987; Danhauer and Johnson, 1991; Helfer & Wilber, 1990; Nabelek & Robinette, 1978). The anecdotal evidence that rooms with similar average reverberation times may have different sound quality, as previously discussed, suggests that there may be differences in the transmission of speech in these rooms.
Watkins and Holt (2000) discuss the “coloration” of speech that occurs as a result of its own reflections, stating that the frequency response of natural reflections is affected by
the inherent overlap that occurs after the speech is reflected. Thus, it is expected that reflected clusters of sound will have different frequency content than the direct signal, and that this frequency response will be dependent upon the reflective properties of the room. This results in coloration of the original signal and will change the perceptual character of sound as it is transmitted through a room.
Thirty articles, addressing the topic of speech recognition under reverberant conditions were selected for review. The selection criteria for these articles dictated that participants must be adults and that research methodology could not solely use simulated reverberation and participants could not be fitted with hearing aids. Twelve of the articles used a single room for testing of multiple reverberation times. In each case this was accomplished by adjusting the absorption of the reflective materials within the room. The use of a single room increases the convenience of test application and may allow RT to be changed without changing the geometry of reflection (Nabelek & Pickett, 1974b), but to date there has not been a systematic investigation of speech recognition performance in multiple rooms that differ in size but yield identical mean reverberation times. Because there is a multitude of methods used to create and simulate reverberant test environments, generalization of a particular study’s findings should be approached with specific regard to the methodology used. In this same review of literature, 19 of 30 studies used recorded stimuli for generating reverberant test materials. In 14 cases, the recordings were
completed using a condenser microphone placed inside one or both ears of a Knowles Electronics Manikin for Acoustic Research (KEMAR). The use of a KEMAR helps to simulate the effect of the human head and outer ear when listening under reverberant conditions. In each of these studies, the stimuli were presented to the listeners under
headphones using the recordings collected at multiple reverberation times and, in many cases, multiple signal-to-noise ratios (SNRs).
Nabelek and Pickett (1974a) used a single room to represent multiple
reverberation times. The binaural speech recognition ability of 5 normal-hearing adult females was investigated. The test room (8.8 x 4.4 x 3.7m) was acoustically treated to minimize ambient noise levels, and an increased RT was achieved by hanging reflective panels on the walls. The mean RT for the low and high reverberant test conditions were 0.3 and 0.6 seconds, respectively. The authors related this range of RT to that found in
“medium-sized classrooms”. The Modified Rhyme Test (MRT) was used for testing in all conditions. Stimuli were presented using two speakers placed in front of the listener, 60 degrees apart. In both test RTs, the speaker-to-listener distance was 11ft. It is typical for speech recognition testing in reverberant rooms to be performed with the listener located beyond the room’s critical distance (CD) in relation to the sound source. The authors calculated CD (Peutz, 1971), which for the 0.6 second RT was 13 feet, and for the RT of 0.3 second was 9.2 ft. Since all testing was performed with the listener 11 ft from the sound source, the low RT condition put the listener within the CD and the high RT put the listener outside of CD. The authors supported this choice by citing the findings of Peutz (1971) who found that, at RTs within the range of those used for this investigation, the effects of changing distance were negligible. Test stimuli were presented at 55 dB (B) and tested under three signal-to-noise ratios (SNRs) using a background of 8-talker babble. A mean decrease in performance was observed when increasing RT from 0.3 to 0.6 seconds. The mean decrease in performance with increase in RT was 9.5 points at -5 dB SNR, 14.1 points at -10 dB SNR and 20.1 points at -15 dB SNR.
Nabelek and Robinette (1978) provided some insight into the relationship
between room size and reverberation, with the intent of establishing the efficacy of using a single room as a test environment for clinical speech recognition assessment. In this study, a room (2.5 x 2.75 x 1.98m or 13.5 m3) was altered by hanging reflective tiles on the walls. This increased the RT in the room by two-fold. The original average RT was 0.25 seconds and the increased RT was 0.50 seconds. Testing was completed using the MRT recorded in a background of 8-talker babble. Both normal-hearing and hearing- impaired participants completed the study. The speech was presented at 50 dB SPL for normal-hearing listeners and at the most comfortable level for each hearing-impaired listener. Normal-hearing listeners were tested at an SNR of -5 dB and each hearing- impaired listener was tested at an SNR selected to produce performance scores
approximately 20 points lower than their best scores in quiet. Mean performance for the normal-hearing group showed that as RT increased, speech recognition ability decreased from 69% to 45.7%, a change of 23.3 points. For the hearing-impaired group, mean performance decreased from 67.5% to 56.3%, a change of 11.2 points, indicating that the normal-hearing listeners were more affected by the increase in reverberation than the hearing-impaired participants.
The findings of Nabelek and Robinette (1978) are comparable to the findings of the previously discussed Nabelek and Pickett (1974a), an earlier experiment from the same lab. The test conditions for each of the two experiments were similar enough to allow for comparison. Each of the two studies used environments that doubled the average RT when reverberation was increased: 0.3 to 0.6 seconds in Nabelek and Pickett (1974a) and 0.25 to 0.50 seconds in Nabelek and Robinette (1978). The focal difference
between these two studies is room size. Nabelek and Pickett (1974a) used a room with a volume of 119 m3 while Nabelek and Robinette (1978) used a room with a volume of 13.5 m3. In each study, the speech and noise levels were the same and while the distance between the listener and the loudspeaker were different; this is not expected to
substantially change performance across studies since in each case testing was completed close to or beyond CD. Between the two studies only a single SNR, -5 dB, was shared.
The data show that the performance of normal-hearing listeners in the larger room dropped by 9.5 points when the RT was doubled and the performance of listeners in the smaller room decreased by 23.3 points when the RT was doubled. The absolute
performance range from each study was 84.3-74.8% in the large room and 69-45.7% in the smaller room. These data make it apparent that, not only is the absolute performance range lower in the small room, but the negative impact of reverberation is greater in the small room. In their 1978 publication, Nabelek and Robinette suggest that these
differences may have resulted from a decrease in the beneficial contribution of early reflections on speech understanding in a smaller room. The authors reported that early reflections appeared to be clustered within the first 10 msec after the direct sound in the small room, rather than within the first 50 msec as previously discussed. In other words, in the small room the detrimental late reflections begin about 10 msec following the offset of the signal, whereas in the large room the late reflections begin about 50 msec following the offset of the signal. This would suggest that, in the small room, the use of the early reflections for speech recognition by listeners is limited in comparison to the larger room.
The purpose of the current project was to investigate the validity of using RT as an indicator of speech recognition, across rooms of different size, but matched for mean RT. This was done using a speech recognition task and two groups of listeners, one group with and one group without hearing loss. The listening rooms were a small reverberation chamber and two larger rooms. In order to reach this agreement of RT between the rooms, the smaller reverberation chamber was made highly reflective while the two larger rooms were much less reflective. Testing was completed using different SNRs in order to illicit a range of performance.
Research Hypotheses
1. When listening at a room’s critical distance, both normal-hearing and hearing- impaired listeners will show a decrease in speech recognition as the size of a listening room decreases, when these enclosures have similar RTs.
2. Given similar RTs, changes in room size result in systematic changes in the MTF, and thus the STI will correlate to changes in speech recognition ability of both normal-hearing and hearing-impaired listeners that occurs when performance is compared across room size and SNR.
CHAPTER III
METHODOLOGY
Speech recognition testing was completed using materials recorded in a
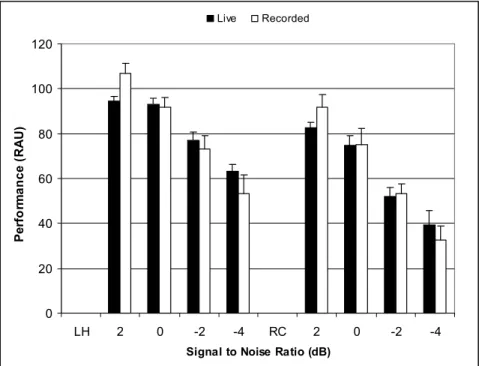
reverberation chamber and in two larger rooms. Each of the three rooms used for testing was matched for mean RT (RT = 1.0 ±0.1 seconds). Two groups performed the speech recognition task using the recorded sentences. One group consisted of normal-hearing adults tested at SNRs of, 4, 2, 0 -2, and -4 dB, and the other group consisted of hearing- impaired adults tested in quiet and at SNRs of 12, 10, 8, and 6 dB. The recordings presented to the hearing-impaired group were amplified to account for the audiometric configuration of each individual’s hearing loss based on validated prescriptive targets. A pilot study with normal hearing listeners confirmed that performance was similar for the recorded presentation mode used in this experiment and a “live” presentation mode using loudspeakers in the actual test room (Appendix A).
Participants
The present study included 13 adult participants without hearing loss and 13 adult participants with mild-to-severe hearing loss. The age range for the group without
hearing loss was from 26 to 49 years with a mean age of 32 years. The participants with hearing loss ranged in age from 29 to 85 years with a mean age of 70 years. Those assigned to the normal-hearing group demonstrated normal hearing sensitivity in both ears, defined as pure tone thresholds better than 20 dB HL at octave frequencies between
250-8000 Hz (ANSI S3.6 1996) in both ears. Hearing-impaired participants were
classified as those having symmetrical, mild-to-severe, sensorineural hearing impairment.
Symmetry between ears was defined as exhibiting no more than a 10 dB interaural
difference in pure tone thresholds at any octave frequency from 250 Hz through 4000 Hz.
Hearing was evaluated by a certified audiologist in a standard sound treated room.
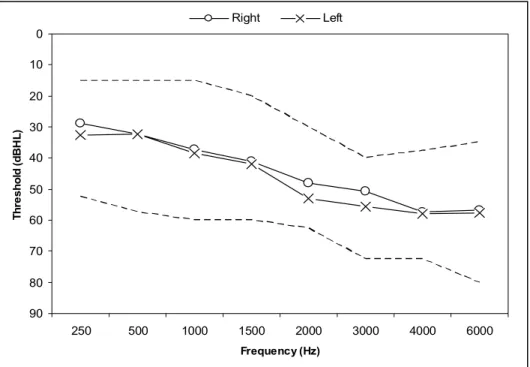
Hearing thresholds were obtained for octave frequencies 250 to 8000 Hz using the modified Hughson-Westlake method in 5 dB steps (Carhart & Jerger, 1959). Mean auditory thresholds, and the range of audiometric threshold are displayed in Figure 1.
0 10 20 30 40 50 60 70 80 90
250 500 1000 1500 2000 3000 4000 6000
Frequency (Hz)
Threshold (dBHL)
Right Left
Figure 1. Average hearing thresholds (dBHL), plotted as a function of frequency (Hz) for the 13 hearing impaired participants. The dashed line represents the range of hearing loss.
Audiometric stimuli were presented through insert earphones (ER-3A) coupled to a Grason-Stadler 2800 audiometer calibrated to ANSI specifications (ANSI S3.6, 1996).
If a hearing evaluation by a certified audiologist was completed within the past six
months, a new hearing evaluation was not conducted. Participants were recruited according to procedures approved by the Vanderbilt University Institutional Review Board.
Generation of Test Materials
Two rooms and the Vanderbilt Bill Wilkerson Center’s reverberation chamber were used for recording test materials. The reverberation chamber (6 x 4 x 2m), referred to as RC herein, is a highly reflective room that has a random incidence ceiling and walls (no parallel surfaces) and a tile floor. The walls are constructed of a double, reinforced layer of 3/4” gypsum board painted with reflective glossy paint. Changing RT in the reverberation chamber is accomplished by adding materials with different levels of acoustic absorption to the walls, ceiling, and floor of the chamber. The adjustment of sound absorption inside the chamber allows the room to have a wide range of
reverberation times, while maintaining the same volume. For this experiment, four 1.25 m2 acoustic blankets were placed on the ceiling approximately 0.9 m in from each corner of the room and the floor was covered by an 3.6 m2 section of indoor/outdoor carpeting in order to achieve the desired RT. No absorptive materials were added to the walls. Two additional rooms were selected based on their dimensions and mean RT (mean reported RTs are averaged at 500, 1000, and 2000 Hz) as defined by Nabelek & Pickett (1974a).
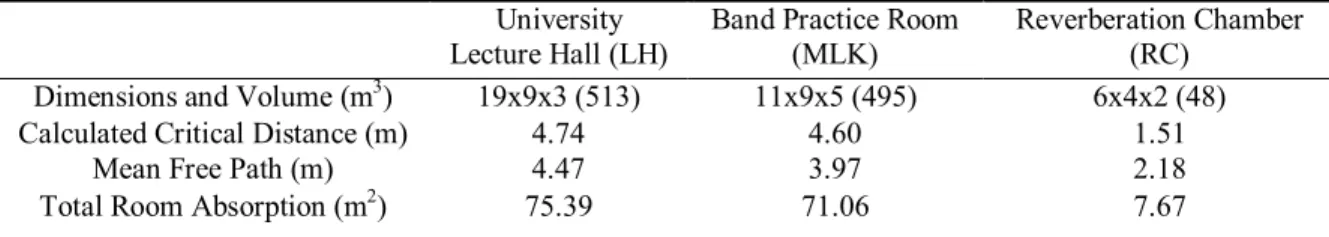
The first of the large rooms, referred to as LH, was a university lecture hall. The second large room, referred to as MLK, was the band-practice room at a public high school. The room dimensions, volume, calculated critical distance (Peutz, 1971), mean free path (MFP) and total room absorption for each room are displayed in Table 1. The calculation
of total room absorption is provided in Equation 8, where V is the room volume, c is the speed of sound in air and RT is the reverberation time,
( )
V cRT
Sα = 55.3 (m2) (8).
University Lecture Hall (LH) Band Practice Room
(MLK) Reverberation Chamber (RC)
Dimensions and Volume (m3) 19x9x3 (513) 11x9x5 (495) 6x4x2 (48)
Calculated Critical Distance (m) 4.74 4.60 1.51
Mean Free Path (m) 4.47 3.97 2.18
Total Room Absorption (m2) 75.39 71.06 7.67
Table 1. Measurements from each test room. Area, Calculated Critical Distance, Measured Critical Distance, Mean Free Path, and Total Room Absorption are provided.
The rooms selected approximate the difference in room size used by both Nabelek
& Pickett (1974a) and Nabelek & Robinette (1978). The small (RC) and large (LH &
MLK) rooms are approximately 10 times different in cubic volume. Frequency-specific reverberation times were measured using the software package Energy Time Frequency (ETF) 4.0 and the hardware outlined below. Frequency-specific and mean reverberation times are provided in Table 2.
Reverberation Time (Seconds)
Frequency (Hz) 500 750 1000 2000 3000 4000 6000 8000 Mean University Lecture Hall (LH) 1.30 1.05 0.90 0.90 1.05 1.10 1.10 0.80 1.03
Band Practice Room (MLK) 0.95 1.05 1.25 1.05 1.00 0.95 0.90 0.90 1.08 Reverberation Chamber (RC) 1.10 1.10 1.00 0.95 1.10 1.10 1.00 0.80 1.02 Table 2. Mean (500, 1000 and 2000 Hz) and frequency-specific reverberation times (RT) for each test room
As targeted at the time of study design, each of the rooms fell within 0.10 seconds of the other for measures of mean RT. The RT of greater than 1.0 second was selected to ensure that placement of the sound source could be at each room’s calculated CD. While
specific RT. The rooms RC and LH show similar frequency-specific RTs with a difference of 0.2 seconds at 500 Hz and 0.1 seconds at 1000 Hz. The test room MLK revealed larger frequency-specific differences. When comparing the rooms LH and MLK, the largest observed differences were 0.45 seconds at 500 Hz, 0.35 seconds at 1000 Hz, and 0.15 seconds at 2000 Hz.
In order to assess the predictive accuracy of the STI as it pertains to changes in room size, measures of the STI were completed in each of the three test rooms using the software package LexSTI 3.1. This software package provides an automated system for calculation of the STI based on measurements of the MTF. The included STI stimulus consists of a Gaussian noise modulated at a series of 14 modulation rates. These samples are played into the room and recorded for analysis. Playback and recording was done using the sentence recording hardware outlined below. The STI stimulus was presented in quiet and with the experimental background noise at each of the SNRs used for the
testing of both normal-hearing and hearing-impaired participants.
Recordings of the Connected Speech Test (CST) (Cox et al., 1987), presented by loudspeaker, were made in each of the three rooms. The CST is a sentence-based task in which the listener is given a topic prior to hearing a set of 10 sentences related to that topic. Participants are asked to repeat each sentence. Select words for scoring are identified in each sentence. A set of 20 sentences (two topics) is considered a passage pair. Each passage pair contains 50 scored words. The use of sentence materials for testing under reverberant conditions has been shown to be sensitive to changes in RT (Kruger et al., 1991). The use of sentences also allowed for a running speech stimulus; it was expected that running speech would increase the incidence of any reverberation-
specific masking effects such as overlap-masking and self-masking. The multi-talker babble included with the CST test material was used as the masking noise.
The CST and noise recordings were played from a single speaker (Tannoy System 600). All signals were recorded through a KEMAR manikin using bilateral IEC 711 ear simulators (GRAS Type 26AC) and a GRAS Power Module Type 12AA microphone amplifier. Placement of the KEMAR manikin was at a height of 1.14 m, in the center of each room, the sound source was placed at a distance from KEMAR that equaled
calculated CD as defined by Peutz (1971). The signal was encoded as a stereo *.wav file with a sampling rate of 44.1 kHz at 16 bits. Storage of the signal was done using a Dell Core 2 Duo laptop computer running a Sound Blaster Audigy 2 ZS PCMCIA sound card and Adobe Audition 1.5. Playback of the original CST wav files and background noise was done using a separate Dell Pentium 4 laptop computer. Calibration of all playback levels was done as specified in the original CST instruction set. In order to generate test conditions with different SNRs, the signal and noise were presented in each room simultaneously at different SNRs and recorded as a stereo signal.
Test Procedures
The standard test procedures asked both normal-hearing and hearing-impaired subjects to sit inside a sound-treated booth and listen to the recorded stimuli through bilateral
Etymotic Research ER-4 insert earphones. The test procedures for the normal-hearing and hearing-impaired groups were identical. The only exceptions were the SNRs (five for each group) used for testing and the filtering of the audio files used for testing of the hearing impaired listeners. The reverberant recordings were presented at a speech level of
70 dBA. Presentation levels were measured in a Zwislocki coupler attached to a slow- averaging Larson Davis System 814 sound level meter. All reported SNRs were relative to 70dBA speech presentation level. Playback of the recorded materials was done from a Dell Pentium D personal computer and amplified via a Madsen Orbiter 922 audiometer.
In order to account for changes in frequency response of the recorded materials that resulted from the use of the ER-4 insert earphones, the frequency response of the
headphones was measured in a Zwislocki coupler and a time-domain filter was generated in order to flatten the response of the headphones. This filter was created using the “FFT Filter” function provided in the commercially available sound editing software (Adobe Audition 1.5). The same filter was subsequently applied to each of the recorded speech and noise files.
The same recordings were filtered a second time for use with the hearing- impaired listeners. For each hearing-impaired participant, the test files were filtered to match Real Ear SPL targets as generated for an individual’s audiometric data using NAL- NL1 suggested targets (Byrne et al., 2001). These modifications were made to the
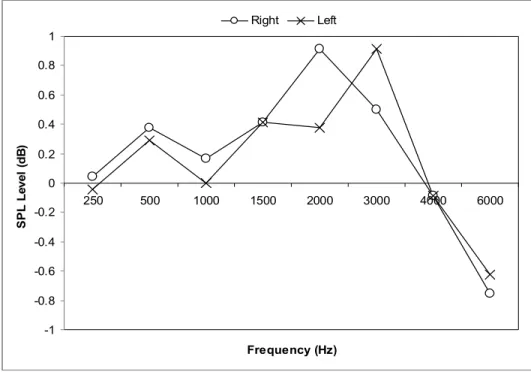
recorded files by generating a time-varying filter using the “FFT Filter” function in Adobe Audition 1.5. This filter linearly amplified specific frequencies in order to meet the suggested SPL targets when measured in a Zwislocki coupler. Because the filter generation process was time consuming, all targets were matched using the Zwislocki coupler prior to each participant’s test session. The overall speech levels used for testing of the hearing-impaired group varied across listeners based on their degree of hearing loss and the NAL-NL1 targets, but the effective SNRs remained the same across all listeners. Mean deviation from match to target is displayed in Figure 2.
-1 -0.8 -0.6 -0.4 -0.2 0 0.2 0.4 0.6 0.8 1
250 500 1000 1500 2000 3000 4000 6000
Frequency (Hz)
SPL Level (dB)
Right Left
Figure 2. Average deviation from NAL-NL1 target, as a function of frequency (Hz). The largest single deviation from the NAL-NL1 target was 4 dB at 4000 Hz.
Five SNRs were selected for each group, representing a targeted range of performance between 10% and 90% percent. The SNRs for the normal hearing subjects were identified using the pilot experiment (Appendix A). In order to approach this range of performance it was expected that the hearing-impaired group would require more favorable SNRs (Gelfand & Hochberg, 1976; Harris & Swenson, 1990; Helfer & Wilbur, 1990; Nabelek, 1988; Nabelek & Pickett, 1974a). The selected SNRs for the normal- hearing group were: 4, 2, 0, -2, and -4 dB, while the SNRs used with the hearing- impaired listeners were: quiet, 12, 10, 8 and 6 dB. Each subject listened to two CST passage pairs per condition for a total of 15 CST passage pairs (SNR x 5, Room x 3).
Therefore the scores for each condition are based on a total of 50 keywords.
Data Analysis
To determine differences between groups and the impact of reverberation and background noise, the performance data were analyzed using repeated-measures analysis of variance (ANOVA). In order to normalize the distribution of variance in the
performance data, all percent correct scores were converted to Rationalized Arcsine Units (RAU) (Studebaker, 1985). Performance data are plotted in RAU, and all statistical analyses completed on the performance data were performed on the RAU transformed data. A between-groups repeated-measures ANOVA was used to investigate the between- groups factor of hearing status. The between-subject factor was group (normal-hearing, hearing-impaired) and the within-subject factors were room type and SNR. A series of linear contrasts were completed to follow-up significant main effects or interactions;
these analyses addressed the factors of room size and SNR. This between-group analysis can be questioned however, because different SNRs were used for the different groups.
Despite this limitation, this analysis was of interest to determine if similar effects of room, and interactions between room and SNR were measured for the two groups.
Because the two groups completed testing under different SNRs, each group was also analyzed separately. Analysis of the performance of the normal-hearing group was completed using a repeated-measures ANOVA on the within-subjects factors of SNR and room type. These same analyses were completed on the hearing-impaired data set. All post hoc analyses were completed using a series of linear contrasts. Significance for all analyses was defined at p < 0.05.
CHAPTER IV
RESULTS
Speech Recognition Testing
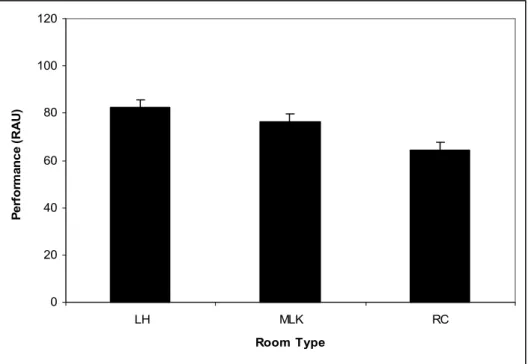
The mean speech recognition performance of normal hearing listeners in each of the three test rooms is shown in Figure 3. Analysis of these results revealed a significant main effect of SNR, F(1,4) = 202.2, p < 0.001, indicating that as test SNR became more adverse, listener performance decreased. A significant main effect of room type was also observed, F(1,2) = 127.9, p = 0.001. This finding supports a significant change in
performance across each of the three room types as evident in Figure 4, which shows performance across all test SNRs for the normal-hearing group as a function of room type.
0 20 40 60 80 100 120
LH 4 2 0 -2 -4 MLK 4 2 0 -2 -4 RC 4 2 0 -2 -4
Signal to Noise Ratio (SNR)
Performance (RAU)
0 20 40 60 80 100 120
LH MLK RC
Room Type
Performance (RAU)
Figure 4. Average normal hearing CST performance collapsed across SNR, plotted as a function of room type. Error bars show standard error of the mean.
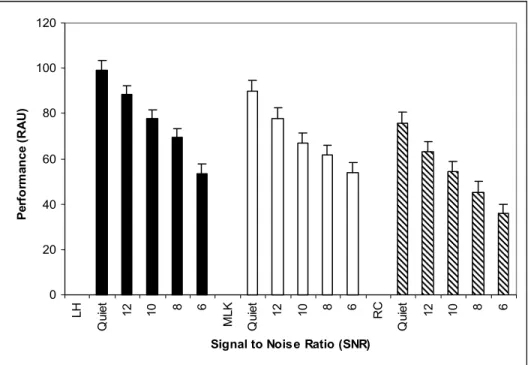
Percent performance data for the hearing-impaired test group as a function of SNR are shown for the in Figure 6. Statistical analysis revealed a significant main effect of SNR, F(1,2) = 92.8, p = 0.001, indicating that as test SNR increased, hearing-impaired performance decreased. Figure 7 details the main effect of SNR; hearing-impaired performance collapsed across room type is plotted as a function of SNR. Figure 8 highlights the main effect of room type, plotting mean speech recognition ability,
collapsed across all test SNRs, for the hearing-impaired group as a function of room type.
A significant main effect of room type was observed, F(1,2) = 61.5, p = 0.001. This finding supports a significant change in performance across each of the three rooms for hearing-impaired listeners. Follow-up analyses of the significant main effect of room type indicate that performance in each individual room was different from the next, p < 0.001.
No significant interactions were observed within the normal-hearing test group. Between- groups analysis showed a significant difference for the main effect of hearing-status F(1,10) = 86.4, p = 0.001. The lack of between-group interactions supports the
conclusion that changes in room size and SNR had similar effects on the two groups.
0 20 40 60 80 100 120
LH Quiet 12 10 8 6 MLK Quiet 12 10 8 6 RC Quiet 12 10 8 6
Signal to Noise Ratio (SNR)
Performance (RAU)
Figure 5. Average hearing-impaired CST performance in each test room plotted as a function of SNR. Error bars show standard error of the mean.
0 10 20 30 40 50 60 70 80 90
LH MLK RC
Room Type
Performance (RAU)
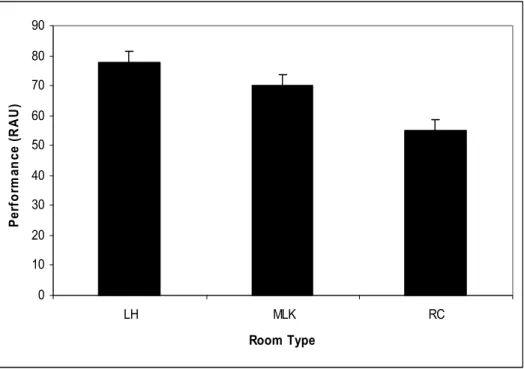
Figure 6. Average hearing-impaired CST performance collapsed across SNR, plotted as a function of room type. Error bars show standard error of the mean.
The STI as a Predictor of Speech Recognition Performance
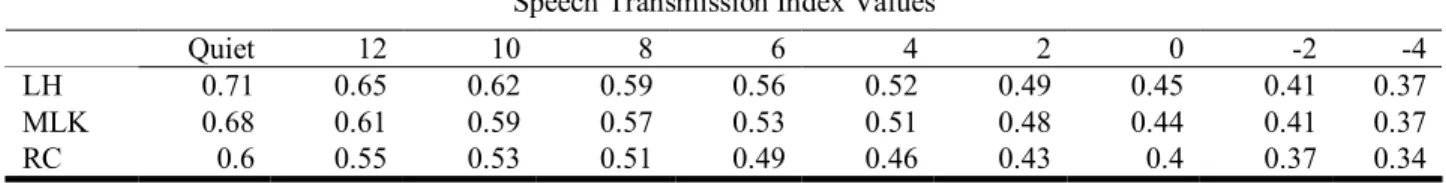
STI values were measured for all test conditions. These results are provided in Table 3. The accuracy of the STI as a predictor of absolute performance was not evaluated. The STI measures were not corrected for hearing-loss. Rather, they were collected to evaluate the accuracy of the basic STI method in reflecting change in
performance across room type and SNR. It was expected that the STI would be sensitive to the effect of SNR (Ricketts & Hornsby, 2003). In each room, the STI measures decreased with each concomitant decrease in SNR. The STI measures also reflected the change in room size. At all SNRs, both large rooms exhibited the highest STI values, while the reverberation chamber yielded the lowest STI values. STI values in the two larger rooms showed differences in quiet and at SNRs from 12 to 0 dB. This difference was in agreement with observed performance differences between the two large rooms.
At SNRs of -2 dB and -4 dB the measured STI values overlapped for the two large rooms, in disagreement with the performance data.
Speech Transmission Index Values
Quiet 12 10 8 6 4 2 0 -2 -4
LH 0.71 0.65 0.62 0.59 0.56 0.52 0.49 0.45 0.41 0.37
MLK 0.68 0.61 0.59 0.57 0.53 0.51 0.48 0.44 0.41 0.37
RC 0.6 0.55 0.53 0.51 0.49 0.46 0.43 0.4 0.37 0.34
Table 3. Measured STI values in each test room as a function of all SNR conditions
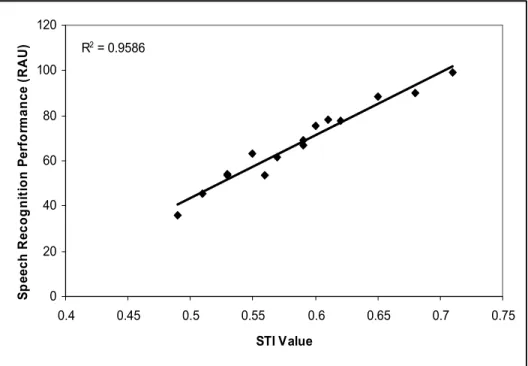
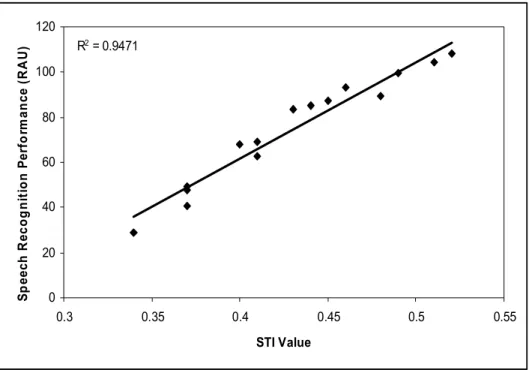
As expected, the STI data shown in Table 3 indicate that the STI decreased with each increase in noise level across all three room conditions. As multiple SNRs were required in order to elicit a similar range of performance between the two test groups, it was expected that each group’s performance correlated to a different range of measured STI values. The change in normal-hearing performance as a function of STI is plotted in Figure 9. A positive correlation was found between sentence recognition performance and measured STI of r2 = 0.94 for the normal-hearing test group. Figure 10 shows the relationship between hearing-impaired speech recognition performance and the measured STI value at each SNR used for testing of the hearing impaired participants. The
correlation between sentence recognition and STI across all listening conditions used with the hearing-impaired listeners was R2 = 0.96.
R2 = 0.9471
0 20 40 60 80 100 120
0.3 0.35 0.4 0.45 0.5 0.55
STI Value
Speech Recognition Performance (RAU)
Figure 7. Average normal-hearing CST performance, plotted as a function of measured STI value. The range of performance and STI measurement encompasses all SNRs used for testing of the normal-hearing group. The solid line shows a least squares fit to the data using linear regression.
R2 = 0.9586
0 20 40 60 80 100 120
0.4 0.45 0.5 0.55 0.6 0.65 0.7 0.75
STI Value
Speech Recognition Performance (RAU)
Figure 8. Average hearing-impaired CST performance, plotted as a function of measured STI value. The range of performance and STI measurement encompasses all SNRs used for testing of the hearing-impaired group. The solid line shows a least squares fit to the data using linear regression.