Energy as a Measure of the Size of an Earthquake
The idea of using a physical and fundamental quantity to measure the size of earthquakes led Gutenberg to use radiated energy as a measure of earthquake size [Gutenberg Gutenberg and Richter, 1956a, 1956b]. However, due to poor seismic data quality and limited computer facilities, it was difficult to estimate radiated energy; thus, the commonly used measure of earthquake magnitude was based on the amplitude of surface waves (surface wave magnitude).
Using Macroscopic Seismic Parameters to Understand Different Types of
Another parameter that has been used to understand the differences between the different types of earthquakes is radiated energy. However, in most of these studies, radiated energy was not directly estimated from seismic waves.
Objective of the thesis
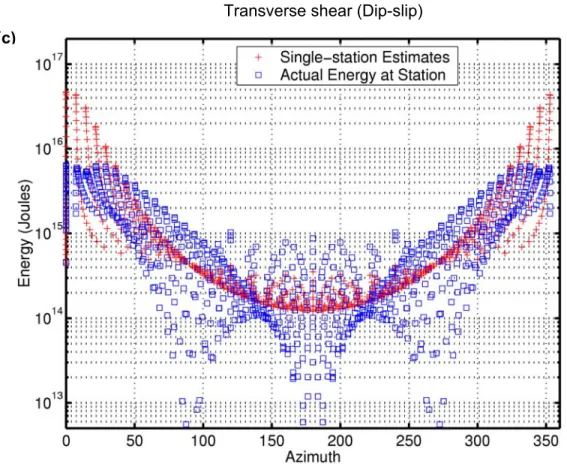
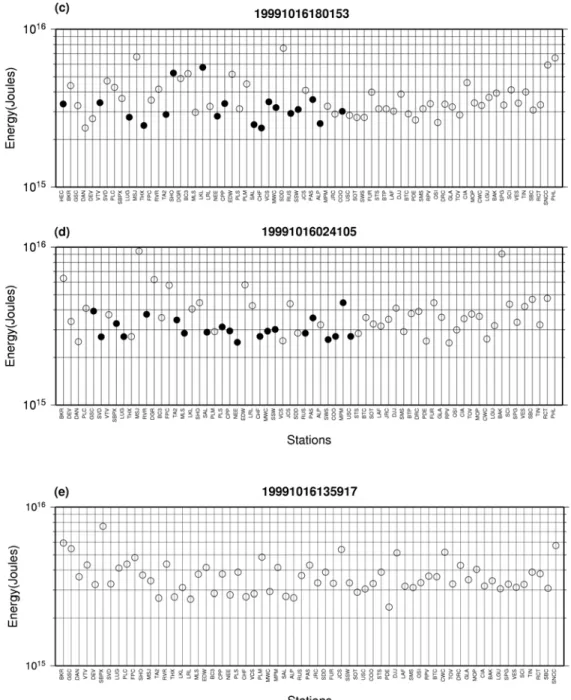
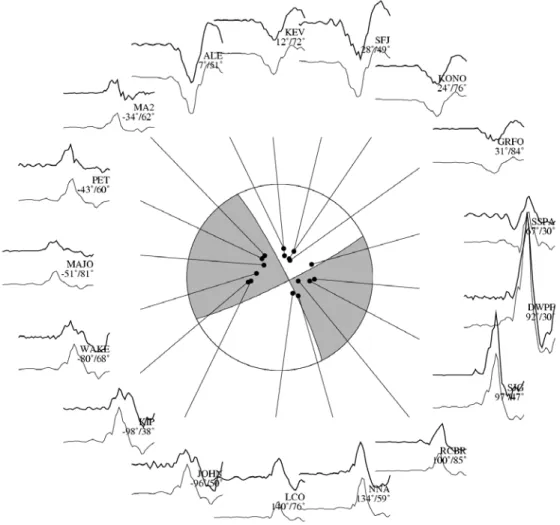
The radiated energy of the earthquake is equal to the average of the single-station estimates. The mean (mean) of energy estimates with a single energy station in the frequency domain is shown in Figure 4.4.
Corrections Applied to the Observed Data
- Directivity
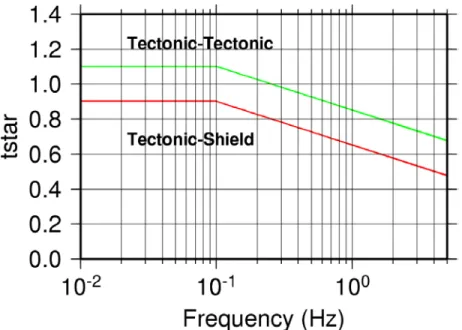
- Attenuation
- Radiation Pattern
- Source Structure
- Scattering
For the case considered, the actual total energy is approximately a factor of 5 smaller than the average of the regional energy estimates for one station. The correction factor is given by the ratio of the actual total energy for the model to the average of the single station energy estimates for the model, i.e.
Energy Estimates from Regional Data: EGF Technique
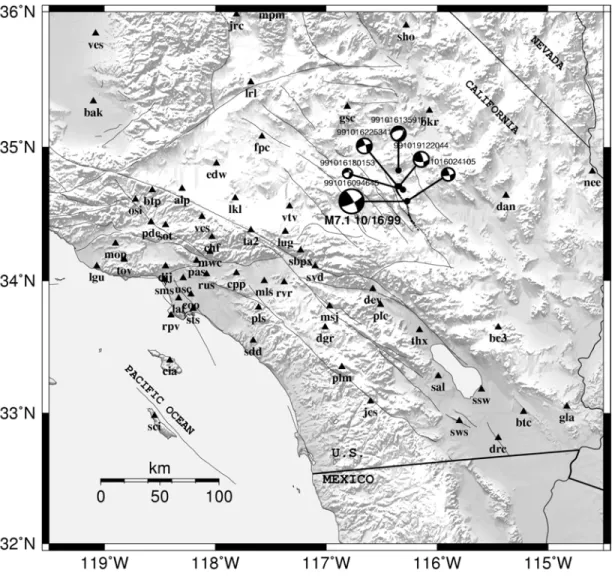
- Hector Mine Earthquake
- Regional Data
- EGF Method Applied to the Hector Mine Earthquake
- Results
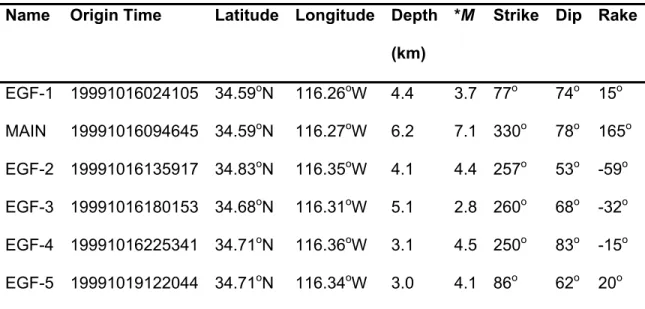
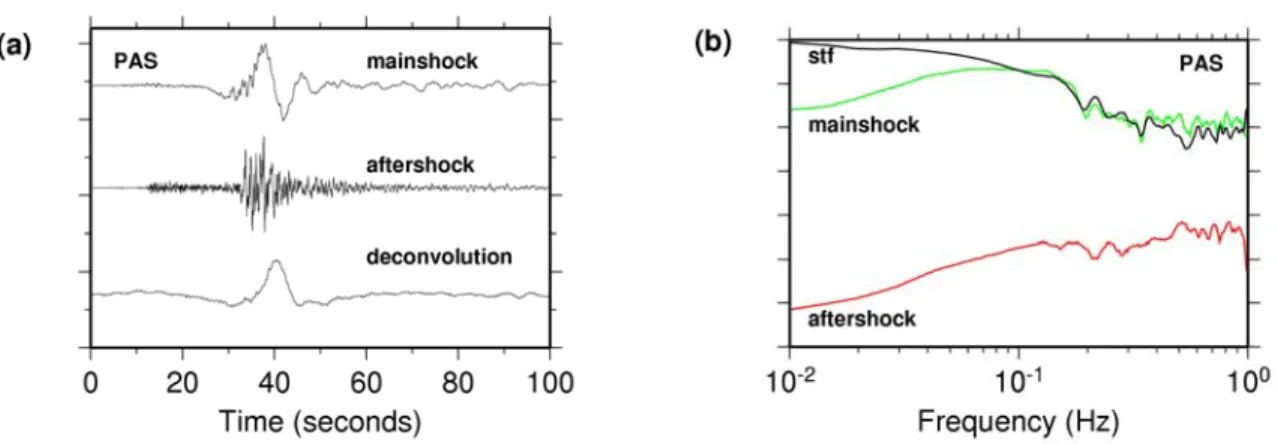
The focal mechanisms (lower hemisphere) of the main stroke and the five EGFs used in the study are shown. The deconvolved spectrum is scaled by the scalar moment of the EGF to give the source spectrum of the main shock.
Calibration of Teleseismic Methods of Estimating Radiated Energy
- Data and Method
- Results
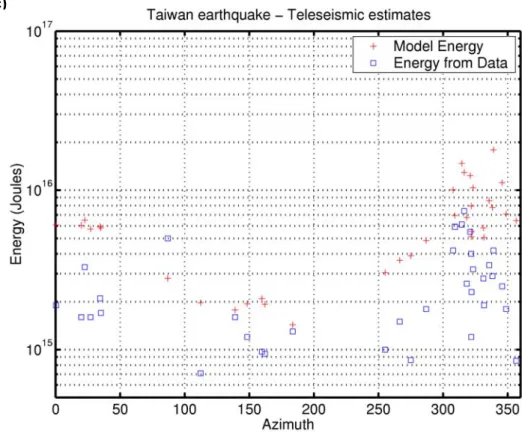
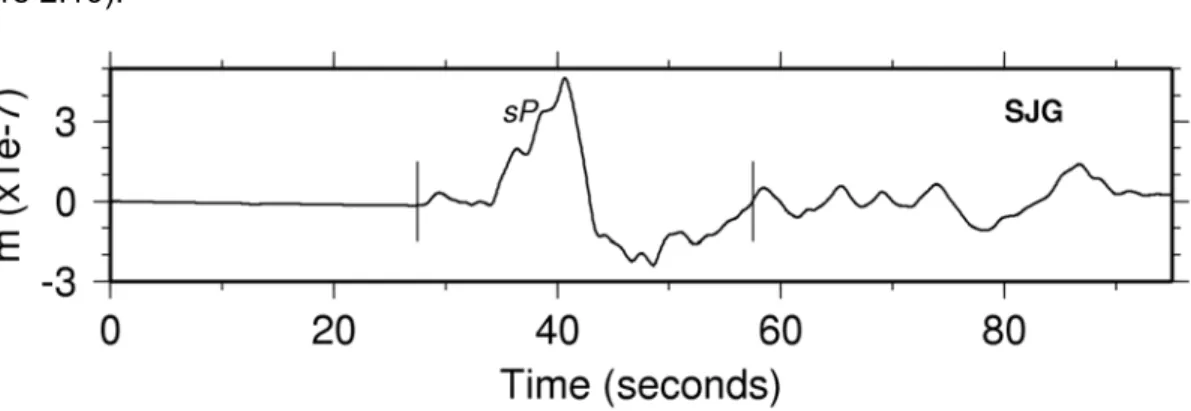
Using this theoretical source spectrum, we also determine that the energy at frequencies above 1 Hz is about 20 percent of the energy of the frequency band below 1 Hz. From the directivity corrections calculated earlier (section 2.1.1), the energy after correction for the directivity effect is 1 x 10¹⁵ J. The energy obtained from the P-waves is used to estimate the total energy, by equation (2.2 ) to use.
Uncertainty in the near-source structure can lead to inaccurate Green's functions and thus inaccurate estimates of energy. The radiation pattern is particularly sensitive to changes in the dip angle of the fault plane.
Energy Estimates for Small Earthquakes
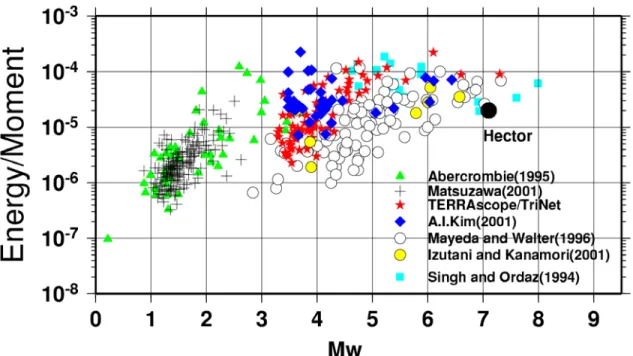
These estimates of radiated energy for the Hector Mine earthquake are consistent with the values obtained by Boatwright [2001] .
Discussion and Conclusions
A fraction of the total potential energy is dissipated at the fault plane and is given by For example, earthquakes with tsunamis [Kanamori, 1972; Polet and Kanamori, 2000] occur in the shallow parts of the subduction zone. The fracture was complex and the focal mechanism varied with the length of the fracture.
The mechanism of the earthquake is consistent with the extension of the downdip in the subducting Kuril plate. In these earthquakes, only a small part of the energy is dissipated in mechanical processes in the fault zone.
Using Fracture Mechanics to Understand the Earthquake Problem
- Crack Model
- Frictional Sliding Model
- Relating the Crack Model to the Frictional Sliding Model
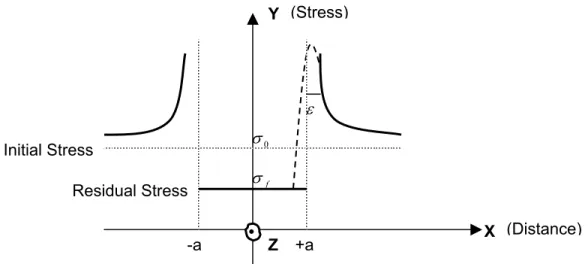
To understand the stress relaxation process in the crack model, we consider a crack with a width that extends to infinity in the Z direction, as shown in Figure 3.1. The actual stress field at the crack tip will be smeared, as shown by the dashed curve in Figure 3.1. Physically, this would result in a region of inelastic deformation, called the failure zone (Figure 3.2), around the crack tip.
If there is no failure zone (ie), the stress at a point that is very close to the crack tip will drop from. As the rupture approaches the tip, the stress at P increases due to the dynamic stress concentration ahead of the crack, and it reaches σy by the time the crack tip reaches P.
Energy Budget of Earthquakes
During this stress relaxation process, the total potential energy (strain energy + gravitational energy) drops from W to W−∆W, and the total potential energy change in an earthquake is given as ∆W =σ DS [Knopoff, 1958; Dahlen, 1977; Kostrov, 1974], where the average stress during the fault, σ =(σ0+σ1) 2, D is the average displacement during the earthquake and is the area of the fault. The rest is radiated as seismic waves, and the wave energy is known as radiant energy. Using the special stress relaxation model shown in Figure 3.4, the energy dissipated on the fracture plane can be separated into fracture energy ( ) and frictional energy ( ), i.e.
Thus, the area under the trapezoid in Figure 3.4 represents the total potential energy released in an earthquake. While fracture energy is the energy used in mechanical processes (other than frictional heating) on the fault zone as the fracture propagates, frictional energy is the energy dissipated as heat on the fault surface.
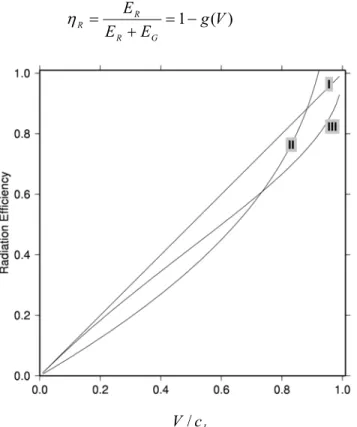
Radiation Efficiency
Husseini [1977] used this formulation to determine radiative efficiency, but due to the poor quality of data available at the time, robust estimates of radiated energy were not possible and the study did not proceed. In the earthquake process itself, we cannot distinguish between fracture energy and frictional energy; they both contribute to the energy dissipated in the fault zone. The variation of stress during failure can also be quite complex; the stress may increase after fracture or there may be overshoot where the stress drops to a level below the residual friction level (σ1<σf0).
However, the simple model above captures the essence of the problem and can be used to understand the earthquake mechanism.
Rupture Speed and Fracture Energy
The relationship between fracture velocity and fracture energy can also be understood in terms of the energy budget. This does not necessarily involve the energy loss of the crack tip; it is simply the energy not radiated and not dissipated in frictional heating on the fault. Thus, even from simple energy considerations we can see that fracture energy and fracture velocity are related.
If we use equation (3.17) and equation (3.18), we can determine the radiation efficiency as a function of the ratio of rupture velocity and the limiting rupture velocity (V/cL). Thus, both crack theory and simple energy considerations can be used to relate fracture energy to fracture velocity.
Conclusions
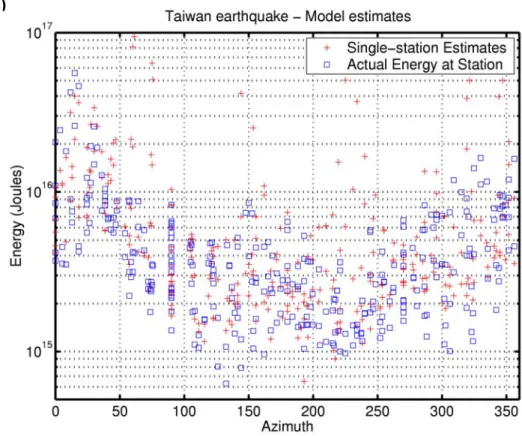
The different types of subduction zone earthquakes have differences in the frequency content of the seismic energy released. The figure on the left shows that the effect of the radiation pattern factor has not been eliminated. To the southeast of the hypocenter there is a large asperity [Masayuki Kikuchi, written communication, 2002]. However, we do not see significant directivity in the energy estimates for one station.
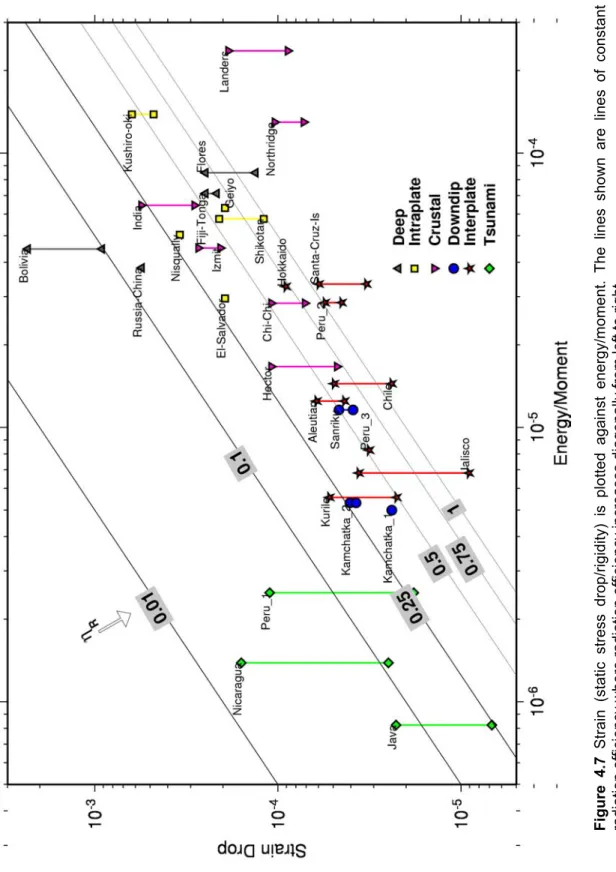
Table 4.1 reports the mean and median of the energy estimates for one station in the frequency domain. Despite the differences in the radiated energy-moment ratios, due to the corresponding differences in static stress drops, interplate, downdip, intraplate, and deep earthquakes have the same radiation efficiency.
Introduction
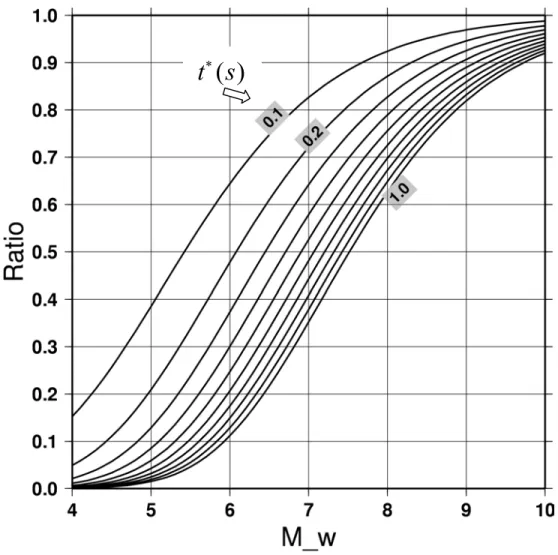
Subduction zones, areas of the Earth where one plate slides under another, host a whole range of earthquakes – interplate, tsunami, intraplate and deep earthquakes. They produce relatively minor tremors, but are followed by destructive tsunamis that are much larger than expected from the seismic moment magnitude of the earthquakes. Compared to ordinary subduction zone earthquakes, tsunami earthquakes are deficient in high-frequency energy; however, they have a significant amount of energy for long periods of time.
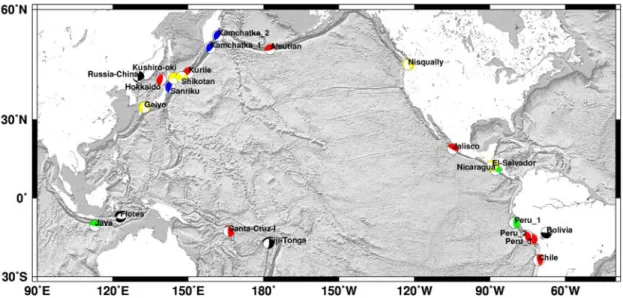
To investigate this and understand the rupture mechanics of different types of subduction zone earthquakes, we use macroscopic source parameters—radiated seismic energy, seismic moment, rupture area, and rupture velocity. In this chapter, we calculate teleseismic estimates of radiated energy for 23 major subduction zone earthquakes; most of these earthquakes have Mw >7.5, but so do we.
Different Types of Subduction Zone Earthquakes
From the seismic moment, radiated energy, and static stress drop values, we calculate the radiation efficiency for these earthquakes and interpret our results in light of differences in rupture mechanisms.
Radiated Energy of Subduction Zone Earthquakes
Thus, we can use this ratio to correct the mean of energy estimates for individual stations determined from data for directivity. Station coverage south of the earthquake is poor; thus, although the rupture propagated to the south, the single-station estimates of energy do not show significant directionality. However, since the earthquake is an aftershock and the directionality is on-strike, the effect of directionality will not affect the average of the individual station energy estimates by more than a factor of two (see Section 2.1.1).
The Aleutian earthquake, M0=8.8 x 10²⁰ Nm, was an interplate earthquake that ruptured the western part of the Aleutian subduction zone. The Santa Cruz Island earthquake, M0=5.7 x 10²⁰ Nm, was an interplate thrust in the shallow part of the New Hebrides subduction zone.
Partitioning of Energy in Earthquakes
- Radiation Efficiency
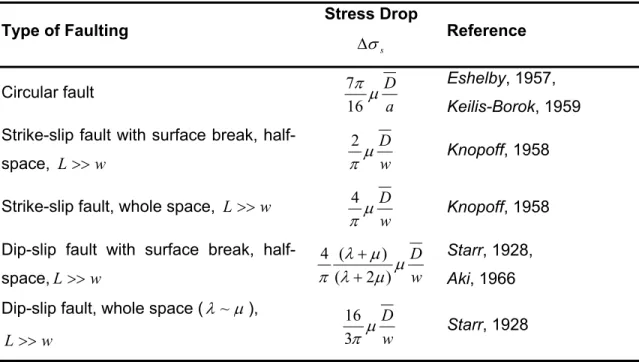
- Static Stress Drop
Static stress drop is defined as the change in the average state of stress on a fault before and after rupture. The actual stress drop on a fault can be very heterogeneous due to variations in stress and strength distribution on the fault plane. Various methods are used to estimate stress drop (a discussion of the various methods can be found in Kanamori, [1994]).
[2002b], but using the trimmed fracture dimensions from Nazareth [2002], we obtain a static stress drop of 3.2 MPa. For the trimmed model, if we calculate the static voltage drops of the individual segments and then calculate the average voltage drop, i.e. if we calculate the static voltage drop using.
Results and Discussion
Likewise, it is possible that the trench morphology causes bifurcations and bifurcations of the fault, resulting in the large energy dissipation during the rupture process of tsunami earthquakes. 2002] suggest that some of the fracture energy is dissipated outside the main fracture surface, where secondary failure occurs in the damage zone. This is indicative of the slow nature of rupture in these events, i.e. a small rupture velocity.
Thus, an independent measure of rupture velocity can be used to check the consistency of the stress drop estimates. S1 is the area of the upper triangle in Figure 4.13 and S2 is the area of the shaded triangle.
Conclusions
In the case of deep events, the energy is probably dissipated in thermal processes on the fault zone, while it is possible that the morphology of the trench causes branching and branching of rupture leading to the large energy dissipation during the rupture process of tsunami earthquakes . Winslow, The complex rupture process of the 1996 deep Flores, Indonesia earthquake (Mw 7.9) from teleseismic P-waves, Geophys. Houston, H., Broadband source spectrum, seismic energy and stress drop of the 1989 Macquarie Ridge earthquake, Geophys.
Kanamori, Source characteristics of the 1992 Nicaragua tsunami earthquake inferred from teleseismic body waves, Pure Appl. Takeo, Slip history of the 1994 Sanriku-Haruka-Oki earthquake, Japan, inferred from strong-motion data, Bull.