135 Figure IV.4 Cross-section diagram of SLS and D263 sample in different. 137 Figure IV.5 Modeled thickness of dealkalized glass as a function of time under two.
AQUEOUS CORROSION OF NUCLEAR WASTE GLASSES
Introduction
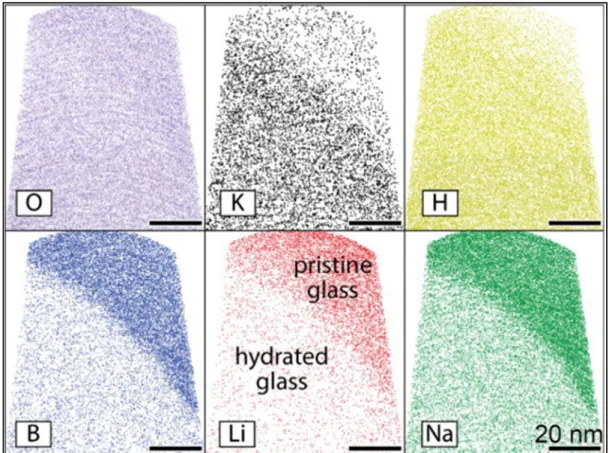
With the new addition of characterization tools such as APT, scientists have been able to reveal the interfacial dissolution and reprecipitation mechanism of glass corrosion 1, 9, 10, which has presumably led to insights into the rate-limiting factors of glass corrosion, thus providing better models to assess of safety glass from nuclear waste. This study reviewed the mechanism of glass corrosion as investigated by various case studies using surface characterization tools and evaluated the strengths and limitations of surface characterization techniques.
What do we know about the interaction between “aqua” and glass?
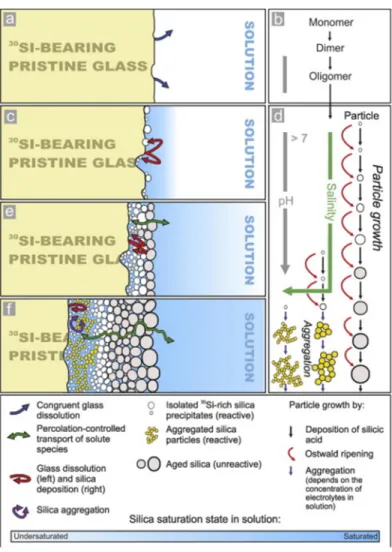
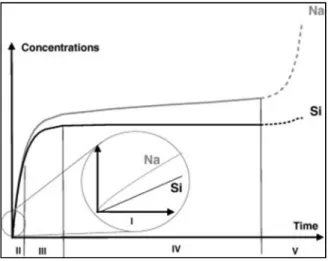
The interfacial solution reprecipitation model basically describes a process that: congruent dissolution of the glass stops when saturation of amorphous silica occurs at the glass surface (Figure I.3a), monomeric silica polymerizes in solution to. Two of the assumptions are 1) silica saturation occurs at the early reaction stage (except for the congruent dissolution regime) and the reprecipitation of silica occurs immediately after being dissolved from the glass;.
Probing the chemical and morphological information of altered glass with surface
- Electron beam based characterization techniques
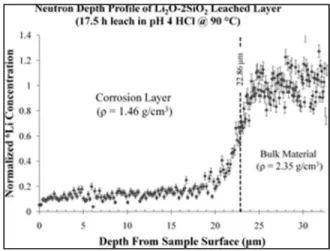
- Depth profiles of altered glass using SIMS
- Characterization of altered glass surface using XRR, AFM, and Interferometry
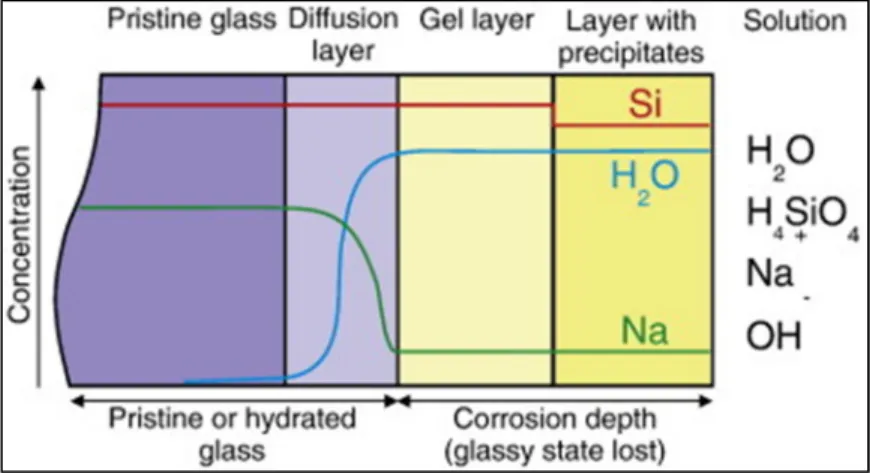
A natural limitation of SIMS is that sensitivity is often sacrificed at the expense of lateral resolution 36. As shown in Figure I.5, the shape of the elemental profiles was used to assign the characteristic areas of each section of the line, e.g. the gradient shape line is assigned as the chemical gradient region.
What additions of advanced surface characterization tools advanced our understanding
More importantly, findings of new characterization techniques have advanced the understanding and estimation of glass corrosion behavior. The investigation of the relationship between glass corrosion kinetics/mechanism, glass structure and morphological evolution of glass surfaces contributes to the estimation of glass dissolution rates in the long term.
QUANTITATIVE MORPHOLOGICAL AND COMPOSITIONAL
Materials and Methods
- Glass Melting and Bulk Glass Composition Analysis
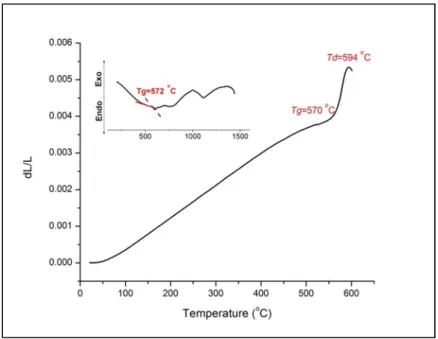
- Bulk Glass Thermal Analysis
- Glass Surface Preparation
- Glass Surface Composition
- Glass Surface Morphology
The heat-treated samples were annealed at 570 oC for 3 hours, followed by cooling in the furnace overnight (~12 hours). The obtained samples are ultrasonically washed in acetone for 10 minutes and then kept in a vacuum desiccator until the time of surface analyses.
Results and Discussion
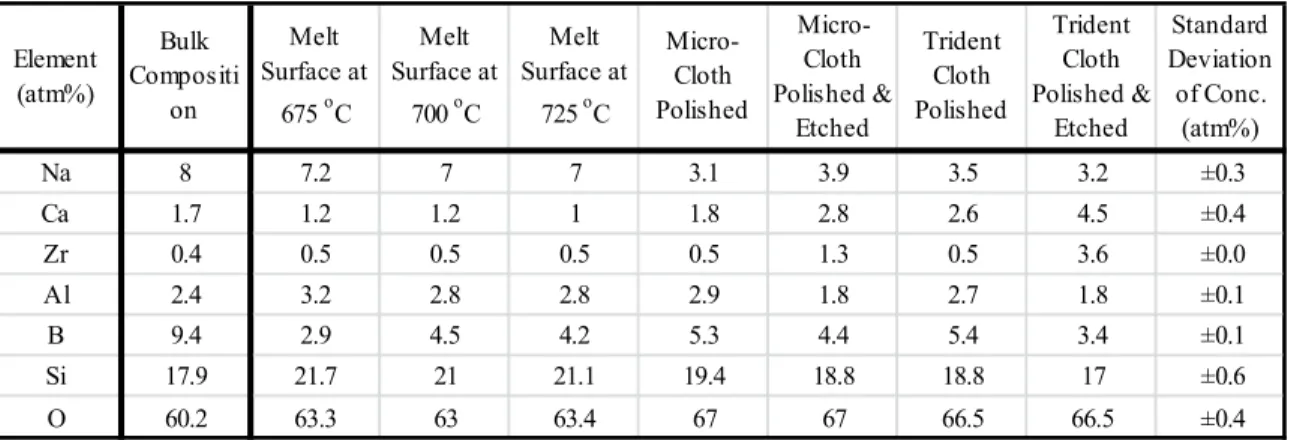
- Bulk Glass Composition
- Thermal analysis of bulk ISG glass
- XPS analysis of ISG glass surfaces
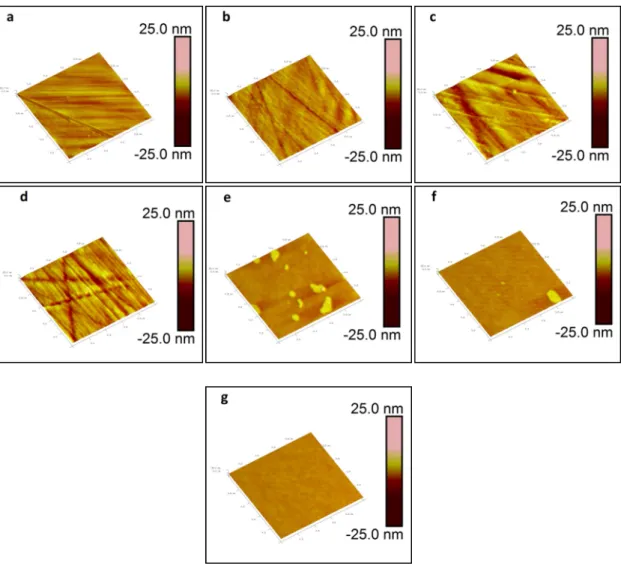
- AFM imaging & statistics of melt/polished ISG glass surfaces
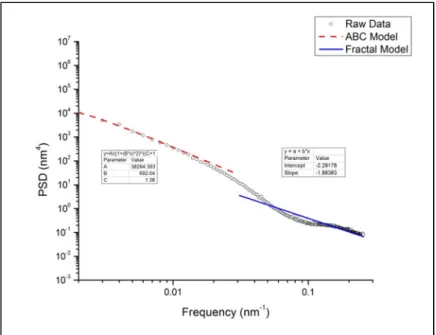
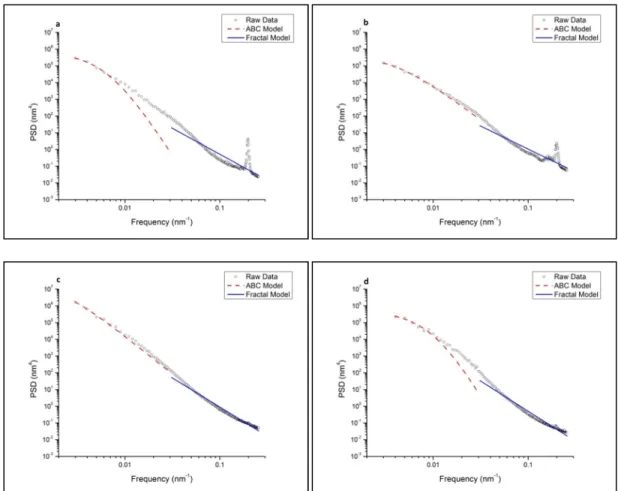
- Power spectral density (PSD) analysis of ISG glass surfaces
After removing positive relief features, the apparent RMS does not change, within the error of the measurement. In general, regardless of the removal of positive relief features, the apparent RMS roughness of the 675 and 700 oC melt surfaces is less than 1.5 nm, while the apparent RMS roughness of the 725. The apparent RMS roughness of the 725 reported here the melting surface of 725 oC is comparable to the RMS roughness value reported for other glass melting surfaces [e.g.
The Tridentcloth results in a glass surface with a lower apparent RMS roughness than that of the Microcloth. As shown by Figure II.4, the ABC model fits the "knee" region of the PSD profile below the spatial frequency of 0.02 nm-1.
A LEAP TOWARDS THE UNDERSTANDING OF GLASS
Characterization of bulk glass and preparation of melt surface
The glass used in this study was remelted from commercially available aluminoborosilicate glass with fiber insulation (courtesy of Johns Manville) in glass shards. The density of the glass (g/cm3) was measured by tripling the Archimedes method on remelted glass coupons. Aluminoborosilicate glass shard was remelted in an alumina crucible at 1250 oC in a resistance-heated furnace to prepare coupons from the glass melting surface.
The glass melt was held at the melting temperature for 1 h to allow homogenization and release of entrapped air. The resulting glass coupons are homogeneous in physical appearance and show no signs of devitrification after firing.
Corrosion experiment
All glass coupons were sonicated in isopropanol for 15 min, dried under a stream of nitrogen gas, and stored in a vacuum desiccator prior to any testing or characterization. Glass coupons were placed at the bottom of HDPE bottles (filled with solutions) with the molten surface facing up. A measurable surface roughness would be in the order of nm to μm depending on the capabilities of the AFM used as well as the influence of surface roughness.
Since the aim of this study was to develop a new method to determine the dissolution rate of glasses, the surface retraction should be in the order of hundreds of nanometers within the given time of reaction. As an adjunct to the measurement of dissolution rate at longer terms of corrosion, glass coupons reacted for 480 hours, 720 hours and 960 hours were introduced into each pH test group.
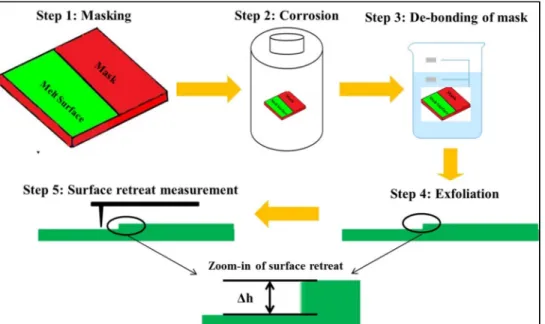
Materials of masking and strategy of post-reaction exfoliation
The polymeric composite mask is a mixture of uncured silicone and liquid cyanoacrylate with a volume ratio of (Vsilicone/Vacrylate = 10:1). The polymer composite mixture was then cooled to room temperature before being applied to the melt surface of the glass coupons. After reaction, the glass coupon was washed in isopropanol and soaked in acetone for 10 minutes.
A comparison set of cured polymeric mask composite was characterized using XPS to understand the bonding environment of the polymeric mask. AFM was performed on the samples after exfoliation (reacted or unreacted) to confirm the hydrophobicity of the composite polymeric mask (e.g. no change in the surface morphology of the masked area).
X-ray photoelectron spectroscopy
To demonstrate that the composite mask can be completely removed using this method, quantitative X-ray photoelectron spectroscopy (XPS) was performed on the masked area of the glass coupon (reacted and unreacted) after peeling. Peaks identified in all survey scans were used to fit the binding range of the high resolution scan energy, transition energy (26 eV) and dwell time. The beam dwell time for each peak of the high-resolution scan was adjusted (~500 ms/step) to produce a signal-to-noise ratio.
Quantification of surface chemical compositions was performed for all samples from high-resolution scans including Si2p, Al2p, B1s, Mg2s, Ca2p, Na1s, K2p and O1s peaks. Relative sensitivity factors for all elements (RSFSi2p=1, RSFAl2p=0.5, RSFB1s=0.4, RSFMg2s=0.5, RSFCa2p=5.3, RSFNa1s=3.0, RSFK2p=3.2 and RSFO1s=1, 8) was derived from XPS high-scan fresh air. -blasted pristine aluminoborosilicate glass surface, assuming that the ISG glass fracture surface was identical to the bulk glass composition obtained from ICP-AES.
Atomic force microscopy
BudgetSensor HS-20MG) was used to quantify the error in the height measurement (~0.2 nm) as a function of the number of scans performed (e.g. a new AFM tip is usually used for only 10 scans). Line-by-line flattening and 1st-order plane fitting were performed on each image before analysis to remove any artifacts caused by the curvature of the piezoelectric material, sample misalignment, thermal drift, background vibrational noise, or lateral forces. Smoothing removed vertical offsets between scan lines by computing a least square polynomial fit for a scan line followed by subtraction of the polynomial fit from the original scan line.
First-order plane fit calculates a first-order fit to the image in the x and y directions and subtracts the linear fit from the image, removing tilt and misalignment of the sample. In order to monitor the morphological evolution of the glass surfaces as a function of corrosion, five 8 µm X 8 µm scans were performed on different spots of the reacted glass surfaces (using the same imaging parameters as the surface retraction imaging).
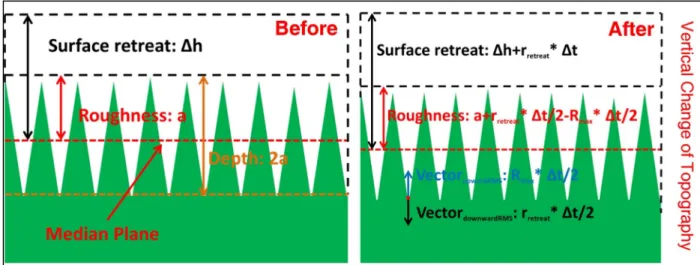
Recession rate measurement and error analysis
PSD profiles were fitted using a k-correlation model (in the frequency range 0.125 to 6.125 µm-1) and a fractal model (6.25 to 16 µm-1) to obtain equivalent RMS roughness, correlation length and Hurst exponent. The equivalent RMS, correlation length and Hurst exponent were measured as a function of corrosion to: a) quantitatively investigate the morphological evolution of glass surfaces as a function of corrosion; b) investigate the homogeneity of the spatial distribution of roughness at the corresponding spatial wavelength; The line with the higher fitted R2 value, in this case line B, was used as a slope constraint for fitting line A.
This recession rate conversion (Δh/Δt, nm/day) allows comparisons between the dissolution rates measured in this study and the dissolution rates of other glasses reported in the literature. Uncertainty x is the error of the density measurement of 0.08 g/cm3, uncertainty y is equivalent to the RMS roughness of the corroded glass surface and uncertainty z is estimated at 120 seconds. It is worth noting that the timing uncertainty consists of: a) collecting the sample from HDPE bottles after corrosion experiment; b) rinsing the sample surface with isopropanol/DI water;
Results
- Evaluation of experimental methods, strategies and hypotheses
- Surface retreat rates and dissolution rates
- Compositional and topographical evolution of reacted glass surfaces
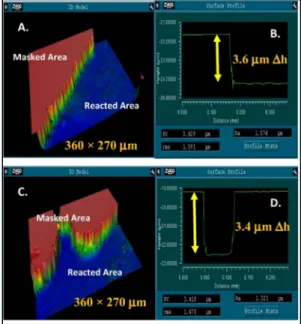
During the experiment and regardless of pH or reaction time (e.g., Figure III.6), the masked glass surface appears to be smooth, as previously quantified by the equivalent RMS (~1.7 to 1.9 nm). For a glass surface reacted at pH 10 for 24 hours (eg Fig. III.6c), the surface shrinkage was determined to be ~41.1 nm in the figure shown separately. As shown in Figure III.7, the standard error associated with each surface retreat value was negligible.
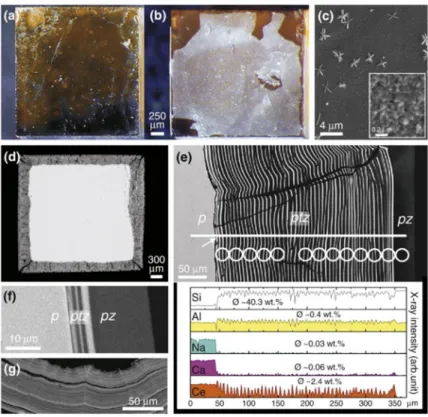
As shown in Figure III.9 (top row), the most significant compositional evolution occurred on the glass surface (reacted at pH=2, 25 oC) was the depletion of Na and enrichment of Si. All captured images (representatively shown in Figure III.10) were relatively featureless with the exception of glass surfaces that reacted at pH7 for 960 hours.
Discussion
- Validation of experimental method
- Kinetics and mechanisms of glass corrosion at pH2, 7 and 10
- Correlations between glass dissolution and roughening
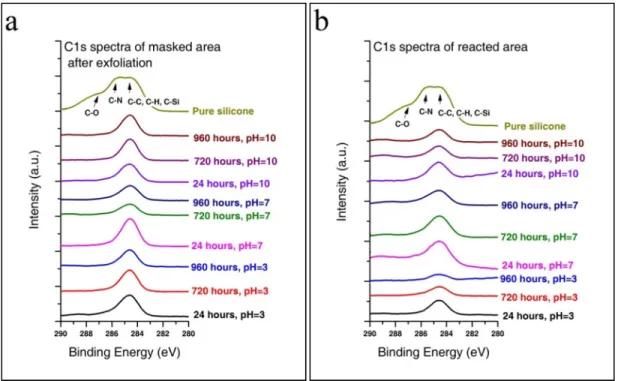
Thus, the C1s XPS spectra of cured polymeric mask, masked (after exfoliation) and reacted glass surfaces were evaluated and compared (eg Figure III.4a &b). As shown in Figure III.4b, the C1s spectra of the reacted glass surface were symmetrical and the characteristic C-N or C-O bond of the polymeric mask was absent from the spectra. Therefore, there was no phenomenon of dissolution and redeposition of the polymeric mask on the reacted glass surfaces.
It is worth noting that the surface attraction rate of the pH7 experiment was obtained by reacting the glass coupons at 90 oC. However, the return of the pH10 experiment was 12.1 nm/day in the nonlinear rate law regime.
NEW EVIDENCE OF THE INTERFACIAL DISSOLUTION
Materials and methods
- Sample preparation
- Synchrotron radiated X-ray reflectivity and X-ray diffuse scattering
- X-ray photoelectron spectroscopy
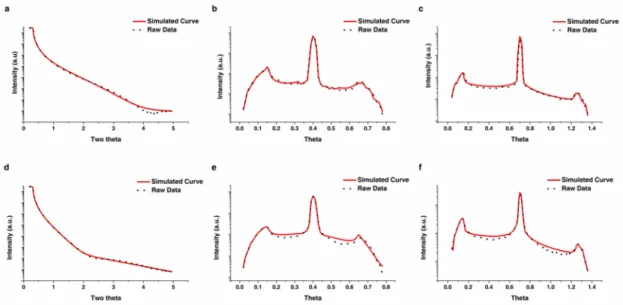
The composition of the D263 glass is particularly close to the molar ratios of nuclear waste glasses (eg SON68, a French nuclear waste glass). The shape of the direct beam was measured and adjusted to be a Gaussian distribution by changing the size of the beam slits. XRR data from 0.20 to 4.95 o were analyzed in Leptos® to obtain a better fit of the critical angle and therefore density values.
The merged XRR curve was then entered into Leptos® and the bulk density along with the composition of the D263 and SLS glass was added to the materials database in Leptos®. In equation (2), ρ is the effective electron density, r0 is the Thompson scattering length, and λ is the wavelength of the incident X-ray beam.
Results and discussion
- Determination and simulation of the origin of the dense silica layer
- Comparison between modeled and measured surface composition
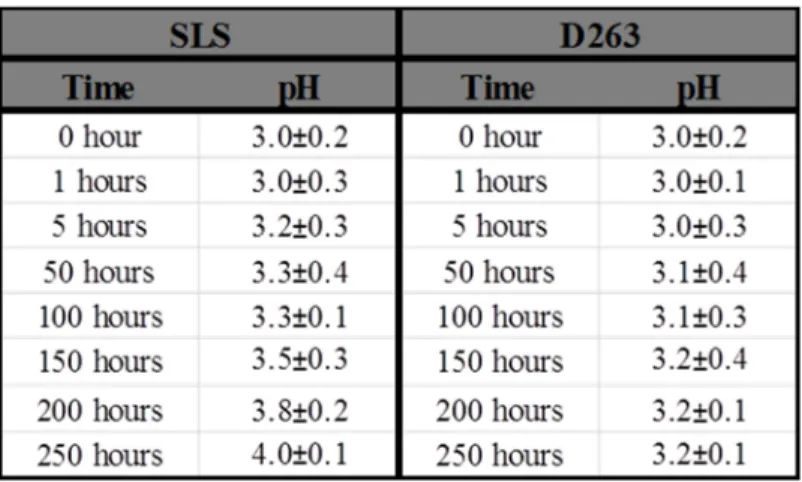
The roughness of the dealkalized glass layer increased with time for SLS and D263 sample under the two-layer construction. Given the linearity of the ionic exchange process (or called interdiffusion) as a function of time, it was reasonable that the roughness of pristine glass surface is preserved at the interface with the progress of the experiment (linear progression from de-alkalization to the pristine substrate). The density of the dealkalized glass and glass substrate remained stable throughout the experiment for D263 samples.
After the formation of the dense silica layer, the thickness of decalcified glass grew at a lower rate. However, such a role of dense silica layer as a diffusion barrier should not change the linearity of the growth of the decalcified glass layer thickness over time. The insets show the corresponding mechanism for the formation of dense silica layer, in particular the recondensation of the de-.
The composition of the dealkalized glass was also assumed to be the composition before the formation of the dense silica layer (100-hour XPS composition for SLS; 200-hour XPS composition for D263).