Binding Profiles and Transcriptomes and Therapeutic Resistance, Oh My!
The Regulation of ERα Action in Breast Cancer
By Kim Stauffer Dissertation
Submitted to the Faculty of the Graduate School of Vanderbilt University in partial fulfillment of the requirements
for the degree of DOCTOR OF PHILOSOPHY
in
Molecular Pathology & Immunology February 28, 2022
Nashville, Tennessee
Approved:
Jay Jerome, Ph.D.
Andries Zijlstra, Ph.D.
William Tansey, Ph.D.
Vivian Weiss, M.D., Ph.D.
Thomas Stricker, M.D., Ph.D.
DEDICATION
This dissertation is dedicated to the memory of:
My grandma Bonita Stauffer, who passed of breast cancer before I was able to get to know her.
My sister-in-law Cyndie Stauffer, who lost her battle with lung cancer while I was in my studies.
Her son, my nephew Jacob Stauffer, a bright young man whose curiosity and resilience will forever inspire me.
ACKNOWLEDGMENTS
The work contained within this dissertation was made possible with the financial support of the Cellular, Biochemical and Molecular Sciences Training Program (CBMS), the Vanderbilt Institute for Clinical and Translational Research (VICTR), and the National Cancer Institute (NCI). The program managers Carolyn Berry (Interdisciplinary Graduate Program, IGP), Whit Adams (retired, Pathology Microbiology and Immunology, PMI), Kristi Hargrove (formerly PMI), and current PMI program manager Liz Roelofsz have provided me with invaluable support along the way. Assistant director of the Graduate Programs in
Biomedical Sciences Beth Bowman provided me with encouragement and compassion when I needed it most. I am grateful for the guidance and feedback given by PMI DGS Jay Jerome, as well as from Jim Patton as director of the CBMS training grant. I am so appreciative of the staff at VANTAGE sequencing core for handling my sequencing samples with care and speed, as well as for teaching me how to use the chromatin sonicator. My graduate work has been enriched through the work with all my collaborators, Eric Wright, Kasia Ludwik, Luigi Formisano, Sarah Croessman, and Valerie Jansen. I am very grateful to Deb Lannigan for running a fulfilling and fun journal club for the program. Each member of my dissertation committee has
provided me with important advice, scientific and professional, that has contributed to my success in graduate school. I would also like to thank the past members of the Stricker lab, Ben Bulen, Erin Fey, Brian Cholewa, and Vivian Weiss, for being excellent coworkers. The Arteaga lab group, led by Carlos Arteaga, was instrumental to me finding my footing in the early and middle years of my graduate career. Dr. Arteaga was an excellent co-mentor to me, and his weekly journal clubs were very often a highlight of my week. I am indebted to my mentor, Tom Stricker, who never gave up on me despite all the obstacles I faced in lab and in life. He taught me not only how to code, run bench experiments, and give compelling presentations, but how to truly find the most exciting possibilities in science. I am nothing without my graduate school friends and their various forms of support, including group chats, nights dancing on Broadway, training for half marathons, and impromptu ice cream dates to cry over failed experiments. These friends include Caleigh Azumaya, Stephanie Moore-Lotridge, Diana Healey, Diane Saunders, and Meredith Frazier. I want to thank my partner in life, Spencer Alexander, for always being on my team, and for growing with me through these years. I owe the ultimate thanks to my parents, Greg and Vickie Stauffer, who have always supported me and the dogged pursuit of my dreams.
TABLE OF CONTENTS
Page
DEDICATION... ii
ACKNOWLEDGEMENTS... iii
LIST OF TABLES... vi
LIST OF FIGURES ... vii
ABBREVIATIONS ... x
Chapter I. Introduction ……... 1
Overview of Breast Cancer in the United States ...…………... 1
The Action of Estrogen Receptor Alpha in Breast Cancer...…... 2
The Use of Antiestrogen Therapy in Treating ER+ Breast Cancer... 4
History and Utility of Genomics in the Fight Against Cancer... 5
Known Causes of Endocrine Therapy Resistance...6
The Search for Unknown Causes of Endocrine Therapy Resistance...7
Thesis Aims ...9
II. MLL3 Is a De Novo Cause Of Endocrine Therapy Resistance...10
Summary ...10
Introduction ….…..………...10
Methods and Materials ...11
Results ………...…... 17
Discussion …...…...…………... 36
III. Fulvestrant/Palbociclib Resistance In ER+ Breast Cancer...39
Summary ...39
Introduction ….………...39
Methods and Materials ...40
Results ………...…... 40
Discussion …...…...…...……... 44
IV. Association of FGFR1 with ERα Maintains Ligand-Independent ER Transcription and Mediates Resistance to Estrogen Deprivation in ER+ Breast Cancer...45
Summary ...45
Introduction ……….………...45
Methods and Materials ...46
Results ………...…... 52
Discussion …...…...…………... 69
VI. General Discussion and Conclusions ... 98
ERα Cistrome in ER+ Breast Cancer ...98
Utilizing Genomic Information in a Predictive and Therapeutic Capacity...99
Additional Considerations for MLL3 Studies in ER+ Breast Cancer...103
Future Directions ... 104
Appendix A. Supplemental Tables ... 108
REFERENCES ...148
LIST OF TABLES
Table Page
2-1 Domains of MLL3 and TCGA ER+ Luminal Breast Cancer Mutations.………..………...……… 18
2-2 Categories of Regulons Affected by Knockdown of MLL3………...………... 31
3-1 Sox2 and Sox9 expression between Parental and Resistant MCF7 Cells.……...……… 43
4-1 Primer sequences used for ChIP-qPCR………...……… 48
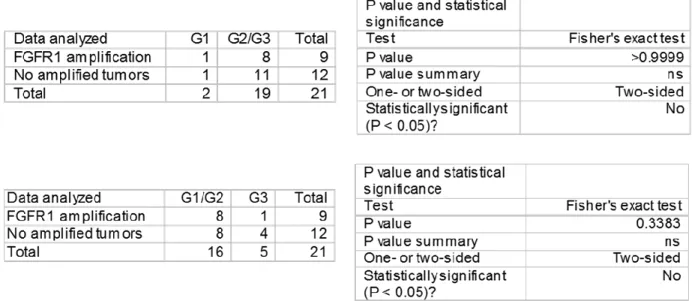
4-2 FGFR1 amplification does not correlate with a specific histological tumor grade ………...………... 54
5-1 ANOVA table for “RSK2 maintains adult estrogen homeostasis by inhibiting ERK1/2-mediated degradation of estrogen receptor alpha” figures.…... 146
5-2 Statistical analysis of gene set overlaps from the NCL populations.…………...………... 87
LIST OF FIGURES
Figure Page
1-1 Leading Types of Cancer for Estimated New Cancer Cases and Deaths………...……….. 2
1-2 The Classical Estrogen Signaling Pathway………...……….. 4
1-3 Class and Mechanism of Endocrine Therapies………...……...……….. 5
1-4 Four Molecular Subtypes of Breast Cancer…………...………...……….. 6
2-1 MLL3 is significantly mutated in ER+ breast cancer; its mutation confers poor outcome.……...………... 19
2-2 Supplement to Figure 2-1...………...………... 20
2-3 MLL3 KD Confers Endocrine Therapy Resistance...………... 21
2-4 Knockdown of MLL3 leads to a reduction in H3K4me1 that correlates with a shift in ERα-binding...………… 22
2-5 Supplement to Figure 2-4.………...……… 24
2-6 Knockdown of MLL3 and mutation of MLL3 share an MLL3-deficiency transcriptional signature ……….……… 25
2-7 Supplement to Figure 2-6………..………...……… 26
2-8 Knockdown of MLL3 in leads to a new transcriptional regulation program of ERα targets in conjunction with changes in H3K4me1 deposition...………...………... 28
2-9 Supplement to Figure 2-8……….………... 29
2-10 SP1 binding increases upon MLL3 KD in ER+ breast cancer cell line...………... 33
2-11 Supplement to Figure 2-10……...………... 34
2-12 IGV Genome Browser Snapshots of H3K4me1, ERα, and SP1 binding...………... 35
3-1 PCA Plot of RNA-seq Samples.………... ………... 41
3-2 RNA-seq Sample Distance Heatmap ………...………... 41
3-3 Heatmap of Top MSigDB Terms from GSVA………..……….. 42
3-4 SOX9 counts. …...……… 43
3-5 RB Signature Schematic for FulvPalb Resistance...………...………... 43
3-6 RB 20 Gene Signature from the Perou Group………...……… 44
4-1 FGFR1 amplification and overexpression associate with endocrine resistance in ER+ breast cancer……....…… 53
4-2 Effect of letrozole on expression and localization of FGFR1 in primary breast tumors without FGFR1 amplification... 54
4-3 FGFR1 amplification and protein expression in ER+ human breast cancer cell lines... 55
4-4 Estrogen deprivation increases nuclear and cytosolic FGFR1 expression... 56
4-5 Breast cancers with co-amplification of FGFR1 and 11q12-14 genes exhibit decreased time to recurrence... 57
4-6 FGF3/4/19 expression is upregulated upon estrogen deprivation... 57
4-7 Estrogen deprivation upregulates FGF ligand expression in ER+/FGFR1-amplified cells... 58
4-8 Long-term estradiol deprivation increases the interaction of FGFR1 with ERα... 59
4-9 FGFR1 TK activity is important for estrogen-independent growth and the association of FGFR with ERα... 60
4-10 FGF3 induces binding of ERα and FGFR1 to DNA... 62
4-11 Identification of FGF-sensitive ERα and FGFR1 genomic binding sites... 63
4-12 ER+/FGFR1-amplified tumors exhibit differential gene expression compared to ER+/FGFR1 non-amplified breast cancers... 64
4-13 Treatment with FGFs induces expression of ERα-dependent genes... 65
4-14 Treatment with INCB054828 also blocked FGF3-induced pFRS2, CAMA1 cell growth, and ERα target gene expression... 66
4-15 FGFR1 signaling is associated with ERα transcriptional activity... 67
4-16 Combined blockade of FGFR1 and ERα potently inhibits growth of ER+/FGFR1-amplified breast cancers.... 68
4-17 Treatment with the combination of fulvestrant and lucitanib inhibited growth of both PDXs more potently than either drug alone... 69
5-1 RSK2 Regulates ERα Protein Levels in the Adult Mammary Gland throughout the Estrous Cycle... 78
5-2 Estrogen responsiveness in WT and RSK2-KO mice... 79
5-3 RSK2 Maintains the EpCAMhiCD49f+Sca1+CD49b− (NCL) Population within the Adult Mammary Gland throughout the Estrous Cycle... 80
5-4 Analysis of WT and RSK2-KO mammary glands... 81
5-5 ERK1/2-RSK2 Signaling Is Activated Only in the Adult Mammary Gland... 83
5-6 ERK1/2 is active in ER+ cells... 84
5-7 RSK2 Is a Negative Regulator of ERα-Mediated Signaling... 86
5-8 Transcriptomic analysis of the NCL population... 87
5-9 RSK2 Maintains ERα Protein Levels in the Uterine Epithelium... 88
5-10 The hypothalamic-pituitary-ovarian axis is not impaired in RSK2-KO mice... 89
6-2 Schematic of MLL3/4 domains... 105 6-3 Mutations between MLL3 and PIK3CA are often co-occurring... 105
ABBREVIATIONS
Abbreviation Meaning Page
AACR AI AI ASCOM bp ChIP-seq DEG ER+
E2 ERα ERE ETR ESR1 FulvPalb GSEA GSVA HR+
IDR KD KMT2C LBD LTED ML MLL3 MSigDB NCL ORA PFS ppg PR
American Association for Cancer Research Aromatase Inhibitor
Artificial Intelligence
Activating Signal Cointegrator-2 -Containing Complex Base-pair
Chromatin Immunoprecipitation Sequencing Differentially Expressed Genes
Estrogen Receptor Positive Estradiol
Estrogen Receptor Alpha Estrogen Response Element Endocrine Therapy Resistance Estrogen Receptor 1
Fulvestrant Palbociclib Combination Gene Set Enrichment Analysis Gene Set Variation Analysis Hormone Receptor Positive Irreproducible Discovery Rate Knockdown
Lysine Methyltransferase 2C Ligand Binding Domain
Long Term Estradiol Deprivation Machine Learning
Mixed Lineage Leukemia 3 Molecular Signature Database Non-clonogenic Luminal Overrepresentation Analysis Progression Free Survival Peaks Per Gene
Progesterone Receptor
6 4 102 8 14 8 13 2 2 1 3 6 2 39 15 40 1 21 10 8 6 46 102 8 15 9 15 4 30 1
SVA TCGA TF TMD TNBC WT
Surrogate Variable Analysis The Cancer Genome Atlas Transcription Factor Transmembrane Domain Triple Negative Breast Cancer Wildtype
13 5 16 45 1 10
CHAPTER I
INTRODUCTION Overview of Breast Cancer in the United States
Breast cancer accounts for 30% of all the cancers diagnosed in women in the United States, and is the second leading cause of cancer-related death (Fig. 1-1).1 One in eight American women will be diagnosed with breast cancer during their lifetime.
Approximately 70-80% of these breast cancer cases are considered hormone receptor positive (HR+), meaning they express one or both estrogen receptor alpha (ERα) and one of its transcriptional targets progesterone receptor (PR). The other major groups of breast cancers are comprised of those that either overexpress HER2 (HER2+) or are negative for ER expression, PR expression, and HER2 overexpression. The latter are called triple negative breast cancers (TNBC) and make up 10-15% of all cases of breast cancer. HER2+ breast cancers make up 15% of cases and are eligible for treatment targeting HER2
overexpression such as trastuzumab.
To better understand how breast cancers form, normal development and maintenance of the mammary gland must be understood. Much of the development of the mammary gland occurs after birth, including the stages of ductal morphogenesis, alveologenesis, lactation, and involution. Many different cell types form this dynamic organ; a fat pad formed by adipocytes, vascular endothelial cells for blood vessels, fibroblasts and immune cells in stroma, and two epithelial compartments forming the ductal network. Basal epithelium, made of myoepithelial cells, makes up the outer layer of the gland while luminal epithelium forms ducts and secretory alveoli. The hormones and growth factors that signal for morphological changes at different stages of life are implicated in breast cancer formation.2–4 While some risk factors for developing breast cancer are straight forward, such as being a woman, advanced age, and family history of breast cancer, others are less intuitive. Breast cancer risk is indeed increased with early menarche, late menopause, late age at first pregnancy and low parity.5–7 These risk factors are heavily influenced by levels of estrogen, both endogenous and exogenous.
HR+ breast cancer cases have seen a 0.3% increase in incidence per year between 2012-2016. This increase is thought to be driven by a decline in parity rates and physical activity, and increases in age at first birth, obesity, and alcohol consumption.8 However despite this continued increase in incidence, the standard of care for HR+ cancers has remained anti-estrogen, or endocrine, therapy. While many HR+ breast cancers initially respond to anti-estrogen therapy, up to 40% of them have intrinsic potential to become resistant to endocrine therapies.9 Furthermore, almost all advanced disease patients will eventually relapse despite being given antiestrogen therapy, due to either de novo or acquired endocrine resistance.10,11 In order to better treat these patients, causes of endocrine therapy resistance must be identified. Discovery of the molecular events that allow cancer cells to circumvent treatment will not only provide further targets for additional or combinatorial therapy but will also lead to treatment-response biomarkers that inform the best treatment plan for each individual cancer patient. My thesis work focuses on the molecular underpinnings of this clinical dilemma.
Figure 1-1. Leading Types of Cancer for Estimated New Cancer Cases and Deaths. These estimates, which are based on modeled projections, are for the United States from 2020 and are rounded to the nearest 10. Basal cell and squamous cell skin cancers, and in situ carcinoma other than bladder are excluded. This figure and its legend are taken from Siegel et. al.12 The Action of Estrogen Receptor Alpha in Breast Cancer
To better understand how HR+ breast cancer cells survive and proliferate despite anti-estrogen therapy, first the importance of estrogen receptor signaling to breast cancer cell behavior must be grasped. Because of the central role the estrogen receptor has in breast cancer behavior, I will refer to HR+ cancer as ER+ cancer from now on. Estrogen receptors are nuclear hormone receptors that act as transcription factors. The main estrogen receptor that functions in breast cells is ERα, the protein product of gene ESR1 (Estrogen Receptor 1).13 Its behavior is regulated by estrogens, steroid hormones derived from cholesterol that diffuse across the plasma membrane. The main circulating estrogen, 17-β estradiol or E2, is responsible for many physiological maintenance processes. These include, but are not limited to, maintenance of bone mass and cognitive function, regulation of insulin responsiveness, and development of secondary sex characteristics.14 Deregulation of estrogen signaling is involved in pathophysiological processes, such as the initiation and development of ovarian, endometrial, and breast cancers.15
Estradiol can signal through several interconnected pathways; one of the most important to ER+ breast cancer is the ERα canonical signaling pathway which I will focus on here (Figure 1-2). The Cys447 residue of ERα is palmitoylated with help from heat shock protein 27; this allows ERα to interact with caveolin-1 for the transport of the receptor to the cell
membrane.16–19 ERα monomers bind to E2 which induces their dimerization.20 Depalmitoylation of dimerized ERα leads to decreased association with caveolin-1, and the receptor dimer travels to the nucleus. Here E2-bound ER dimers either bind directly to the DNA to regulate transcription at estrogen response elements (EREs), or indirectly via interactions with other transcription factors that act as co-regulators of transcription of its gene targets. EREs are palindromic DNA sequences usually
found in the distant enhancers of target genes.21–23 They consist either mostly or exactly of the consensus sequence 5′‐
GGTCAnnnTGACC‐3′, where ‘n’ is a nonspecific nucleotide.24 Coregulators are recruited to the ERα binding sites to modulate the target gene transcription.25 Some of these coregulators recruit chromatin-modifying proteins to aid in activation or repression of the transcriptional target.26 Importantly, pioneer factors such as FOXA1, GATA3, and PBX1 assist in creating an open chromatin conformation for ER-chromatin interactions.27–29 Once bound to the chromatin either directly or indirectly through coregulators such as AP1 or SP1, ERα and the enhancer region is looped over to interact with the transcriptional machinery at the proximal promoter region of the target gene.
ERα is the major effector of estrogen signaling that leads to breast cancer growth in a hormone-dependent setting.30 The nuclear receptor regulates the transcription of many target genes important to the survival and proliferation of breast cancer cells. In fact, two of the earliest defined targets of ERα in the history of estrogen receptor research include c-MYC and cyclin D1. Examples of the consequential genes estradiol can stimulate transcription of through ERα are both the oncogene c-MYC, involved in mitogen-stimulated cell growth31, and cyclin D1, which initiates progression past phase G1 of the cell cycle.32 Furthermore, ERα propels oncogenic properties in breast cancer through controlling the expression of GREB1, which contributes to cell growth, PR, which utilizes paracrine signaling to induce proliferation of neighboring cells, and Fos, which transcriptionally regulates proliferation and survival genes in combination with Jun.33,34 ERα also regulates the transcription of Wnt11, an anti-apoptotic factor that increases breast cancer cell survival.35 These genes are only a few of the well-known targets of ERα transcriptional control; they exist in networks of tens of hundreds of genes that the estrogen receptor regulates transcription of to drive ER+ breast cancer. These networks form the basis for molecular subtypes, summarized later in this chapter, and are the reason that antiestrogen therapy targeting their expression has been a mainstay of ER+ treatment for several decades.
Figure 1-2. The Classical Estrogen Signaling Pathway. First estrogen (E2) binds to ERα, causing a release from its chaperones, or receptor- associated proteins, and inducing dimerization of the E2-ERα
complexes. The E2-ERα dimer translocates to the nucleus and binds estrogen response elements in the DNA. The hormone–receptor complex thus initiates transcription of its targets. This figure is from Gruber et al.36
The Use of Antiestrogen Therapy in Treating ER+ Breast Cancer If nuclei-localized ERα is detected with diagnostic testing, breast cancer patients qualify to be treated with anti-estrogen therapy (Figure 1-3).
For most patients this looks like a combination of the available classes of antiestrogens, as combination therapies are more successful at achieving tumor regression than monotherapy.37 Part of the
combination therapy includes selective estrogen receptor modulators (SERMs), of which tamoxifen is the most widely used.38,39 This category of drugs works in competition with E2 by binding to ERα, such that the resulting ERα structure can no longer recruit cofactors at the same capacity.38 The other two categories of antiestrogen therapies are selective estrogen receptor downregulators (SERDs), and aromatase inhibitors (AIs). SERDs, of which the most widely used is fulvestrant, bind to ERα to induce a structural change disallowing cofactors interactions and marking the receptor for proteasomal degradation.40 AIs come in two flavors: Type I AIs like exemestane are steroidal and irreversibly bind to aromatase, the enzyme that converts androgens to estrogens, causing permanent inactivation and eventual degradation.
Type II AIs like anastrozole and letrozole are non-steroidal; they compete with androgens by reversibly binding to aromatase.41,42
Despite the initial tumor regression achieved by tamoxifen treatment in many cases of ER+ breast cancer, almost half of patients with advanced cases of ER+ breast cancer present with de novo endocrine therapy resistance. This situation is defined as primary resistance, or disease progression within 6 months of antiestrogen therapy in advanced breast cancer.
Furthermore, metastatic cases eventually stop responding to tamoxifen.10,11 This situation is defined as acquired resistance, or disease progression after at least 6 months of antiestrogen therapy in advanced breast cancer.43 However, most patients who have clinical relapse after initial success with tamoxifen present with retention of ERα expression. Furthermore, clinical trials show that SERD fulvestrant extends progression-free survival (PFS) in patients who became resistant to tamoxifen.44–47 Thus, ERα continues to play an important role in breast cancers that never respond or stop responding to tamoxifen.
Figure 1-3. Class and Mechanism of Endocrine Therapies. In Panel A, several tissues such as the ovaries and adrenal glands produce androgens that aromatase converts to estrogens. The classical estrogen signaling pathway follows. In Panel B, aromatase inhibitors block the
aromatization of androgens to estrogen. Panel C shows selective estrogen receptor modulators that compete with estrogen binding to ERα.
While ER dimers bound by SERM may still interact with chromatin, their association with co-repressors (CoR) inhibits transcriptional activation of ERα targets in the breast. Lastly Panel D exhibits selective estrogen receptor downregulators, which impair the translocation of ER dimers to the nucleus, lower the
accessibility of the chromatin for the ER dimer, and lead to faster ER turnover by degradation.
This figure is from Hanker et al.48
History and Utility of Genomics in the Fight Against Cancer
The advent of genomics has allowed for deeper classification of breast cancers that, in combination with histological
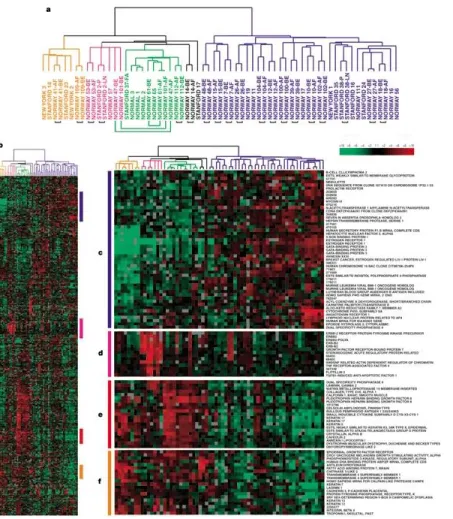
categorization, inform not only the course of treatments available but also the projected behavior and response of the cancer to treatment. Histological categorization of breast cancer utilizes growth patterns and cytological features to distinguish between subtypes, the majority of which are either ductal or lobular. Molecular markers are routinely included in the categorization to better determine treatment strategies and prognosis, including ER, PR, HER2, and p53.49 Molecular categorization arose when Perou et al. published a seminal molecular portraits paper in 2000, based on gene expression patterns from 65 surgical human breast tumours.50 This work used hierarchical clustering of expression data using arrays, and established four subtypes of breast cancer: ER+/luminal-like, basal-like, HER2-enriched, and normal-breast like (Figure 1-4).
These groupings mostly, but not completely, overlapped with ER+/PR+, HER2+, and TNBC, with luminal A and luminal B as two different subtypes of ER+ breast cancer.
Since this original paper has been published, molecular subtypes have been expanded on the basis of further human and murine breast tumor gene expression data to six types overall: claudin-low, basal-like, HER2-enriched, normal breast-like, luminal A, and luminal B.51–53 The clinical heterogeneity of ER+ BRCA is captured in these expression profiles as well as mutation profiles. Information about risk of recurrence and response to therapy gleaned from the combination of histological and molecular subtypes has become integral to breast cancer management plans.54,55 Gene expression assays like Oncotype DX takes advantage of this fact; it uses a 21 gene expression panel to stratify ER+ HER2- breast cancer patients into low,
intermediate, or high-risk of recurrence after surgical resection. Schaafsma et al. showed that over its first decade of clinical use, Oncotype DX was associated with decreased adjuvant chemotherapy usage and increased survival.56
give clues to the driving force behind expression profiles and therefore tumor behavior, as well as providing possible biomarkers for PFS or response to therapy, and potential targets for therapy. Some databases only contain sequencing information from pre-treatment primary tumors, such as the TCGA breast cancer dataset, which can be utilized to look for de novo causes of ETR. Some databases contain sequencing information from tumors that have been exposed to general
chemotherapy or targeted therapy, which can lend information about both de novo and acquired ETR. With the abundance of tumor sequencing data that has resulted from the decreased cost of sequencing technologies, it is now well established that a patient’s breast cancer can have different genomic profiles between tumor cells at primary site and metastatic site. To this end, sequencing data from longitudinal studies that include initial biopsy, biopsy after treatment, and/or biopsy of metastatic cancer provide clues about the genomic changes contributing to the behavior of breast tumors in response to therapy.57,58
Figure 1-4. Four Molecular Subtypes of Breast Cancer. Dendrogram branch colors indicate subtype:
basal-like, orange; HER2+, pink; normal-breast-like, light green; and luminal epithelial/ER+, dark blue.
Panel A is a close-up of the breast tumor sample cluster dendrogram. Panel B shows the intrinsic cluster diagram, which is enlarged for the four subtype clusters in Panels C-E, which show the luminal epithelial/ER gene cluster, HER2+ gene cluster, a basal epithelial cell-associated cluster containing keratins 5 and 17 and a second basal epithelial-cell-enriched gene cluster, respectively.
This figure is from Perou et al.50
Known Causes of Endocrine Therapy Resistance Several different avenues for resistance to
antiestrogen treatment have been identified in ER+
breast cancer. While loss of ERα is perhaps the most obvious explanation for endocrine therapy resistance, only about 10% of breast cancers with ETR exhibit loss of ER.59 The targets of antiestrogen therapy, E2, ERα, and aromatase, have evaded the effects of the drugs in other ways as well. ESR1 acquires mutations in its ligand-binding domain (LBD), usually at Y357 and D538, in approximately 20% of recurring ER+
breast cancer cases.60,61 Additionally the gene encoding aromatase, CYP19A1, is amplified in 21.5% of patients that relapse after being treated with AIs.62
Antiestrogen treatment can fail when ERα becomes reactivated independently of estrogen, as well. This reactivation can stem from altered interactions with its coactivators or corepressors. For example, MYC, CTCF, TBX3, and FOXA1 are mutated or amplified in many cases of ETR breast cancers.63 FOXA1, which is amplified or overexpressed in tumors that have decreased PFS under tamoxifen treatment, reprograms its own cistrome to evade the effects antiestrogen therapy.64,65 ERα can also engage in compensatory crosstalk with other oncogenic signaling pathways to become reactivated. These signaling pathways include, but are not limited to, EGFR, HER2, PI3K/mTOR, and RAS/RAF/MEK/ERK. EGFR is amplified in about 2% of
metastatic breast cancers with ETR.63 FGFR is amplified in approximately 15% of metastatic breast cancers; its amplification promotes ETR by enabling estrogen-independent transcription of ER target genes.66 Other routes to ETR involved with oncogenic signaling pathways include activating PIK3CA hotspot mutations acquired after fulvestrant treatment67, HER2 amplification68, or activating mutations of HER2 which are found in approximately 5% of ETR non-HER2 amplified metastatic breast cancers.69,70 NF1, a negative regulator of RAS, can also promote ETR through loss-of-function alterations.71,72(p1)
The Search for Unknown Causes of Endocrine Therapy Resistance
ER+ breast cancer is heterogenous in behavior, and this heterogeneity is reflected in the transcriptional profile both pre- and post-therapy. ERα is a tentpole driver in breast cancer, and even in tumors resistant to antiestrogen therapy it remains important to tumor behavior. In fact, ERα expression is maintained in ~80% of tumors resistant to antiestrogen therapy.73 ETR tumors still recruit ERα to chromatin, but the DNA regions it binds to are associated with poor clinical outcome.
Furthermore, these new binding locations of ERα correlate with gene signatures predicting poor clinical outcome.74 Enhancer- specific chromatin marks and chromatin openness shows differential patterns between breast cancer cells susceptible and resistant to antiestrogen therapy as well.73 Sequencing data has also shown that certain recurrent mutations are correlated with clinical features of ER+ breast cancer that can be mapped back to molecular pathways involved in tumorigenic behavior.
For instance, MAP3K1 is recurrently mutated in ER+ breast cancer that has luminal A molecular classification and low proliferation, but TP53 is recurrently mutated in ER+ breast cancer with luminal B molecular classification and higher proliferation.75
With the correlation between ERα binding profile, chromatin landscape, mutational profile, and their shared ties to response to endocrine therapy, the regulation of ERα transcription factor activity is undoubtedly consequential to breast cancer
behavior. Even without this knowledge of the above correlations, the fact that typically only a few thousand of the hundreds of thousands of EREs in the breast cancer genome are bound by ERα demonstrates that its regulation is more dynamic and complex that relying on simple binding motifs. Understanding the mechanisms that shape the ERα transcriptome in different settings gets us closer to fully understanding the causes of endocrine therapy resistance.
Despite the abundance of explanations for endocrine therapy resistance listed above, only ~40% of cases of ETR are explained by known mechanisms.63 To search for currently unidentified causes of antiestrogen therapy resistance in ER+ breast cancer, we can utilize the mutational profile of publicly available breast cancer cases that have been sequenced, as the underlying molecular contributors to cancers can often be found in mutational information.76 Several ongoing sequencing projects already exist for exactly this purpose; among the most prolific of these are The Cancer Genome Atlas (TCGA), Genomics Evidence Neoplasia Information Exchange (GENIE), and Catalogue of Somatic Mutations In Cancer (COSMIC). Across these databases of sequencing information, there are many categories of genes that are recurrently mutated. The wealth of mutations in
chromatin modifying-enzymes implicates alterations in the chromatin landscape in cancer. In fact, the 2013 TCGA Pan-Cancer
located on (H3K4, H3K27, H3K9, H4K20, H3K36, etc.), the other histone marks nearby, and whether the DNA element it’s marking is a promoter or enhancer. The histone mark H3K4me1, for instance, marks enhancers as poised for transcription if no H3K27ac is present and active if it is.78,79 Interestingly, ChIP-seq, RNA-seq, and whole exome sequencing have connected changes in epigenetic marks with mutations in chromatin-modifying proteins.80 Some alterations in the epigenome, such as in H3K4 methylation levels, are associated with poor prognosis in breast cancer.81 Changes in epigenetic marks such as histone methylation disrupt the function of enhancers, which are vital to the full activity of gene expression82,83. Accordingly, this disruption is involved in cancer development.79,84
Given the regulatory control that histone modifiers have in determining enhancer function, the frequency of mutations in histone modifiers in breast cancer, and the dysregulation of enhancers that is often seen in cancer, we decided to investigate what histone modifiers are recurrently mutated in ER+ breast cancer. Mutated in approximately 7-10% of breast cancer75,77,85–
88, MLL3 (mixed lineage leukemia 3), also known at KMT2C (lysine methyltransferase 2C), is one of the most frequently mutated histone modifiers in breast cancer. It serves as a major histone methyltransferase for H3K4 monomethylation along with MLL4/KMT2D.89 The two histone modifier paralogues belong to a histone modifying complex called ASCOM or Activating Signal Cointegrator-2 -Containing Complex, which features either of the histone methyltransferases but not both. H3K4me1 is a chromatin mark that can help poise or activate enhancers for transcription. In addition, MLL3 aids in recruiting
p300/CBP,90,91 and leading KDM6A, another member of ASCOM, to remove H3K27me3 so p300/CBP can create H3K27ac for complete enhancer activation.92 To successfully methylate histone H3K4, MLL3 must be bound to two of the other ASCOM members, ASH2L and RBBP5.93
Considering that ERα functions mainly at enhancers, MLL3 is an important effector of enhancer function, and MLL3 is recurrently mutated in ER+ breast cancer, we decided to focus our investigation on the role MLL3 may play in endocrine therapy resistance. While MLL3 is involved in the epigenetic activation of ERα transcription94, it also binds to pioneer factor FOXA1 to cooperate in opening up chromatin conformation for ERα transcriptional control.95(p3) In addition, mutation of MLL3 leads to a shorter PFS in patients with ER+ breast cancer on antiestrogen therapy,96 and has been identified as a driver of metastatic cancer.97 These pieces of evidence show the importance of MLL3 function to the action of ERα.
While it is clear within the literature that MLL3 is involved in the regulation of ER+ breast cancer transcriptomics, it is not entirely known how MLL3 loss or mutation affects the binding profile and transcriptional output of ERα. Moreover, other sources of regulation of ERα transcriptional activity and thus mechanisms of endocrine therapy resistance are important to the discovery of biomarkers for treatment response and potential therapeutic targets. Looking again at sequencing
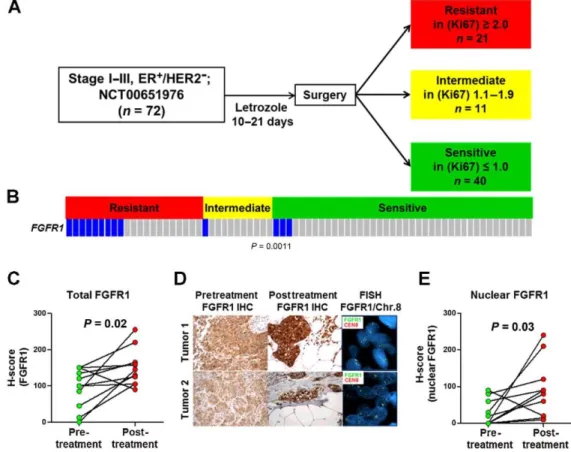
information for breast cancers, FGFR1 amplification is seen in 10% of ER+/HER2- breast cancers. This molecular alteration is associated with early relapse following adjuvant tamoxifen therapy and with poor survival.98 Treatment settings can also be a driving force behind resistance to combinatorial targeted therapies commonly used to treat ER+ breast cancer. Acquired resistance to fulvestrant and palbociclib presents a molecular setting which, once unraveled, will lead to better biomarkers and treatment plans for ER+/HER2- breast cancers. Even the mechanisms behind regulation of ERα degradation are connected to expression of estrogen target genes and therefore risk for developing breast cancer. Thus the aims of my thesis work are as follows.
Thesis Aims
The overall goal of my dissertation research was to further understand how ERα transcriptional activity is regulated in ER+
breast cancer, and to find biomarkers that could inform cancer prognosis, response to endocrine therapy, and potential targets for further therapy. This was accomplished by utilizing RNA-seq data from ER+ breast cancer cell lines and ER+ breast cancer patients, as well as ChIP-seq data from those cell lines, followed by bioinformatic analyses.
The majority of my work was focused on how MLL3 affects the transcriptional activity of ER+ breast cancer cells when lost or mutated. This part of my research had the specific aims to (a) identify the changes in regulation and output of ERα
transcriptional activity upon loss of functional MLL3 and (b) identify the effect of loss of functional MLL3 on endocrine therapy resistance in breast cancer cells. For this research I used ChIP-seq and RNA-seq data generated from knock-down and control cell lines to identify shifts in ERα binding and gene expression caused by loss of MLL3 function. I also analyzed TCGA breast cancer RNA-seq expression data to identify genes that are differentially expressed under MLL3 mutation. Secondly, I utilized cell-based assays with knockdown and control cell lines to identify oncogenic properties and endocrine therapy resistance caused by loss of MLL3 function. I hypothesized that mutation or loss of MLL3 will shift both the enhancer and ERα genomic landscapes, and that this shift will affect ERα transcriptional response and biological behavior such as endocrine therapy resistance. The results of this study can inform future studies of ER biology, and of MLL3 biology in the context of breast cancer. Predictive information can also be gained through discovering the effect of MLL3 mutation on endocrine therapy response, and specific vulnerabilities of MLL3 mutant ER+ tumors identified during the project will lead to targeted therapies.
The other chapters included in this dissertation were completed as collaborations with peers also investigating the regulation of ERα in ER+ breast cancer. The aim of the third chapter was to investigate the transcriptional patterns associated with acquired resistance to combinatorial treatment of fulvestrant and palbociclib in ER+ breast cancer cells, a common therapeutic plan for many ER+/HER2- breast cancers. The aim of the fourth chapter was to determine the relationship between
transcriptional regulation activity of FGFR1 and ERα in ER+/FGFR1–amplified breast cancer cells in the context of endocrine therapy, given that FGFR1 amplification is present in 10% of ER+/HER2- breast cancers and is associated with poor clinical outcome. Lastly, the aim of the fifth chapter investigates the regulation of ERα homeostasis with respect to the balance between its degradation and transcriptional activity. The transcriptional divergences between non-clonogenic luminal (NCL) cells of mice to delineated the relationship between estrogen-responsive gene expression, estrogen abundance, and RSK2 status, an effector of ER homeostasis. The results of these studies provide further information about the regulation of ERα activity as well as mechanisms of resistance to endocrine therapies. Overall my thesis work contributes to the understanding of ERα genomic regulation in the context of ER+ breast cancer and endocrine therapy.
CHAPTER II
MLL3 IS A DE NOVO CAUSE OF ENDOCRINE THERAPY RESISTANCE
This section is a paper published in Cancer Medicine as “MLL3 is a de novo Cause of Endocrine Therapy Resistance”
Kim Stauffer*, David Elion, Rebecca Cook, and Thomas Stricker.
Summary
I initially identified MLL3 as a recurrently mutated gene of interest in breast cancer upon reading the 2013 Nature paper
“Mutational landscape and significance across 12 major cancer types”. Upon further research of literature on MLL3 and its complex ASCOM, I hypothesized that the mutation of MLL3 would alter the H3K4me1 landscape of the breast cancer genome. I considered the significance of estrogen receptor alpha (ERα) binding profile on the behavior of ER+ breast cancer and
hypothesized that the altered H3K4me1 landscape could affect ERα binding. I believed this would in turn alter the
tumorigenic tendencies of the cancer. This hypothesis formed the basis of my thesis project, and eventually became my first author paper.
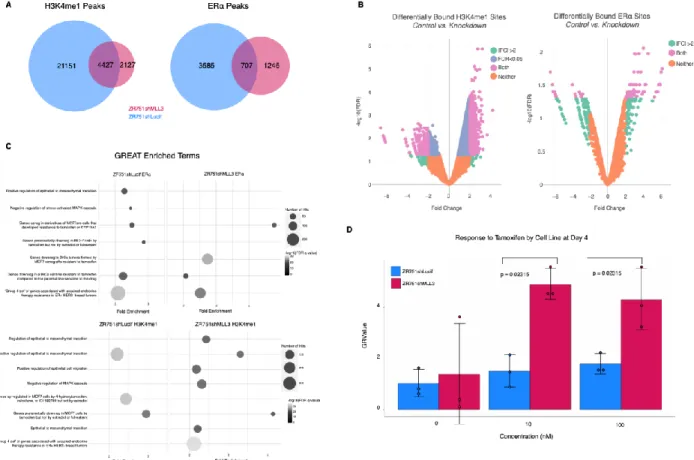
For this project I chose to utilize an ER+, MLL3 wildtype breast cancer cell line, ZR751. After lentiviral knockdown (KD) of MLL3 in these cells, I worked on proliferation assays to compare the response of MLL3-KD and WT cells to two common endocrine therapies, fulvestrant and tamoxifen. With the help of David Elion, I was able to show endocrine therapy resistance (ETR) in the MLL3-KD cells. From this point, I performed RNA-seq and ChIP-seq to interrogate the accuracy of my hypothesis.
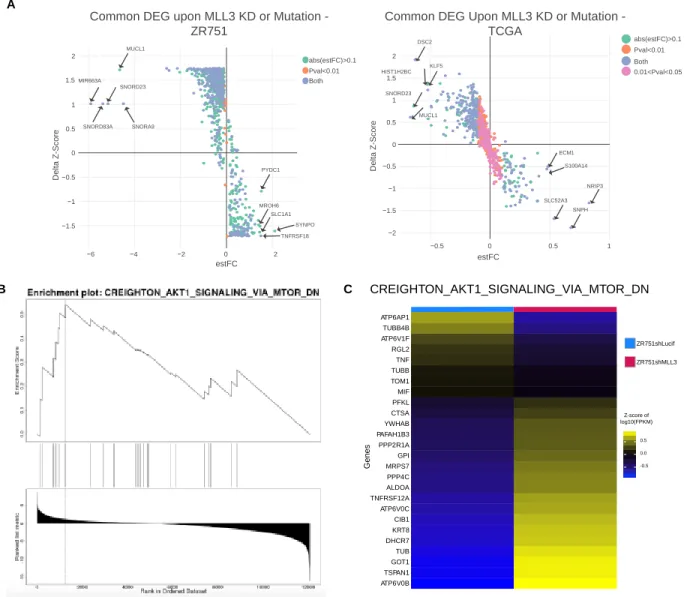
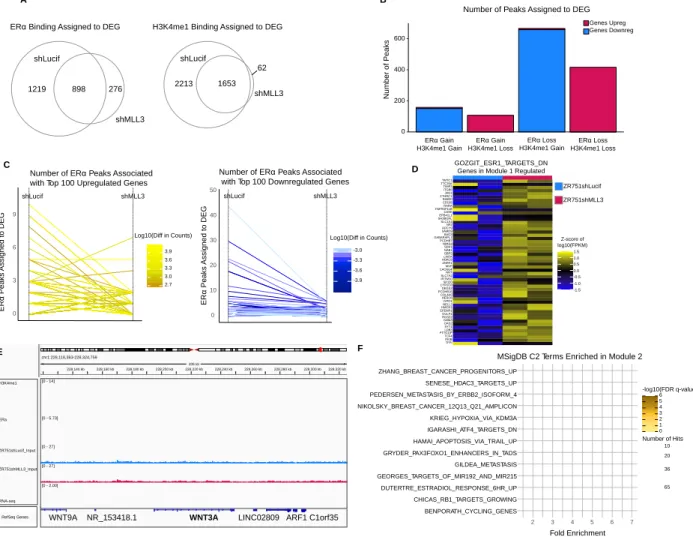
Coupled with RNA-seq data from TCGA ER+ breast cancer cases, downstream analyses focused on differential gene expression, changes in the enhancer landscape as defined by H3K4me1, changes in the ERα binding profile, and the intersection of the three.
This study identified MLL3 mutation as a cause of de novo endocrine therapy resistance in ER+ breast cancer. Although MLL3 is only mutated in ~10% of ER+ breast cancers, it is likely that this accounts for a large portion of breast cancers with unexplained causes of endocrine therapy resistance. The full manuscript, of which I am first author, is reproduced below.
Introduction
Breast cancer is the second most commonly diagnosed cancer in American women and 75% of cases are estrogen-receptor positive (ER+). Anti-estrogens are the first line of therapy, however 80% of women present with (de novo) or develop (acquired) endocrine therapy resistance.99 Disease recurrence and drug resistance are major drivers of mortality in ER+
breast cancer. While some causes of endocrine therapy resistance, such as ESR1 mutation, HER2 amplification, and
FGFR1/CCND1 amplifications are known,100-101 ~60% of cases do not have an identified mechanism.63 Furthermore, only 50- 70% of ER+ patients respond to initial endocrine therapy, highlighting a need for de novo resistance biomarkers. Improved understanding of the mechanisms of endocrine resistance will guide therapeutic development.
ChIP-Seq studies show tumors that respond poorly to endocrine therapy have a unique set of ERα genomic binding locations.74 Furthermore it has been shown that ER+ breast cancer can adapt to estrogen deprivation through epigenetic reprogramming at enhancers.73 These patterns therefore suggest that genes regulating ERα binding may affect/alter endocrine therapy
responsiveness. One such gene that has been shown to regulate nuclear receptor activity102 is MLL3, the 6th most frequently mutated gene in ER+ breast cancer.103 MLL3 primarily monomethylates H3K4 to mark enhancers. Interestingly, ERα binding sites regulate gene transcription largely from enhancers. In MCF7 cells the pioneer factor FOXA1 has been shown to recruit MLL3 to demarcate enhancers for ERα.95 Further implicating the monomethyltransferase as an important regulator of ERα binding, MLL3 possesses LXXLL domains known to interact with nuclear hormone receptors such as ERα.104
Recurrent MLL3 mutation was first identified in acute myeloid leukemia (AML), where it was determined to be a
haploinsufficient tumor suppressor.105 Similarly, MLL3 is recurrently mutated in ER+ breast cancer.106,103 These mutations are predicted to be functional and therefore drivers.107,108 Not only is MLL3 recurrently mutated, its mutation is also associated with more aggressive disease characteristics both in vitro109,110 and in vivo.111-96
Given the above observations, we predicted that mutation of MLL3 will shift both the enhancer and ERα genomic landscape, and that this shift will affect transcriptional control by ERα and biological behavior such as endocrine resistance.
Methods and Materials
GERP analysis
Hg 19 base-wise GERP scores were downloaded from http://mendel.stanford.edu/SidowLab/downloads/gerp/.112 To find average GERP scores for the missense mutations in each gene we used 595 TCGA ER+ luminal breast cancer cases and found the GERP score for the location of each missense mutation for the following genes: MLL2, PIK3CA, PTEN, and TTN. We calculated GERP averages for each set of missense mutations. We then selected a corresponding number of GERP scores from the entire coding sequence that would potentially lead to missense variants of each gene at random and calculated the average of those GERP scores. We repeated the random selections and average calculation 10,000 times. To get a value of significance, we divided the number of times a random selection GERP average was greater the actual mean GERP score of our gene of interest by 10,000. Values less than 0.05 were considered significant.
Cell culture and antibodies
ZR751 cells (RRID CVCL_0588) were obtained from the Lannigan laboratory113 and grown in RPMI (Sigma Aldrich
#R8758500ml) supplemented with 10% heat-inactivated FBS (Corning™ #35016CV), 0.002% insulin (Sigma Aldrich
#11376497001) and 50 IU penicillin, 50 mg/mL streptomycin (Corning™ #MT30001CI). HEK 293T cells (RRID CVCL_0063) were obtained from the Lannigan laboratory113 lab and grown in DMEM with high glucose, L-glutamine, phenol red, but not sodium pyruvate (Sigma Aldrich D0819-500ML), 5% FBS, 1% Pen/Strep, and 1% Sodium pyruvate (Sigma Aldrich S8636- 100ML). The cell culture incubator parameters were as follows: 37˚C, 95% relative humidity, and 5% CO2 concentration. The antibodies used for ChIP-seq were anti-Erα (Santa Cruz Biotechnology sc-543X), anti-H3K4me1 (Abcam ab8895), anti-SP1
worked were then isolated with QIAprep Spin Miniprep Kit (Qiagen 27104), digested, and ligated into pLVTH114 (Addgene 12262) for transformation into STBL3 cells. A QIAGEN Plasmid Plus Maxi Kit (Qiagen 12963) isolated the pLVTH for transfection into HEK 293T cells, from which lentivirus was collected. The oligo sequence used to silence MLL3 was 5° - CCGGCGCACCTTATAGTAAACAGTTCTCGAGAACTGTTTACTATAAGGTGCGTTTTT -3°, taken from The RNAi Consortium.115 Negative control Luciferase shRNA Control was donated by the Lannigan laboratory.116 Cells were stably transduced at 100,000 cells per well in a 6-well plate (Corning 3516) with 4 µl lentivirus, and subsequently flow sorted for GFP expression and propidium iodide (Sigma Aldrich P4864) staining after 3 days. qPCR was performed in biological triplicate to check shRNA KD 3 days after transduction. Experiments were performed in multiple, but early (<=10) passages of the stably transduced cell lines.
RNA-Seq
Cells were harvested at steady-state using the RNAEasy Kit (Qiagen 74104). RNA samples of 600 ng were subjected to Turbo DNAse (Thermo Scientific #AM2238) and Superscript III RT (ThermoFisher 18080093) with Random Hexamers
(ThermoFisher N8080127) and dNTPs (ThermoFisher 18427088). qPCR was performed with 2 µl cDNA, 0.5 µl of 10 mM forward and reverse primers each, 10 µl SYBR Green (ThermoFisher 4364346), and 7 µl water in the Molecular Cell Biology Resource Core at Vanderbilt (BioRad CFX96 Touch Real-Time PCR Detection System). An initial denaturation and enzyme activation step of 95°C for 3 minutes was performed, followed by 40 cycles of 95°C for 10 seconds to denature and 55°C for 30 seconds to anneal, and finally a melt curve. Reactions were performed in biological triplicate using SYBER green PCR Master Mix (Thermo Scientific #4344463), and results were analyzed using the delta-delta Ct method. The average of the three biological replicate Ct values for the reference GAPDH gene was subtracted from the 3 individual biological replicate Ct values for the target MLL3 gene. A t-test was performed on the resultant two groups of delta Ct values to give a p-value of 0.0193. The Ct values ranged from 11.77 to 25.06. The qPCR was performed three times to obtain a working assay. The primers were ordered from the DNA Core at Vanderbilt from Sigma Genosys as follows: MLL3 forward, AACTCACGACCACCATCTCC, MLL3 reverse, TCTGGAGGTTTTGCATAGGG, GAPDH (control) forward, GTGAAGGTCGGAGTCAACGAPDH (control) reverse,
CCCATACGACTGCAAAGACC. RNA quality was assessed in VANTAGE via Invitrogen Qubit and Agilent BioAnalyzer and samples with RIN >7 were used. RNA libraries were generated with two biological replicates of 2 μg RNA using Illumina’s TruSeq Stranded Total RNA Sample Prep Kit (20020597). Libraries were sequenced at VANTAGE with PE75 to a depth of
approximately 30 million reads per sample on an Illumina HiSeq3000 (Table 2-10). Quality of NGS data was assessed using FastQC, and adapters/low quality bases were trimmed from reads using fastq-mcf from ea-utils, with minimum quality of 7 and minimum length of 25. Fastq files from 595 breast invasive carcinoma samples in TCGA were downloaded from the Cancer Genomics Hub (https://browser.cghub.ucsc.edu/). Tumor classification data was obtained from the TCGA Data Portal
(https://tcga-data.nci.nih.gov/tcga/). RNA-seq reads, both in-house and from the TCGA, were aligned to the human genome (hg19) with Tophat (v2.0.13), quantified using cufflinks (v2.2.1) and normalized using cuffnorm (v2.2.1).117
Differential Expression Analysis
For ZR751 RNA-seq, differential expression analysis was performed in Rstudio v3.6.1 using a gene-by-gene linear regression model with ANOVA taking MLL3 knockdown status into account. Genes with a mean expression level of log2(fpkm+0.5) greater than 1 were kept for the analysis. A log2(fpkm+0.5) transformation was used on the gene expression table. The sva (surrogate variable analysis) package in Bioconductor was utilized to remove batch effects.118 DEG were identified as those with an ANOVA FDR q-value less than 0.05; q-values were calculated using the qvalue package in R.
For TCGA RNA-seq, we limited our search to breast cancer cases that were marked as ER+ in the clinical file. To decrease the variance in the control ER transcriptional activity profile, we also limited the breast cancer cases that were marked as molecular subtypes luminal A and luminal B in the clinical file. Samples that did not have information in the clinical file were discarded. Samples with an internal size factor of less than 0.35 were discarded from the analysis. Samples from men were excluded. Genes with a mean expression level of log2(fpkm+0.5) greater than 1.5 were kept for the analysis. A transformation of log2(fpkm+0.5) was performed on the gene expression set. The sva (surrogate variable analysis) package in Bioconductor was utilized to remove batch effects.118 A gene-by-gene linear regression model with multivariate ANOVA accounting for histological subtype, molecular subtype, and MLL3 mutation status was utilized to find differential gene expression. DEG were identified as those with an ANOVA FDR q-value for the MLL3-mutation status variable less than 0.05; q-values were calculated using the qvalue package in R.
ChIP-seq
ChIPs were performed for two biological replicates, for one experimental repetition. Cells were grown to 80% confluency, washed 3 times in ice-cold PBS (8 g NaCl, 0.2 g KCl, 1.44 g Na2HP04, 0.24 g KH2PO4, H2O up to 1 L, adjusted to pH 7.4 with HCl) and then fixed for 10 minutes at room temperature using 1.85% formaldehyde (50 ml cold PBS, 2.5 ml 37% formaldehyde solution Sigma Aldrich 252549), followed by quenching with 2.5 ml of 2.5 M glycine (93.8 g glycine Sigma Aldrich G7126 in 500 ml H2O) for two minutes at room temperature. After aspirating and washing with 50 ml cold PBS, we lysed the cells using 20 ml Farnham lysis buffer (5 mM HEPES pH 8, 85 mM KCl, 0.5% NP-40) and 400 µl protease inhibitor cocktail (PIC, Roche 11873580001) to scrape the cells off (Corning™ 3008) into a 50 ml conical tube (Corning 352098). These tubes were spun down at 425 g for five minutes at 4° Celsius.
Nuclei lysis buffer (50 mM Tris-HCl pH 8, 10 mM EDTA pH 8, 1% SDS), 1X PIC, and 10 mM sodium butyrate (Sigma Aldrich B5887) were added to a concentration of 20,000,000 cells per 400 µl and resuspended until homogenous. Chromatin was sonicated using a Covaris LE220 for 35 minutes, then centrifuged at max speed for 10 minutes at 4°C to obtain supernatant.
Per 0.1 ml of supernatant, we diluted with 0.9 ml ChIP dilution buffer (50 mM Tris-HCl pH 8, 0.167 M NaCl, 1.1% Triton X-100, 0.11% sodium deoxycholate), 0.5 ml RIPA-150 (50 mM Tris-HCl pH 8, 0.15 M NaCl, 1 mM EDTA pH 8, 0.1% SDS, 1% Triton X- 100, 0.1% sodium deoxycholate), 28 µl 50X PIC, and 14 µl 1 M sodium butyrate.
Anti-ERα (3 µl/IP), anti-H3K4me1 (1 µl/IP), and anti-SP1 (3 µl/IP) were linked to 100 µl/IP, 60 µl/IP, and 100 µl/IP magnetic anti-rabbit Dynabeads respectively with RIPA-150 to a final volume of 500 µl for 6 hours at 4°C in low-bind tubes (Eppendorf Z666505), and then incubated with 150 µg of chromatin overnight at 4°C. Immunoprecipitants were washed with RIPA-150 once, followed by RIPA-500 (50 mM Tris-HCl pH 8, 0.5 M NaCl, 1 mM EDTA pH 8, 0.1% SDS, 1% Triton X-100, 0.1% sodium deoxycholate) twice, then RIPA-LiCl (50 mM Tris-HCl pH 8, 1 mM EDTA pH8, 1% Nonidet P-40, 0.7% sodium deoxycholate, 0.5 M LiCl2) twice, and finally 1X TE Buffer pH 8 (10 mM Tris-HCl pH 8, 1 mM EDTA pH 8) twice for 5 minutes each. Chromatin-IPs
volume sodium acetate (Invitrogen AM9740), 1 µl glycogen (Roche 10901393001), twice volume 100% ethanol (Sigma Aldrich E7023500ML) was added, and the samples were incubated at -80°C for 30 minutes. The sample was spun at 20000 g for 30 minutes at 4°C, and the supernatant was carefully aspirated. The pellet was washed with 1 ml cold 70% ethanol, and spun at 20000 g for 30 minutes at 4°C. The supernatant was aspirated, and the spin was repeated a final time. The supernatant was removed, and pellet was allowed to dry. The pellet was then resuspended in 25 µl elution buffer (Qiagen 19086) and subsequently quantified by Qubit 2.0 Fluorometer.
Standard Illumina ChIP-seq Library Kits (IP-202-1012, IP-202-1024) were used to build sequencing libraries for two biological replicates per condition for one experimental repetition, with inputs used as control. Libraries were sequenced at VANTAGE using an SR50 flow cell on the Illumina HiSeq3000 to a depth of approximately 20 million reads (Table 2-10). Quality of NGS data was assessed using FastQC v0.11.5, and adapters/low quality bases were trimmed from reads using fastq-mcf from ea- utils, with minimum quality of 7 and minimum length of 25. The fastq files were aligned to human genome version 19 by BWA (Burrows–Wheeler aligner Version 0.7.5a-r405).119 Post-alignment filtering was performed with Samtools 1.7120 and Picard 1.126 MarkDuplicates. PhantomPeakQualTools v1.2.1121 was used to assess ChIP-seq enrichment quality prior to inclusion in the study, and all replicates used in this study passed. Self-pseudoreplicates, pooled data, and pooled-pseudoreplicates were generated and used to call peaks for creation of peak thresholds. Peaks were called against matching input using SPP v1.15.5 according to best practices ENCODE 3 Pipeline v1. SPP uses a normalization factor is implicitly used to linearly scale the control sample for comparison with the ChIP sample; it does this by identifying a subset of background bins with a tag count exceeding Poisson density (p < 0.0001). Those background regions can then be normalized to the input channel. The Irreproducible Discovery Rate (IDR) framework version 2.0.3 was used to measure the reproducibility of ChIP-seq peaks identified from replicate experiments and find thresholds based on reproducibility.123 All call sets used for this study met IDR benchmarks for reproducibility (2-5a, 2-11a, Table 2-11). Final peak thresholds were chosen from this structured
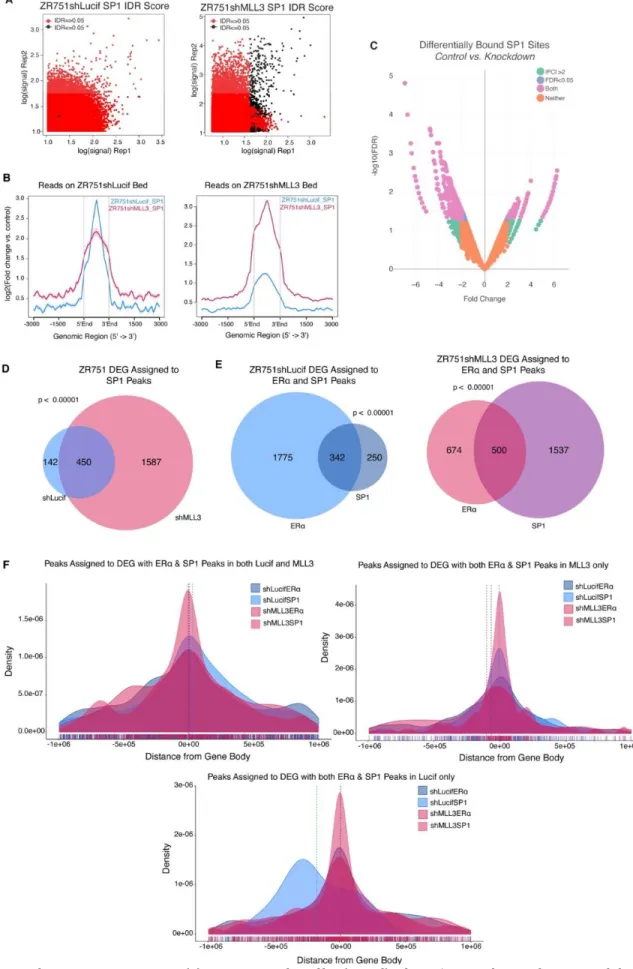
comparison of number of peaks called from original replicates, self-pseudoreplicates, and pooled-pseudoreplicates; these peak thresholds were applied to a pooled reads file composed of the two biological ChIP replicate libraries. The DiffBind package in R was utilized to find differential binding of ZR751shLucif vs ZR751shMLL3 H3K4me1, ERα, and SP1 ChIP-seq peaks (2b, S6c).
Peak Assignment
Using Bedtools v2.26.0 we assigned each ChIP-seq peak to the two closest DEGs rather than the closest gene in the human genome.124 We then removed all assignments that had a peak-to-gene distance greater than 1 million base pairs (bp), ranging from 16% to 26% of assignments, because most chromatin-chromatin interactions span 1 million bp or less.125
To determine whether our ChIP-seq peaks are closer to our DEG than we would expect by chance, we randomly selected a matched number (6,677 to equal the number of differentially expressed genes) of genes from the reference genome file to assign to our peaks, calculated distances, and then repeated this process 1000 times. A one-sided Kolmogorov–Smirnov test between our DEG-peak assignments and randomly chosen gene set-peak assignments was performed for each of the 1000 repetitions, and then created a final measure of robustness by subtracting the number of p-values less than 0.05 divided by 1000 from 1. Peak categories with a final measure of robustness less than 0.05 were kept.
Bioinformatic Tools
Mutation information, survival plots, and TCGA for breast cancer samples were acquired from the National Cancer Institute Genomic Data Commons Data Portal. GRMetrics R package usage included GRfit by cell line and time point to calculate GR values. For IDR plots, peak files and an hg19 genome file was loaded into R. Parameters included half.width = NULL, overlap.ratio = 0, is.broadpeak = F, sig.value = “signal.value”. Data was processed and IDR output generated with
process.narrowpeak, compute.pair.uri, and fit.em with fix.rho2=T as a parameter. NGS Plot heatmaps and histograms were created at command line using ngs.plot.r with hg19 genome, with final bed files as region to plot, configuration files to plot both control and KD bam files, length from gene body of 3000 bp, ensemble as the gene database, and chipseq and
protein_coding as the annotations to use. Diffbind in R utilized the DBA_EDGER analysis method with a reporting threshold of 0.1 and bUsePval = TRUE. The DBA__BLACKLIST_HG19 blacklist was applied, and a greylist.pval of 0.9 was applied afterwards.
A consensus peakset with a minOverlap of 0.66 and consensus of DBA_CONDITION was created and used to count reads in dba.count. These reads were normalized with dba.normalize and method = DBA_ALL_METHODS, and then contrasted with dba.contrast by condition and minMembers = 2. Analysis of differential peak enrichment was carried out using dba.analyze using DBA_ALL_METHODS. GREAT webtool version 3.0.0 was used to identify gene set enrichment analysis with ChIP-seq data126 with human genome UCSC hg19 for species assembly, whole genome as background, and basal plus extension with 5.0 kb upstream, 1.0 kb downstream, and distal up to 1000 kb for associating genomic regions with genes. Curated regulatory domains were included. WebGestalt 2019 version was utilized for gene set enrichment analysis with RNA-seq and ChIP-seq data.127 RNA-seq data was submitted to WebGestalt Gene Set Enrichment Analysis (GSEA) as rank (rnk) files sorted by - log10(p-value) from the differential expression analysis in R, and the Molecular Signatures Database (MSigDB) curated gene sets of chemical and genetic perturbations (C2 CGP) database as the functional database to survey. All genes expressed in the specific dataset (ZR751 or TCGA) were used as the reference set. The minimum number of genes for a category was set at 3, and the maximum was set at 2000. P-values from this analysis were adjusted for multiple hypothesis testing using Benjamin- Hochberg method, and the top 50 most significant terms by FDR were retrieved. Gene groups from the integration of RNA-seq and ChIP-seq data were submitted to WebGestalt using an Over-Representation Analysis (ORA) using all the same parameters except for use of protein-coding portion of the human genome as the background. The iRegulon tool v1.3 (build 2015-02-12) in Cytoscape software version 3.7.1 was utilized to identify enriched transcription factor motifs in DEG from RNA-seq data128 with the “Predict regulators and targets” option. The species and gene nomenclature chosen was Homo sapiens, HGNC symbols, the type of search space was gene-based, the motif collection was 10k (9713 PWMs), the track collection was ENCODE raw signals, the putative regulatory region was 20kb centered around TSS, and the motif rankings database was 7 species. The Enrichment score threshold was 3.0, the ROC threshold for AUC calculation was 0.03, and the rank threshold was 5000. The minimum identity between orthologous genes for TF prediction was 0, and the maximum FDR on motif similarity was 0.001. MEME-suite command-line tools version 4.11.2 was used to identify enriched transcription factor motifs in ChIP- seq data.129 Fasta files were used with MEME command and max dataset size of 5000000 letters, using the DNA alphabet, and a max number of motifs at three. Tomtom was utilized with the HOCOMOCOv11_full_HUMAN_mono_meme_format.meme database to identify known motifs within the MEME results. Dependence scores for ER+ breast cancer cell lines were acquired
Cells were plated in 96-well plates (Fisher Scientific 07-200-95) with 10,000 cells per well and three biological replicates per experiment in phenol-red free RPMI (Sigma-Aldrich R8758500ml) with 10% heat-inactivated charcoal-stripped FBS
(Corning™ 35016CV), 10 nM β-estradiol (Sigma-Aldrich E8875-5G), 0.002% insulin (Sigma-Aldrich 11376497001), and 50 U/mL penicillin, 50 mg/mL streptomycin (Corning™ MT30001CI), and either DMSO (Sigma-Aldrich D8418-100ML), Tamoxifen (Sigma-Aldrich 579002-5MG), or Fulvestrant (Sigma-Aldrich I4409-25MG). Media was switched out every four days and plates were fixed on days 4 and 8. All plates were stained with crystal violet (Sigma-Aldrich C0775-25G) and quantification by spectrophotometric detection at 490 nm using plate reader Molecular Devices Spectramax M3. Ten experimental replicates were performed to obtain parameters (cells per well, estradiol amount, time points) that gave consistent results. Effects were analyzed using GRmetrics version 1.10.0, one-sided Wilcoxon Rank Sum Test, n=3.
Statistical Analyses
All significance level thresholds are p<0.05 unless otherwise noted. For all bar-and-whisker plots, the center line signifies the median, box limits signify upper and lower quartiles, and whiskers signify the 1.5x interquartile range. All data points are shown as dots. For histograms and line plots, error bars represent standard deviation. Significance of survival curves (1H, S1E) were evaluated by Log-Rank test. Quantification of gene expression (qPCR, S2A) was evaluated by a one-tailed unpaired t-test of the calculated delta CT values. For differential expression analyses RNA-seq FPKM files were log2 transformed. The R SVA package132 was utilized to estimate artifacts in the form of surrogate variables from the RNA-seq data, which were then removed from the data. The cleaned data was then analyzed with a gene-by-gene multivariate linear regression model accounting for KD status for ZR751 data and histological subtype, intrinsic molecular subtype, and binary MLL3 mutation status for TCGA data. An ANOVA was used to evaluate the model. Estimated log expression change and Pr(>|t|) for MLL3 mutation or KD status from the linear regression and Pr(>F) for MLL3 mutation or KD status from the ANOVA were recorded for each expressed gene. Multiple hypotheses correction was achieved through use of the qvalue R package on the ANOVA p- values133. Overlap between groups of genes was tested with the GeneOverlap R package134 which employs the Fisher’s exact test. For proliferation assays the R package GRMetrics was utilized to find GR values, which are the growth-rate inhibition value of a given treatment at a given concentration. The GR values were then assessed by Wilcoxon Rank Sum Exact test, for each concentration and time point. The SP1 Dependency scores were assessed for effect by MLL3 mutation using a Wilcoxon Rank Sum exact test. The number of peaks assigned to DEG was assessed for patterns of loss or gain using both a proportions test where gain of peaks assigned to DEG in the KD condition =1 and a loss of peaks = 0, as well as a two-sided Wilcoxon paired signed rank test with continuity correction.
Data Availability Statement
The TCGA data that support the findings of this study are openly available in the Genomic Data Commons at
https://portal.gdc.cancer.gov/. The ZR751 RNA-seq and ChIP-seq data that support the findings of this study are available at https://www.ncbi.nlm.nih.gov/geo under series GSE163264 . For codes, see online at
https://github.com/staufferalexander/MLL3.
Results
MLL3 mutation pattern in ER+ breast cancer suggests that MLL3 is a haploinsufficient tumor suppressor.
MLL3 has been reported to be a haploinsufficient tumor suppressor in AML105, and thus we hypothesized that most MLL3 mutations in breast cancer would be heterozygous (2-1a).135,136 We expect a 1:1 mutant-to-wildtype allele ratio in the TCGA ER+ breast cancer sample set to present as a 35:65 mutant-to-wildtype allele ratio for a few reasons: TCGA ER+ breast cancer samples have approximately 75% tumor purity,137 and copy number data from the TCGA demonstrate that no amplifications or deletions coincide with MLL3 mutations for these samples (2-2d). Analysis of TCGA data demonstrates that the average MLL3 mutant allele frequency, corresponding to the percent of sequencing reads containing a mutation, is approximately 30%
across the different categories of mutation (2-1b). This suggests that only one of two alleles is mutated, and that
heterozygosity is not lost upon mutation of that one allele. This trend persists across multiple breast cancer datasets (2-2b), and in some of the other most frequently mutated genes in ER+ breast cancer (2-2a). Indeed, MAP2K4 and TP53, tumor suppressors associated with loss of heterozygosity, 138,139 have a higher mutant allele fraction of approximately 50-60%. These ratios are more consistent with mutation of one allele, followed by loss of heterozygosity of the other allele in the tumor cells, given the aforementioned tumor purity.
With evidence to support that MLL3 mutations in ER+ luminal breast cancer are heterozygous, we next considered whether the effect of the mutations would be deleterious to the function of the methyltransferase. Mutations were a mix of nonsense (16/49), frameshift (18/49,), missense (14/49), and splice (1/49) mutations spread across the length of the gene with no mutational hotspots (2-1c, 2-2c). Table 2-1 shows that while there are no mutations within the catalytic SET domain of MLL3, there are 34 truncating mutations that occur 5’ to the SET domain. In addition, missense mutations within the PHD domains of MLL3 have been shown to be oncogenic.109 Considering this information, we speculated that the 10 missense mutations outside defined regions of the protein would still lead to deleterious effects on MLL3 function.
Domain
Name Function Amino Acids # Truncating Mutations
In/Prior To
TCGA Mutations
PHD1 Putative H3/Zn binding 247-330 2 NA
PHD2 Putative H3/Zn binding 390-435 3 1ns, 2ms
PHD3 Putative H3/Zn binding 466-517 4 1ns
PHD4 Binds to H4R3me0,
H4R3me2a 952-1008 10 -
PHD5 Binds to H4R3me0,
H4R3me2a 1009-1055 10 -
PHD6 Binds to H4R3me0,
H4R3me2a 1086-1136 10 -
LXXLL
Motif Nuclear Receptor Interacting 1408-1412 12 -
HMG-1 DNA Binding 1655-1703 15 1fs
LXXLL
Motif Nuclear Receptor Interacting 2745-2749 23 -
LXXLL
Motif Nuclear Receptor Interacting 2918-2922 23 -
LXXLL
Nuclear Receptor Interacting 3055-3059 23 -