LIKUIDITAS, KEBIJAKAN DIVIDEN, LEVERAGE, DAN NON-PERFORMING LOAN TERHADAP NILAI PERUSAHAAN BANK BUMN YANG GO PUBLIC DI INDONESIA LIQUIDITY, DIVIDEND POLICY, LEVERAGE, AND NON-PERFORMING LOAN ON
THE FIRM VALUE OF SOE BANK THAT GO PUBLIC IN INDONESIA
Reynaldy Prasetyo1, Azhar Latief 2
NASKAH PUBLIKASI
Diajukan Sebagai Salah Satu Syarat Mendapatkan Gelar Sarjana Manajemen (S.M)
Disusun Oleh:
REYNALDYPRASETYO 1811102431310
PROGRAM STUDI S1 MANAJEMEN FAKULTAS EKONOMI BISNIS DAN POLITIK UNIVERSITAS MUHAMMADIYAH KALIMANTAN TIMUR
2022
Likuiditas, Kebijakan Dividen, Leverage, Dan Non-Performing Loan Terhadap Nilai Perusahaan Bank BUMN Yang Go Public Di Indonesia
Liquidity, Dividend Policy, Leverage, And Non-Performing Loan On The Firm Value Of SOE Bank That Go Public In Indonesia
Reynaldy Prasetyo1, Azhar Latief 2
NASKAH PUBLIKASI
Diajukan Sebagai Salah Satu Syarat Mendapatkan Gelar Sarjana Manajemen (S.M)
Disusun Oleh:
REYNALDYPRASETYO 1811102431310
PROGRAM STUDI S1 MANAJEMEN FAKULTAS EKONOMI BISNIS DAN POLITIK UNIVERSITAS MUHAMMADIYAH KALIMANTAN TIMUR
2022
LIQUIDITY, DIVIDEND POLICY, LEVERAGE, AND NON-
PERFORMING LOAN ON THE FIRM VALUE OF SOE BANK THAT GO PUBLIC IN INDONESIA
Reynaldy Prasetyo1*, Azhar Latief2
1*,2)
Program Studi Manajemen, Fakultas Ekonomi Bisnis dan Politik, Universitas Muhammadiyah Kalimantan Timur
Jl. Ir. H.Juanda No.15 Samarinda, Kalimantan Timur, 75124 E-mail: [email protected]1*)
ABSTRACT
This research will look at how liquidity (LDR), dividend policy (DPR), leverage (DAR & DER), and non-performing loans (NPL) affect the value of the company's publicly traded state-owned banks. The population in this research consists of state-owned banks listed on the Indonesia Stock Exchange. The non-probability sampling method with a purposive side technique was used in this study, and four state-owned banks were obtained as samples for a 10-year research period (2011-2020). PLS-SEM (Partial Least Squares Structural Equation Modeling) was used as a data analysis technique, and SmartPLS software was used as a data analysis tool. According to the study's findings, liquidity and non-performing loans has a significance impact on firm value. Firm value is unaffected by dividend policy or leverage.
Keywords: Dividend Payout Ratio; Liquidity; Leverage; Non-Performing Loan.
INTRODUCTION
A bank is a financial institution that collects money from the public in the form of demand deposits and savings and distributes funds to the public in the form of loans and other financial service products. The presence of high levels of sophistication and complexity might trigger a risk that leads to a reduction in bank performance, which in turn reduces public trust.
Several factors influence a bank's success, including both internal and external influences. Bank management choices on the creation of operational policies and strategies may be influenced by bank internal variables, which are things that happen inside the bank.
A strong firm's operational performance should be able to contribute, both efficiently and effectively, to the expansion of the company's financial growth. According to Hermuningsih (2013), firm value is critical because it can reflect the company's performance, influencing investors' perceptions of the company. Companies that want to become publicly traded, such as banks, have one primary objective. This objective is to be able to make profits that will enhance the economic well-being of the owners or shareholders of the business. This objective may be accomplished by raising the value of the company, which can be used to characterize the status of the firm. When a business goes public, it almost always results in a rise in the value of the firm, which is done to attract investors (Pramana & Mustanda, 2016). Companies that go public almost always increase the company value to attract investors. (Pramana & Mustanda, 2016).
Firm value is the amount of money that investors are willing to pay if a company sells its stock (Sintyana & Artini, 2019). The company's value rises in direct proportion to its stock price level. Due to the company's high value, investors will undoubtedly be interested in purchasing shares. The company's value will rise due to the possibility of future investment. It can increase the firm's value by taking advantage of investment opportunities that require additional funding and require the company to either issue new shares or incur additional debt. Naturally, dividend
policy, liquidity, leverage, and non-performing loans all has a impact on the firm's value performance.
In this research, several factors influence the company's value, including liquidity, dividend payout ratio, leverage, and non-performing loans. The state of a company can describe its value based on these factors. Potential investors will view the company favorably if it has a high firm value and vice versa. According to Azhar et al., (2018) Firm value is the selling value of a company that investors are willing to pay as a business that goes hand in hand with the development of the company in question.
Several methods and tools for calculating a company's high value include Tobin's Q or Q Ratio and Price to Book Value (PBV). Tobin's Q ratio provides the most accurate information about a company's value because it includes all debt and shares capital elements, not just ordinary shares and company equity, but also all company assets. (Utomo, 2019). Tobin's Q ratio provides the most accurate information about a company's value because it includes all debt and share capital aspects. According to Dzahabiyya et al., (2020) Tobin's Q is the ratio of a company’s value to its assets; if the result is more significant, the company can better manage its assets and increase profits. Price to Book Value is a popular metric for determining firm value (PBV). According to Sunaryo, (2017) Price to Book Value (PBV) is a ratio that depicts the relationship between a company's stock market price and its book value. A high-value Price to Book Value (PBV) also indicates shareholder prosperity, which is the company's primary goal.
The research aims to look at how liquidity, dividend payout ratio, leverage, and non- performing loans affect the value of state-owned banks that go public between 2011 and 2020.
According to Brigham & Houston (2014), the Theory of Signaling: A signal is an action taken by management to communicate to investors how management views the company's prospects. The company takes this action to signal to shareholders or investors how its management sees its prospects to differentiate between good and bad companies.
Liquidity (LDR). According to (Kasmir, 2009) the liquidity ratio is used to measure a bank's ability to meet its short-term obligations at the time of billing. Liquidity is calculated by the Loan Deposits Ratio (LDR). According to Fathihani and Wijayanti (2022), the Liquidity Ratio is a company's ability to meet financial obligations that it can disburse immediately or those that are due. LDR is calculated using the following formula:
o a oan
o a epo i ... (1)
The dividend payout ratio is used to assess dividend policy (DPR). According to Murni, (2016) defines dividend policy as determining the number of dividend payments and the amount of retained earnings for the company's benefit. According to the higher the retained earnings, the lower the profit distributed to shareholders. The dividend policy determines whether the company's profits are distributed to shareholders as dividends or are retained in the form of retained earnings to fund future investments. The DPR is calculated using the formula:
i idend e ha e
a ning e ha e ... (2)
The debt-to-asset ratio (DAR) and the debt-to-equity ratio (DER) are used to calculate leverage (DER). Syamsuddin (2016) DAR is a ratio that can calculate how much of a company's assets are financed by creditors. If the ratio value is high, it indicates that the capital the company uses to invest in assets to generate profits is also high. The debt-to-equity ratio (DER) is a debt and equity measurement that compares all debt to company equity (Sheila & Djawoto 2019).
According to Rompas (2013) the higher the cost of capital used due to management increasing
debt, the higher the company's operational costs, and thus the lower the company profits. DAR and DER are calculated using the following formulas:
... (3)
... (4)
Non-performing loan (NPL). According to Kasmir (2013), Non-performing loans are those in which the customer, intentionally or unintentionally, fails to pay his obligations. NPL is used to calculate the level of non-performing loans in banking companies for the distribution of credit to the community. NPL is a credit that is not following the predetermined installment schedule, resulting in arrears. According to Wardani & Haryanto (2021) a condition where the customer is unable to pay off part or all of his debt to the bank as agreed. In the classification of non-performing loans, the smaller the non-performing loans, the lower the credit risk borne by the bank. The formula used to calculate NPL is:
on e fo ming oan
o a oan ... (5)
Tobin's Q and PBV (Firm Value). Tobin's Q and Price to Book Value are used to calculate a firm value (PBV). Tobin's Q is one of the ratios used to calculate a company's value.
Tobin's Q is a ratio measuring tool that defines the value of the company as a form of the value of tangible and intangible assets, according to Dzahabiyya et al. (2020). Tobin's Q ratio can describe a company's efficiency in utilizing resources in the form of assets. Price to Book Value (PBV) can describe the potential movement of stock prices, so the PBV ratio indirectly affects stock prices (Khairunnisa et al., 2020). According to Hirdinis, (2019) PBV is used to determine how far a company can generate firm value relative to the amount of capital investedThe higher the PBV ratio, the better the company is at creating value for its investors. Tobin's Q and Price to Book Value are used to calculate a firm value in this study (PBV).
Tobin's Question:
... (6) Price to Book Value (PBV) :
... (7) Hypothesis Formulation
The level of the company's liquidity reflects its capacity to fulfill its financial commitments without incurring any losses. A high level of liquidity can persuade investors to put their money into a firm, which in turn drives up the demand for the company's shares, which in turn drives up the price. Octaviani & Komalasarai, (2017) state that liquidity positively affects firm value. Pracoyo & Ladjadjawa (2020) Stated that liquidity significantly affects firm value.
The research results of Wijaya & Purnawati (2014) also stated that liquidity has a negative and significant effect on firm value, meaning that the higher the liquidity, the lower the firm value.
This proves that investors will be attracted to companies with good liquidity levels.
H1: Liquidity has a positive and significant effect on the firm value of state-owned banks that go
public.
A company's dividend policy determines how much revenue or profits will be distributed to investors through dividends or retained earnings. This decision can be made to either distribute profits to investors or retain them as retained earnings to be used as investment finance in the future. The higher the dividend paid to shareholders, the higher the firm's performance and profitability will be evaluated. Research conducted by Kurnia (2017) research, dividend policy has a positive and significant effect on firm value. Oktaviani & Sutarmin (2022) The Dividend Payout Ratio (DPR), which measures dividend policy, has a positive effect on firm value. Siregar et al. (2019) However, according to the research, the dividend policy variable have a positive but non-significance effects on firm value.
H2: Dividend policy have a positive and significant effects on the firm value of state-owned banks that go public.
Leverage Can be used to demonstrate the extent to which the firm relies on external financing to maintain its asset base. Since of the excessive amount of debt, the firm will be put in jeopardy because it falls into the category of having severe leverage. This means that the company is caught in a cycle of high debt, and it will be difficult for the company to get out from under the weight of the debt. As a result, the organization needs to determine how much debt it is worthwhile to take on and determine how the various kinds of debt may be paid back. Research conducted by Febriyanti & Azib (2016) found that leverage affects firm value. And contrary to the research conducted by Oktaviani & Sutarmin (2022) Leverage does not affect firm value.
H3: Leverage have a negative and significance effect on the firm value of state-owned banks that go public.
Non-Performing Loans (NPLs) are loans that do not pay their installments according to the predetermined schedule, resulting in arrears. The amount of credit risk the bank faces; the lower the ratio of non-performing loans (NPL), the lower the credit risk the bank bears. John (2018) the higher the NPL ratio, the greater the debtor's failure rate to fulfill obligations. This can result in losses that become a burden on the company and have an impact on the company's value (Asriyani & Mawardi 2018). Based on the explanation provided, a hypothesis can be developed that NPL has a negative effect on firm value, and according to Pracoyo & Ladjadjawa (2020), NPL significantly affects firm value. Research conducted by Nurrohmah et al., (2022) NPL has no significant effect on firm value. Based on the explanation provided, it is possible to form the hypothesis that NPLs have a negative impact on firm value.
H4: Non-performing loans have a negative and significant effect on the firms value of state- owned banks that go public.
RESEARCH METHODS
This study's population is a state-owned bank listed on the Indonesia Stock Exchange (IDX). This study spans the years 2011 to 2020. The total company’ cross-sectional data spans four companies over ten years. PT. Bank Mandiri (Persero) Tbk., PT. Bank Negara Indonesia (Persero) Tbk., PT. Bank Rakyat Indonesia (Persero) Tbk., and PT. Bank Tabungan Negara
(Persero) Tbk. are among the four banks (www.idx.co.id). The data was analyzed using the Partial Least Squares (PLS) method and SmartPLS 3.
This study employed quantitative research with a purposive sampling technique and a descriptive approach. This method is a type of research that is structured, systematic, and well- planned from the beginning to the end. Using secondary data collection methods from the financial statements of state-owned banks listed on the Indonesia Stock Exchange (IDX). To calculate the firm value, data on share prices and the number of outstanding shares are sourced from the company's annual report published on the Indonesia Stock Exchange and the company's website.
Endogenous variables are influenced or result from the presence of exogenous variables. In this study, the endogenous variable is firm value. Tobin's Q and PBV are used to calculate a firm value (Price to Book Value).
There are two models in PLS path modeling: the outer model and the inner model. The measurement model (outer model) is concerned with the relationship between Latin variables and their indicators, or with how each indicator is related to its latent variables. The outer model is evaluated using four criteria:
Convergent Validity determines the validity of each relationship between the indicator and the construct or latent variable. The loading factor on the latent variable with its indicators equals the concurrent validity value. The expected loading factor value is greater than 0.7.
The goal of discriminant validity is to determine how unique the latent construct is in comparison to other constructs. A construct with a high discriminant validity value is one-of-a- kind and can explain the phenomenon under consideration. One method for determining discriminant validity is cross-loading, which involves examining the loading value of each item on the construct that is greater than the cross-loading value.
(Ghozali, 2011) says that another method to determine discriminant validity is to compare the square root of the Average Variance Extracted (AVE) of each construct with the correlation between that construct and other constructs in the model. According to (Ghozali, 2011) It is said to have good discriminant validity if the square root value of the AVE for each construct is greater than the correlation value between the construct and other constructs in the model. It is recommended that the AVE value exceed 0.50.
Composite measures the actual value of a construct's reliability and is better at estimating a construct's internal consistency. Data with composite reliability greater than 0.7 has a high- reliability value.
A structural model that can describes the relationships between latent variables is the inner model. The Structural Model is evaluated using the R2 (Coefficient of Determination), Q2 Predictive Relevance, and the results of the inner model's significance through the bootstrapping method, with a significance level of 5%. (Inner Model).
RESULTS AND DISCUSSION
This evaluation was conducted by looking at each metric's exposure factor value (external exposure). The indicator is considered valid if the value is more significant than 0.7.
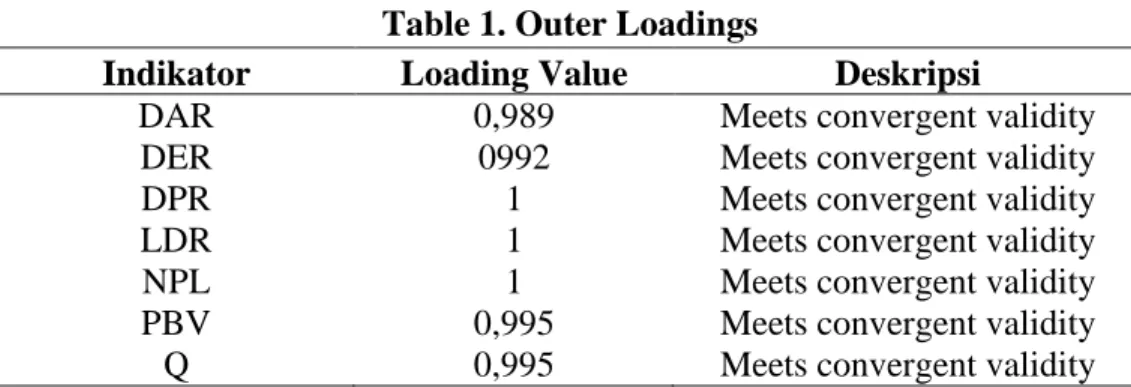
Table 1 displays the loading factor results:
Table 1. Outer Loadings
Source: Processed data (2022)
Ba ed on ab e 1, he e’ no variable indicators with outer loading values less than 0.7, indicating that all indicators are feasible or valid for research use and can be used for further analysis.
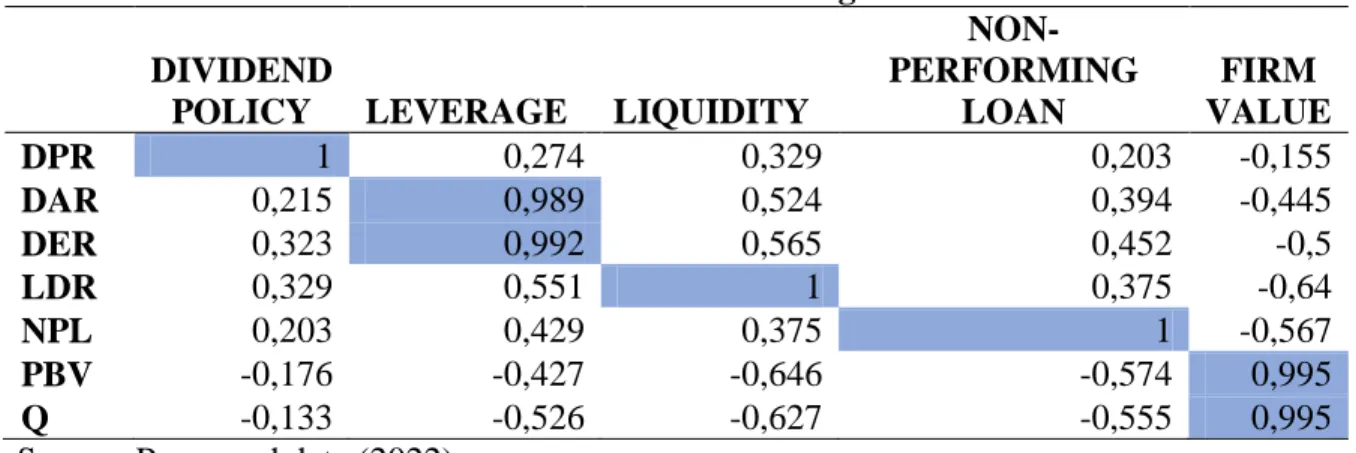
Table 2 shows the discriminant validity of the research model as measured by the cross- loading value.
Table 2. Cross Loading DIVIDEND
POLICY LEVERAGE LIQUIDITY
NON- PERFORMING
LOAN
FIRM VALUE
DPR 1 0,274 0,329 0,203 -0,155
DAR 0,215 0,989 0,524 0,394 -0,445
DER 0,323 0,992 0,565 0,452 -0,5
LDR 0,329 0,551 1 0,375 -0,64
NPL 0,203 0,429 0,375 1 -0,567
PBV -0,176 -0,427 -0,646 -0,574 0,995
Q -0,133 -0,526 -0,627 -0,555 0,995
Source: Processed data (2022)
According to Table 2, all loading indicators values for the construct are more significant than the cross-loading value, indicating that discriminant validity is high.
Other than observing the cross-loading value, discriminant validity can be determined by looking at each indicator's average variant extracted (AVE) value. A good model requires a value greater than 0.5.
Table 3 shows the value of Average Variance Extracted (AVE):
Table 3. Average Variance Extracted (AVE)
VARIABLE Average Variance Extracted (AVE)
LIQUIDITY 1
DIVIDEND PAYOUT RATIO 1
Indikator Loading Value Deskripsi
DAR 0,989 Meets convergent validity
DER 0992 Meets convergent validity
DPR 1 Meets convergent validity
LDR 1 Meets convergent validity
NPL 1 Meets convergent validity
PBV 0,995 Meets convergent validity
Q 0,995 Meets convergent validity
LEVERAGE 0,981
NON PERFORMING LOAN 1
FIRM VALUE 0,989
Source: Processed data (2022)
According to Table 3, the AVE value is more significant than 0.5. As a result, each variable has high discriminant validity. As a result, the model is usable.
Table 4. Fornell-Larcker Criterion
DPR Q&PBV DAR&DER LDR NPL
DIVIDEND POLICY 1
FIRM VALUE -0,155 0,995
LEVERAGE 0,274 -0,478 0,991
LIQUIDITY 0,329 -0,64 0,551 1
NON PERFORMING LOAN 0,203 -0,567 0,429 0,375 1
Source: Processed data (2022)
According to table 4, the root value of AVE is greater than the correlation of latent variables. The discriminant validity test using the AVE root of all variables is good.
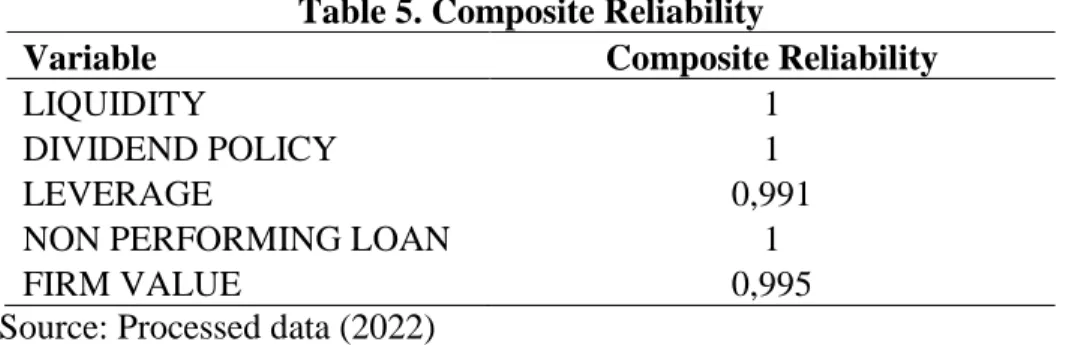
Table 5. Composite Reliability
Variable Composite Reliability
LIQUIDITY 1
DIVIDEND POLICY 1
LEVERAGE 0,991
NON PERFORMING LOAN 1
FIRM VALUE 0,995
Source: Processed data (2022)
Table 5 displays the Composite Reliability values for all constructs with a value greater than 0.7. These findings show that each variable achieves combined reliability, implying that all variables have a high level of dependability. As a result, the dependability of all components is high.
The R-Square values are obtained as follows based on data processing performed with the SmartPLS 3.0 program:
The R Square (R2) value is shown in Table 6 below as a result of the analysis.
Table 6. R Square Value (R2)
Variable R Square
Firm Value 0.546
Source: Processed data (2022)
According to table 6, the value of R Square for the firm value variable is 0.546. It demonstrates that liquidity, dividend policy, leverage, and non-performing loans have a 54.6%
impact on firm value. Other variables are not included in the model influence the remaining
46.4%.
In addition to the R Square value, the model can be assessed using the Q-Square Predictive Relevance value. In regression analysis, the Q-square value has the same meaning as the determination of the coefficient of determination (R-square). In this case, the higher the Q- square, the better the model for the data.
The following are the results of the calculation of the value of the square of Q.
The following formula can be used to calculate the value of Q Square:
Q2 =1-{1-(R Square)2}
Q2 = Firm Value = 1 – {1 - (0,546)2} Q2 = Firm Value = 1 – (1- 0,298) Q2 = Firm Value = 1 – 0,702 Q2 = Firm Value = 0,298
Based on the calculation above, the value of Q Square is 0.298, indicating that the latent variable used in the model has a predictive relevance of 29.8%.
The significance of the inner model as determined by the bootstrap method is shown in Table 7 below.
Tabel 7. Hasil Signifikan Inner Model Melalui Bosststrapping Original
Sample
Sample Mean
Standard Deviation
T Statistics
P Values DIVIDEND POLICY -> FV 0,103 0,115 0,123 0,836 0,404 LEVERAGE -> FV -0,076 -0,06 0,162 0,468 0,64 LIQUIDITY -> FV -0,493 -0,515 0,138 3,577 0 NON-PERFORMING LOAN -> FV -0,371 -0,367 0,123 3,016 0,003
Source: Processed data (2022)
Based on table 7, the structural model is obtained as follows:
Q = +0,103 DividendPolicy -0,076 Leverage -0,0493 Liquidity -0,371 Non-Performing Loan
Figure 1. Output Bootstrapping SmartPLS
Based on the data in table 7 and figure 2, it is clear that only two of the four hypotheses proposed in this research, namely liquidity and non-performing loans, were accepted because the T-statistics for each effect displayed was more significant than 1.96 and the p-value was less than 0.05. As a result, it can be stated that two independent variables significantly influence the dependent.
The liquidity test on firm value has a t-statistic value of 3.577, more significant than 1.96, and a path coefficient of -0.453, less than 5% significant. Liquidity has a statistically significant negative impact on firm value.
The Dividend Policy test on firm value has a t-statistic value of 0.836, less than 1.96, and a path coefficient of 0.103, greater than 5%. There is no statistically significant effects of dividend policy on firm value.
Leverage testing on firm value yields a t-statistic value of 0.468, less than 1.96, and a path coefficient of -0.076, with a significance level of 0.64, greater than 5%. There is no statistically significant effect of leverage on firm value.
The t-statistic value for the non-performing loan test on firm value is 3.016, which is greater than 1.96, and the path coefficient is -0.371, with a significance level of 0.003, less than 5%. Non-performing loans have a statistically significant negative impact on firm value.
The effects of liquidity on firm value
Based on the study's findings, it is widely accepted that Liquidity has a significant and negative impact on Firm Value (LDR). It means that the firm's value will decline proportionally to the amount of Liquidity available. A low LDR can affect the company's stock price, while a high LDR can affect its profitability because it affects its ability to pay its debt. The relationship between the LDR and the company's ability to service its debt causes both effects. If a company has a high LDR value, its value will fall, forcing investors to reconsider investing their money, which is terrible news for the company. High corporate Liquidity will be bad news for the company because it will reduce its value. It may influence the decrease in the firm's value to some extent. In other words, as credit value fell, the number of deposits made by the general public in banks increased. As a result of the high amount of dormant funds, the bank has a poor LDR ratio, which indicates that it does not handle third-party funds as well as it might. It's likely that the huge ownership of banking assets in Indonesia is to blame for the effect of the LDR there. Not only that, but the interest income from loans supplied to the general public is not the main source of revenue for state-owned banks. This study supports the findings of Srihayati et al.
(2015) who discovered that LDR have a significance negative effect. Dewi & Ekadjaja (2020) liquidity significantly negatively impacts firm value. (Wijaya & Purnawati, 2014) It is also stated that liquidity has a negative and significant effect on firm value, which means that the more liquidity there is, the lower the firm value. It contradicts the findings of Lubis et al. (2017) , who found that liquidity has a positive and significant impact on firm value.
The effects of Dividend Policy on Firm Value
The findings of the dividend policy research on firm value show that dividend policy has no significant positive effect on firm value. It is consistent with the findings of Kartini &
Apriwenni, (2017) who discovered that dividend policy does not affect firm value. The dividends paid to shareholders are unrelated to the company's value. The dividend policy gives shareholders the right to a portion of the company's profits. The dividends paid to shareholders are unrelated to the company's high and low value. The number of dividends affects the stock
price, and the higher the dividend, the higher the stock price tends to be, increasing the company's value. A small dividend policy will increase the company's funds, making shareholders more interested in the profits generated and reinvested to maximize profits and increase the company's value. This study's findings are supported. Wati et al. (2018) dividend policy has no significant effect on firm value; a low dividend policy does not affect the capital market, so investors do not respond. This study's findings are consistent with Aprianto & Arifah, (2014) who discovered that dividend policy has a negative impact on firm value.
The effects of Leverage on Firm Value
This study's findings indicate that leverage has a negative impact on firm value, albeit one of negligible significance. Businesses frequently rely on capital derived from retained earnings and share capital to fund their assets rather than loan financing. Because the firm has sufficient funds, it can finance the operations that result in capital accumulation, lowering the proportion of its debt. Because the benefits obtained from using debt are not proportional to the expenses incurred, a low proportion of debt can increase the firm's value, while an increase in debt can decrease the firm's value. Because the benefits obtained from debt are not proportional to the costs incurred, using excessive debt reduces the benefits obtained from debt. Furthermore, this is the case because the inverse relationship between the leverage variable and firm value reveals no influence on firm value. No matter how much leverage is used, the cost of common shares will always rise at the same rate. It, however, will not affect the share price or the company's value. As a result, leverage does not affect the company's value. According to the study's findings, using leverage has a negative and minor impact on a company's value.
According to the study, leverage has a negative and insignificant effect on firm value by Novari
& Lestari (2016) support the findings of this study by stating that leverage does not affect the company. and research by Ogolmagai (2013), leverage (DAR) has no significance effect on firm value (Tobin's Q). and Anggara et al., (2019). From the results above, a decrease in the Debt Equity Ratio (DER) does not affect the increase in firm value.
The effects of Non-Performing Loans on Firm Value
Non-performing loans negatively and significantly affect firm value in this research. The findings in this study are the same with Antari & Baskara, (2020) Non-performing loans have a substantial negative impact. It indicates that the firm's value will rise in proportion to the NPL credit risk, implying that a lower NPL will result in a higher value for the company. A lower NPL will result in a more efficient and effective distribution of credit, resulting in a higher turnover of funds and increased credit-generated profits. The bank is exposed to less credit risk than the size of its net non-performing loans (NPL). The percentage of a bank's loans that are non-performing (NPL) can be used to measure its ability to attract the attention of stakeholders, and a bank with high performance will have a low percentage of these loans. As a result, the implications of this research on the company's value are enormous. It is also why, according to this study, non-performing loans (NPL) has a significance influence on company value, why poor credit quality will raise risk, why lending due to insufficient control will raise risk, and why banks will accept higher risks. The risk comes from debtors having difficulty repaying their credit, which, if significant enough, can impact the bank's performance. Non-performing loans (NPL) has a significance impacts on firm value. The study's findings are supported by (Murni et al. 2018). Non-performing loans (NPLs) impact firm value and are significant. According to Halimah and. The research conducted by Halimah & Komariah, (2017), NPLs significantly impact firm value.
CONCLUSION AND SUGGESTIONS
The purpose of this research is to determined the impact of liquidity, dividend policy, leverage, and non-performing loans on the value of state-owned banks that go public between 2011 and 2020 to reach the following conclusions:
Liquidity (LDR) has a significant negative impact. A high LDR indicates that the bank has channeled too many funds to meet loan applications or that the funds are not being used effectively, resulting in the bank being illiquid, which can reduce the company ability to carry out its activity and impede the company's value increase.
Non-performing loans (NPLs) has a negative and significance impact on firm value, poor credit quality increases risk, and uncontrolled lending can cause banks to bear additional risk.
Furthermore, the lower the NPL credit risk, the higher the company's value; because of the low NPL, credit is disbursed well and smoothly, resulting in a higher turnover of funds in generating profits through credit. Meanwhile, dividend policy and leverage have no discernible impact on the firm value measured by Tobin's Q and PBV.
Based on these findings, recommendations for further research are expected to examine various listed bank companies on the Indonesia Stock Exchange to generalize the findings. It is also expected that other variables outside of this research will be added or considered to obtain new information sources from previous research.
REFERENCES
Anggara, W., Mukhzarudfa, H., & L, T. A. (2019). Pengaruh Struktur Modal, Pertumbuhan Perusahaan, dan Profitabilitas Terhadap Nilai Perusahaan Pada Perusahaan LQ 45 di Bursa Efek Indonesia Periode 2015-2017. Jurnal Akuntansi & Keuangan Unja, 4(4), 2-748–770.
https://doi.org/10.22437/jaku.v4i4.8448
Antari, N. P. N., & Baskara, I. G. K. (2020). Pengaruh Ldr, Npl, Dan Bopo Terhadap Profitabilitas Pada Lpd Di Kabupaten Gianyar. E-Jurnal Manajemen Universitas Udayana, 9(8), 2998. https://doi.org/10.24843/ejmunud.2020.v09.i08.p06
Aprianto, R., & Arifah, D. A. (2014). Pengaruh Profitabilitas Dan Struktur Kepemilikan Terhadap Kebijakan Dividen Dan Nilai Perusahaan. E-Jurnal Manajemen Universitas Udayana, 15(11), 74–84. https://doi.org/http://dx.doi.org/10.30659/ekobis.15.1.74-84 Asriyani, R., & Mawardi, W. (2018). Analisis Faktor-Faktor Yangmempengaruhi Nilai
Perusahaan Dengan Profitabilitas Sebagai Variabel Intervening. DIPONEGORO JOURNAL OF MANAGEMENT, 6(3), 1–15. http://ejournal-s1.undip.ac.id/index.php/dbr
Azhar, Z. A., Ngatno, & Wijayanto, A. (2018). Pengaruh Profitabilitas Terhadap Nilai Perusahaan Melalui Kebijakan Dividen Sebagai Variabel Intervening (Studi pada Perusahaan Manufaktur yang Terdaftar di Bursa Efek Indonesia Periode 2012-2016). Jurnal
Ilmu Administrasi Bisnis, 7(4), 137–146.
https://ejournal3.undip.ac.id/index.php/jiab/article/view/21918
Brigham, E. F., & Houston, J. F. (2014). Dasar-dasar manajemen keuangan (11 h ed.). Jaka a : Salemba Empat.
Dewi, V. S., & Ekadjaja, A. (2020). Pengaruh Profitabilitas, Likuiditas Dan Ukuran Perusahaan Terhadap Nilai Perusahaan Pada Perusahaan Manufaktur. Jurnal Multiparadigma Akuntansi Tarumanagara, 2(1), 118–126. https://doi.org/http://dx.doi.org/10.24912/jpa.v2i1.7139 Dzahabiyya, J., Jhoansyah, D., & Danial, R. D. M. (2020). Analisis Nilai Perusahaan Dengan
Mode a io obin’ Q. Jurnal Riset Akuntansi Dan Keuangan Dewantara, 4(1), 46–55.
https://doi.org/10.26533/jad.v3i1.520
Fathihani Wijayanti, & Fitri, A. K. (2022). Faktor-faktor yang mempengaruhi nilai perusahaan (Studi Kasus Pada Perusahaan LQ 45 Periode 2017-2019). Jurnal Ekonomika Dan Manajemen, 11(1), 2252–6226. https://doi.org/10.36080/jem.v11i1.1727
Febriyanti, D. H., & Azib. (2016). Pengaruh Return On Equity, Leverage, Dan Kebijakan Dividen Terhadap Nilai Perusahaan (Studi Kasus pada Perusahaan- Perusahaan yang terdaftar di Jakarta Islamic Indeks Tahun 2014-2016). Prosiding Manajemen, 5(1), 574–
582.
Ghozali. (2011). Structural Equation Modeling Metode Alternatif Dengan Partial Least Square (PLS) (3th ed.). Semarang: Universitas Dioponegoro.
Halimah, S. N., & Komariah, E. (2017). Pengaruh Roa, Car, Npl, Ldr, Bopo Terhadap Nilai Perusahaan Bank Umum. JURNAL AKUNTANSI, EKONOMI Dan MANAJEMEN BISNIS, 5(1), 14. https://doi.org/10.30871/jaemb.v5i1.448
Hermuningsih, S. (2013). Profitability, growth opportunity, capital structure and the firm value.
Buletin Ekonomi Moneter Dan Perbankan, 16(2), 115–136.
https://doi.org/10.21098/bemp.v16i2.440
Hirdinis, M. (2019). Capital structure and firm size on firm value moderated by profitability.
International Journal of Economics and Business Administration, 7(1), 174–191.
https://doi.org/10.35808/ijeba/204
John, T. A. (2018). Effect of Non-Performing Loans on Bank Performance of Some Selected Commercial Bank in the Nigerian Banking Sector. International Journal of New Technology and Research, 4(4), 11–17.
Kartini, R. D., & Apriwenni, P. (2017). Dampak Perencanaan Pajak, Kebijakan Hutang dan Kebijakan Dividen Terhadap Nilai Perusahaan. Jurnal Akuntansi, 6(1), 47–67.
https://jurnal.kwikkiangie.ac.id/index.php/JA/article/view/386
Kasmir. (2013). Bank dan Lembaga Keuangan Lainnya. jakarta: RajaGrafindo Persada.
Kurnia, D. (2017). Analisis Signifikansi Leverage Dan Kebijakan Deviden Terhadap Nilai
Perusahaan. Journal of Accounting, 4(2), 12–21.
https://doi.org/doi.org/10.30656/jak.v4i2.247
Lubis, I. L., Sinaga, B. M., & Hendro, S. (2017). Pengaruh Profitabilitas, Sruktur Modal, Dan Likuiditas Terhadap Nilai Perusahaan Effect. Jurnal Aplikasi Bisnis Dan Manajemen, 3(3), 458–465. https://doi.org/10.17358/jabm.3.3.458
Murni, S. (2016). Faktor - Faktor Yang Mempengaruhi Dividend Payout Ratio Pada Industri Perbankan Lq45 Di Bursa Efek Indonesia Dalam Menghadapi MEA. Jurnal Pembangunan Ekonomi Dan Keuangan Daerah, 18(3). https://doi.org/10.35794/jpekd.14201.18.3.2016 Murni, S., Sabijono, H., & Tulung, J. (2018). The Role of Financial Performance in Determining
The Firm Value. Advances in Economics, Business and Management Research, 73, 66–70.
https://doi.org/10.2991/aicar-18.2019.15
Novari, P. M., & Lestari, P. V. (2016). Pengaruh Ukuran Perusahaan, Leverage, Dan Profitabilitas Terhadap Nilai Perusahaan Pada Sektor Properti Dan Real Estate. E-Jurnal
Manajemen Unud, 5(9), 5671–5694.
https://ojs.unud.ac.id/index.php/Manajemen/article/view/22690
Nurrohmah, W. K., Muslim, A., & Widiastuti, M. C. (2022). Faktor-Faktor Yang Mempengaruhi Nilai Perusahaan Bank Komersial Yang Terdaftar Di Bursa Efek Indonesia Tahun 2015 – 2020. Jurnal Ilmiah Akuntansi Dan Keuangan, 04(03), 1017–1033.
https://doi.org/10.32670/fairvalue.v4iSpesial%20Issue%203.1041
Octaviani, S., & Komalasarai, D. (2017). Pengaruh Likuiditas, Profitabilitas, Dan Solvabilitas Terhadap Harga Saham (Studi Kasus Pada Perusahaan Perbankan Yang Terdaftar Di Bursa
Efek Indonesia). Jurnal Akuntansi., 3(2), 77–89.
https://doi.org/https://doi.org/10.30656/jak.v4i1.219
Ogolmagai, N. (2013). Leverage Pengaruhnya Terhadap Nilai Perusahaan Pada Industri Manufaktur Yang Go Public di Indonesia. Jurnal EMBA, 1(3), 81–89.
https://doi.org/10.35794/emba.1.3.2013.1375
Oktaviani, T. N., & Sutarmin. (2022). Pengaruh Ukuran Perusahaan, Leverage, Kebijakan Dividen Dan Profitabilitas Terhadap Nilai Perusahaan. 4(1), 15–31.
https://doi.org/doi.org/10.47685/exchall.v4i1.226
Pracoyo, A., & Ladjadjawa, A. E. C. (2020). Pengaruh Non-Performing Loan, Loan to Deposit Ratio, dan Good Corporate Govern- ance terhadap Profitabilitas (ROA) atau Nilai e u ahaan ( obin’ Q) pe iode 2015- 2019. Jurnal Ekonomi, Manajemen Dan Perbankan, 6(3), 109–121. http://journal.ibs.ac.id/index.php/JEMP/article/view/234
Pramana, I. G. N. A. D., & Mustanda, I. K. (2016). Pengaruh profitabilitas dan size terhadap nilai perusahaan dengan CSR sebagai variabel pemoderasi. E-Jurnal Manajemen Unud, 5(1), 561–594. https://ojs.unud.ac.id/index.php/Manajemen/article/view/17586
Rompas, G. P. (2013). Likuiditas Solvabilitas Dan Rentabilitas Terhadap Nilai Perusahaan Bumn Yang Terdaftar Dibursa Efek Indonesia. Jurnal EMBA, 1(3), 252–262.
https://ejournal.unsrat.ac.id/index.php/emba/article/view/2014/1601
Sartono, A. (2016). Manajemen Keuangan Teori dan Aplikasi (4th ed.). Yogyakarta: BPFE.
Sheila, R. M., & Djawoto. (2019). Pengaruh Likuiditas, profitabilitas dan Leverage terhadap Nilai Perusahaan Foods and Beverages. Jurnal Ilmu Dan Riset Manajemen, 8(2), 1–19.
http://jurnalmahasiswa.stiesia.ac.id/index.php/jirm/article/view/872/882
Sintyana, I. P. H., & Artini, L. G. S. (2019). Pengaruh Profitabilitas, Struktur Modal, Ukuran Perusahaan Dan Kebijakan Dividen Terhadap Nilai Perusahaan. E-Jurnal Manajemen, 8(2), 7717–7745. https://doi.org/10.24843/ejmunud.2019.v08.i02.p07
Siregar, M. E. S., Dalimunthe, S., & Trijuniyanto, R. S. (2019). Pengaruh profitabilitas, ukuran perusahaan, kebijakan dividen dan struktur modal terhadap nilai perusahaan pada perusahaan manufaktur yang terdaftar di Bursa Efek Indonessia periode 2015-2017. Jurnal Riset Manajemen Sains Indonesia (JRMSI), 10(2), 356–385.
https://doi.org/doi.org/10.21009/JRMSI
Srihayati, D., Tandika, D., & Azib. (2015). Pengaruh Kinerja Keuangan Perbankan terhadap Nilai Perusahaan dengan Metode Tobin’s Q pada Perusahaan Perbankan yang listing di Kompas 100. 1(1), 43–49. https://doi.org/10.29313/.v0i0.467
Sunaryo, A. (2017). Terhadap Nilai Perusahaan Pada Perusahaan Manufaktur Di Bursa Efek Indonesia Agus Sunaryo. Jurnal Ekonomi & Bisnis, 8(2), 1–9.
https://doi.org/https://doi.org/10.55049/jeb.v8i2.48
Syamsuddin, L. (2016). Manajemen Keuangan Perusahaan. jakarta: RajaGrafindo Persada.
Utomo, M. (2019). Ramah Lingkungan dan Nilai Perusahaan. In CV. Jakad Publishing Surabaya 2019 Anggota IKAPI No.222/JTI/2019 (Vol. 151).
Wardani, A. P., & Haryanto, A. M. (2021). Analisis Faktor-Faktor Yang Mempengaruhi Non Perfoming Loan (NPL) Di Indonesia. Diponegoro Journal of Management, 10(3), 1–11.
Wati, T. K., Sriyanto, S., & Khaerunnisa, E. (2018). Pengaruh Kebijakan Dividen Terhadap Nilai Perusahaan Dengan Kebijakan Hutang Sebagai Variabel Intervening Pada Perusahaan Sub Sektor Industri Barang Konsumsi Periode 2011-2016. Sains: Jurnal Manajemen Dan
Bisnis, 11(1), 49–74. https://doi.org/10.35448/jmb.v11i1.4319
Wijaya, I. B. N. P., & Purnawati, N. K. (2014). Pengaruh Likuiditas dan Kepemilikan Institusional Terhadap Nilai Perusahaan Dimoderasi Oleh Kebijakan Dividen. E-Jurnal Manajemen, 3(12), 250412. https://ojs.unud.ac.id/index.php/Manajemen/article/view/10080