NEXT GENERATION QUANTITATIVE MEASUREMENTS TO VALIDATE A MODEL FOR SACCHAROMYCES CEREVISIAE
By
Christopher Clay Stowers
Dissertation
Submitted to the Faculty of the Graduate School of Vanderbilt University
in partial fulfillment of the requirements for the degree of
DOCTOR OF PHILOSOPHY in
Chemical Engineering
August, 2008 Nashville, Tennessee
Approved:
Professor Kenneth A. Debelak Professor Erik M. Boczko Professor Robert D. Tanner
Professor Todd D. Giorgio Professor Rick R. Haselton Professor Paul E. Laibinis
Copyright© 2008 by Christopher Clay Stowers All Rights Reserved
To Dad and Mom, Rex and Sharon Stowers and
My Wife, Monica Stowers
ACKNOWLEDGMENTS
I am forever grateful to my mentor, Prof. Erik Boczko, for his guidance and never-ending support during by doctoral studies. It is impossible for me to ever thank him enough for the countless hours of discussion and advice he provided throughout my graduate school work. Regardless of how busy he was, he never once turned me away when I wanted to discuss something. I hope that my current and future accomplishments will bring him satisfaction.
I also want to thank my advisor, Prof. Ken Debelak, for providing me guidance and focus during my graduate studies. I am sure that it would have been much more difficult to arrive at the end of my doctoral work without his support. I must also thank the members of my committee for providing guidance throughout graduate school and ensuring that my doctoral work was the best it could be. Their thoughtful criticisms have made me a better researcher. I especially want to thank Prof. Rick Haselton for providing laboratory space for many of my experiments.
I am also very grateful to my many collaborators. Much of the work presented here would not have been possible without their contributions. Below is a list of collaborators, including the section of this work to which they contributed: Erik Boczko (II-VI), Hyunju Ban (IV-VI), Doug Hackworth (III), Tomas Gedeon (III), Konstantin Mischaikow (III), Todd Young (IV), J. Brian Robertson (IV and V), Rick Haselton (VI), Carl Johnson (IV), and Robert D. Tanner (V & C).
I also gratefully acknowledge the support of the National Science Foundation (NSF) grant # DMS 0443855.
Finally, no one has supported me more than my family. I could never express in words how grateful I am to my parents. They have believed in me and supported me in all of my endeavors. They have always been excellent role models and have never wavered in their love and support. I am also grateful for all the love and support I have received from my wife. She has been overwhelmingly supportive of my studies, despite the many late nights in the lab. She has provided me abundant support during the last few months of my doctoral work when I needed it the most.
TABLE OF CONTENTS
Page
DEDICATION...iii
ACKNOWLEDGEMENTS...iv
LIST OF FIGURES ...ix
LIST OF TABLES...xiv
Chapter I. INTRODUCTION...1
Rationale...1
NCR Background ...1
History of Biological Measurement ...4
Steps of Gene Expression Measurement ...5
Cell Disruption ...6
Cell Cycle Synchrony...7
Polymerase Chain Reaction (PCR) ...9
References ...11
II. RELIABLE CELL DISRUPTION IN YEAST...13
Introduction ...13
Materials and Methods ...16
Disruption Assay ...16
Scoring Algorithm ...17
Cell Cycle Synchronization ...21
Results ...22
Conclusions ...32
References...33
III. EXTENDING CELL CYCLE SYNCHRONY THROUGH AN ANALYSIS OF VOLUME GROWTH AND VOLUME FILTRATION USING A STRUCTURED LESLIE MODEL...36
Introduction ...36
The Leslie Model...40
Variables ...42
Volume and Intervals of Time...42
Cell Death ...43
Volume Growth ...44
Cell Division...44
Milestones...46
Initial Conditions ...49
Filtration ...50
Materials and Methods...52
Cell Cycle Synchronization ...53
Bud Index Analysis...53
Cell Volume Measurement and Baby Machine Construction ...54
Results...55
Bud Index Dynamics ...55
Stationary Properties...57
Decay of Synchrony with Division Asymmetry ...58
Volume Filtration...60
Invariant Density ...67
Invariant Density ...69
Conclusions ...71
References ...75
IV. COMMUNICATION, CLUSTERING, AND ENVIRONMENTAL OSCILLATION IN POPULATIONS OF BUDDING YEAST ...79
Introduction ...79
Maintenance of Synchrony ...82
Clustering...87
Models of Growth and Division ...89
Advance and Delay Models...89
Leslie Model Simulations ...92
Materials and Methods ...93
Continuous Culture...93
Measurement of Bud Index and Cell Density...95
Gene Expression Measurements...95
Results ...96
Existence of Clusters ...96
Factors Consistent with Clustering...106
Gene Expression Measurements...107
Conclusions ...113
References ...115
V. PERIODIC FERMENTOR YIELD AND ENHANCED PRODUCT ENRICHMENT FROM AUTONOMOUS OSCILLATIONS...119
Introduction ...119
Materials and Methods ...123
Autonomous Oscillations...123
Measurement of Cell Density ...124
Measurement of Bud Index ...124
Calculation of Yield...124
Results ...126
Analysis of Fermentor Yield ...126
Population Structure, Biocomplexity and the Product Enrichment Ratio ...131
Accumulation of Biocomplexity...137
Demonstration of Asymptotic Periodicity ...137
Leslie Model of Yeast Growth and Division...140
Conclusions ...147
References ...150
VI. QUANTITATIVE PCR FOR DILUTE SOLUTIONS OF DNA ...153
Introduction ...153
Materials and Methods ...159
Preparation of Identical Replicates ...160
TAQ Polymerase Wear...161
Bead Filling Experiments ...162
Misclassification Analysis ...162
Results ...163
Conclusions ...185
References ...187
VII. CONCLUSIONS...190
Future Work...192
Appendix A. LESLIE MODEL MATLAB CODE...195
B. LUMINESCENCE REPORTER MATERIALS AND METHODS...205
References ...209
C. ACTIVITY BASED COST FUNCTIONS FOR ENZYMES...210
Abstract...210
Introduction ...211
Materials and Methods ...216
Results ...220
Conclusions...230
References ...232
D. MATHEMATICA SCRIPT FOR COMPUTING THE PROBABILITY OF MISCLASSIFYING CT VALUES ...234
E. MATHEMATICA SCRIPT FOR PLATE FILLING MODEL ...236
LIST OF FIGURES
Figure Page
1.1 The Nitrogen Catabolite Repression Circuit of Saccharomyces cerevisiae.
mRNA is represented by blocks in the diagram and genetic regulation is represented by arrows ...3 2.1 Yeast cells fluorescently stained with aniline blue to aid in interrogating the
integrity of cell walls. The panels of pictures describe the scoring algorithm developed to determine whether an individual cell should be scored as disrupted or intact ... 18 2.2 Demonstration of focal plane analysis for cell wall integrity. Panels A and B
represent two fluorescence images taken at different focal planes of the same yeast cell. Panels E-F represent four fluorescence images taken of a second cell.
The images demonstrate that the same yeast cell could look intact in one focal
plane, but obviously disrupted in another ... 19 2.3 Fluorescence images taken of yeast at various disruption times. Disruption
increases monotonically with disruption time ... 20 2.4 Percentage of disrupted yeast cells as a function of disruption time. The data
represent the average of six independent experiments. The data were modeled
with a time to failure Weibull distribution... 25 2.5 Total RNA yield from the lysate of disrupted cells normalized by the fraction of
disrupted cells for various disruption times. The time-course of data was fit to a line to validate the disruption scoring algorithm ... 29 2.6 Dependence of cell disruption on the cell cycle. Disruption times 20 minutes or
less produced disruption profiles strongly dependent on the cell cycle. A disruption time of 30 minutes uniformly disrupted cells regardless of cell cycle
position... 31 3.1 Graphical representation of the Leslie model for yeast volume growth and
division. Each row of cells represents a different age class of yeast and arrows
represent the process of division ... 41 3.2 Schematic representation of the cell volume filtration process. The vertical red
lines represent the lower and upper volume cutoffs. The volume milestones used for simulations are represented by the blue and green tick marks. ... 51
3.3 Experimental results and Leslie model simulations of bud index dynamics for two separate strains of yeast. The top panel represents data obtained from the literature for yeast strain X2180. The bottom panel represents data obtained in both continuous and batch culture for an alpha factor sensitive yeast strain
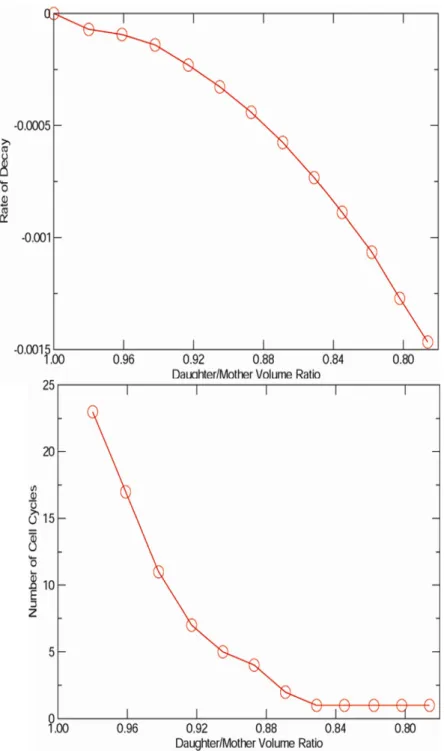
LHY3865 ... 56 3.4 The rate of synchrony decay and the theoretical number of synchronous cell
cycles determined from Leslie model simulations as a function of mother-
daughter asymmetry... 59 3.5 Leslie model simulation results using double stage filtration of yeast strain
X2180 at various volume cutoffs. The number of synchronous cell cycles is
plotted as a function of both the upper and lower volume cutoffs... 61 3.6 Leslie model simulation results using double stage filtration of yeast strain
LHY3865 at various volume cutoffs. The number of synchronous cell cycles is plotted as a function of both the upper and lower volume cutoffs... 62 3.7 Bud index oscillations of initially synchronized X2180 cells. The top left panel
represents the results of an unfiltered system. The other three panels represent
results obtained using double stage filtration cutoffs ... 63 3.8 Bud index oscillations of initially synchronized LHY3865 cells. The top two
panels were obtained using single stage filtration. The bottom two panels were obtained using double stage filtration ... 65 3.9 Single stage filtration results for strain LHY3865. The volume milestones for
this strain are represented by tick marks on the horizontal axis ... 66 3.10 The invariant population densities of X2180 with respect to replicative age.
The total population age distribution is also provided... 68 4.1 Bud index oscillations for yeast strain IFO0223 during continuous culture and
autonomous metabolic oscillations ... 85 4.2 Bud index oscillations for yeast strain Cen.PK 113-7D during continuous culture
and autonomous metabolic oscillations ... 97 4.3 Bud index and cell density oscillations for yeast strain Cen.PK 113-7D during
continuous culture and autonomous metabolic oscillations. The two waves of cell division and budding, which occur during one cell cycle time period, indicate that there are two main clusters of cells with respect to the cell cycle ... 99 4.4 The effect of pH on the period of dissolved oxygen oscillations in strain Cen.PK
113. The change in pH is believed to effect intercellular communication ... 103 4.5 Potential entrainment of an asynchronous culture of Cen.PK 113 by period
injection of 1 mM acetaldehyde during continuous culture... 105
4.6 Pol1 expression during autonomous metabolic oscillations of yeast strain Cen.PK 113. The expression peaks at the beginning of one of the oscillations,
indicating one of the clusters is currently traversing through the G1-S transition .... 110 4.7 GLN3 expression during autonomous metabolic oscillations of yeast strain
Cen.PK 113 under two different nitrogen sources, ammonia and arginine. The data indicate that GLN3 expression is periodic, but qualitatively different under ammonia and arginine nitrogen sources ... 111 4.8 DAL80 expression during autonomous metabolic oscillations of yeast strain
Cen.PK 113 under two different nitrogen sources, glutamate and arginine. The data indicate that GLN3 is periodic and very qualitatively similar under the two different nitrogen sources ... 112 5.1 Raw data collected for yeast strain LBGH-1022 during autonomous metabolic
oscillation. Biomass, glucose, and dissolved oxygen concentrations are shown... 128 5.2 Periodic biomass yield with respect to both oxygen and glucose for yeast strain
LBGH-1022 ...129 5.3 Periodic biomass yield with respect to dissolved oxygen for yeast strain Cen.PK
113...130 5.4 Autonomous dissolved oxygen oscillations of CEN.PK with simultaneous
measurement of the percentage of the cell population within G1. The data indicate that the population structure with respect to the cell cycle is periodic during the autonomous oscillations...132 5.5 Cell density measurements during autonomous oscillations of Cen.PK. The data
show that roughly two waves of division occur per yeast cell cycle ...133 5.6 A schematic representation of the population structure of the autonomously
oscillating yeast cell cycle. Ambient biocomplexity is also represented by the
blue shading on the diagram ...134 5.7 Periodic phase plane portrait of extracellular glucose concentration and total
biomass concentration for yeast strain LBGH-1022...136 5.8 A schematic representation of the Leslie model. Each age class is represented by
a corresponding horizontal line and residence time, τ...140 5.9 Leslie model simulations of product production and ambient biocomplexity.
The top panel represents the model of ambient biocomplexity and the promoter models for product formation at the single cell level. The bottom panel represents the total population behavior. The simulations demonstrate that product
concentration can be produced such that product concentrations will be
orthogonal to the concentration of biocomplexity ...145
5.10 A schematic representation of a novel product harvesting scheme to utilize cell cycle dependent production from multiple fermentors oscillating out of phase with
one another. This scheme is called CLOCKS...146
6.1 Ct values obtained from nearly 2,400 rt-PCR reactions ranging in DNA concentrations over nine orders of magnitude. The values were obtained using a threshold of 5 relative fluorescence units. ...164
6.2 Ct data distributions for various sample concentrations ranging nine orders of magnitude...165
6.3 An example Ct Method standard curve computed from nearly 2,400 independent reactions and 14 different sample concentrations...167
6.4 Relative errors associated with using the Ct Method for quantifying DNA concentrations. These errors were computed using various quantiles of the Ct data distributions and the linear regression of the Ct Method standard curve...168
6.5 Actual errors in terms of the number of DNA molecules associated with using the 60% quantile of the Ct data distributions and the Ct Method standard curve for quantitation. ...169
6.6 The probability of misclassification for using a single Ct value for quantitation. The results are plotted versus DNA concentration of the sample. A Hill’s function model for the process is also shown ...172
6.7 The probability of misclassification for using replicates of samples and obtaining an average Ct value prior to quantitation. Results are shown for 3, 6, 8, and 12 replicates ...174
6.8 TAQ polymerase efficiency as a function of thermo-cycling wear. The data demonstrate that enzyme efficiency decays over roughly forty cycles ...177
6.9 PCR results obtained from an endpoint analysis in a 384-well plate format. The threshold used for analysis was 5 relative fluorescence units. The theoretical plate filling curve is also provided...181
6.10 Theoretical standard deviation of the plate filling process as a function of the number of DNA molecules on the plate ...182
6.11 Experimental data for plate filling a 96-well flat bottom plate. 20 µm silicon beads were used ...184
C.1 Least-squares fit of invertase cost data to the enzyme cost objective function...222
C.2 Least-squares fit of papain cost data to the enzyme cost objective function.... ...223
C.3 Least-squares fit of elastase cost data to the enzyme cost objective function...224
C.4 Least-squares fit of alpha amylase cost data to the enzyme cost objective
function.... ...225 C.5 Least-squares fit of cellulase cost data to the enzyme cost objective function.... ...226 C.6 The generalized enzyme cost function segregated into regions based on the
purification method required to a particular level of enzyme purity.... ...227
LIST OF TABLES
Table Page
2.1 Fraction of disrupted yeast cells for various disruption times and six
independently performed replicates ...24 2.2 RNA yield in the lysate as a function of disruption time...27 2.3 The fraction of disrupted cells obtained by disrupted synchronized cells for
different time intervals...30 3.1 Volume milestones and growth parameters for yeast strain X2180 ...47 3.2 Volume milestones and growth parameters for an alpha factor sensitive yeast
strain LHY3865 ...48 3.3 Growth parameters used to study the impact of daughter to mother volume
asymmetry on cell cycle synchrony decay...49 3.4 Leslie model predictions of stationary properties compared to available
experimentally determined values in the literature...58 4.1 Composition of Mineral Solution A for making CEN.PK 113-7D yeast media ...94 5.1. Parameter values for the calculation of fermentor biomass yield...125 5.2. Leslie model parameters used to reproduce the cell cycle dependent oscillations
of CEN.PK 113-7D. Parameters are listed in terms of yeast replicative age...142 6.1. Hill’s function parameters used to fit the probability of misclassifying Ct values.
Parameters are provided for the case of running an individual PCR reaction as
well as various numbers of sample replicates...171 6.2. Hypothetical errors associated with serial dilutions with 20% incidental error,
caused by a 200 nL carry-over on the outside of a pipette tip. The end result is an error fold of 2.2 ...180 B.1. Primer sequences used to amplify the promoters of interest for the luciferase
based constructs ...206 C.1. Raw data collected for the development of activity based cost functions for
industrial enzymes ...219 C.2. Parameter values obtained by least squares fitting the objective function for
enzyme cost as a function of activity to raw data ...221
CHAPTER I
INTRODUCTION
Rationale
The study of dynamic biological systems is perhaps the most captivating of all scientific endeavors due to the observed robustness of the biological organism. The genetic networks that underpin these organisms must hold the keys to understanding their emergent behavior. However, quantitative techniques for interrogating these networks are currently in their infancy. Specifically, there exists a lack of sensitive and robust assays for measuring nucleic acids. There is also a lack of mathematical models pertaining to the population dynamics and asynchronous growth of organisms. These two complications make studying dynamic biological systems at the gene expression level impervious. Thus, the overall goal of this dissertation is to develop tools and techniques to be used to measure the quantitative behavior of biological systems at the gene expression level.
NCR Background
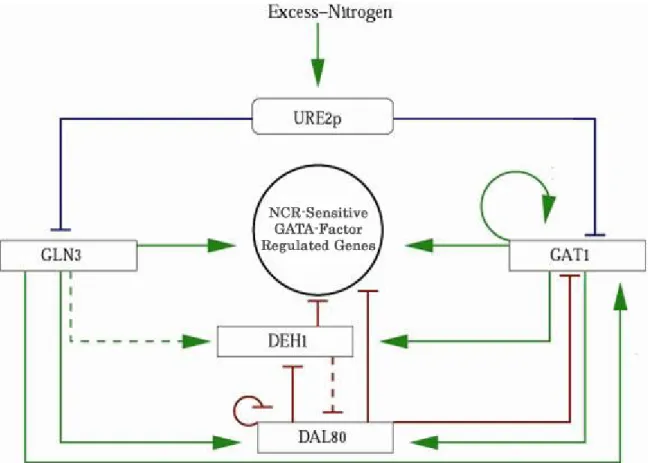
The specific system that provides the motivation for this work is an ostensibly simple stress response circuit in baker’s yeast, Saccharomyces cerevisiae, that regulates the organism’s genetic response to nitrogen limitation called nitrogen catabolite repression (NCR), see Figure 1.1. The circuitry of the network has been well studied for the last 40
years and comparatively much is known about its function; however, little is known about its dynamics 9,10. In order to study the dynamics at the same level of sophistication at which mathematical models have been formulated, accurate quantitative biophysical and biochemical techniques are required at molecular dimensions and on physiological timescales.
It is of widespread interest to measure the genetic response of an organism to stress. The NCR circuitry of Saccharomyces cerevisiae provides a challenging but tractable opportunity. Minimal mathematical models of the NCR circuit predict that the mitotic cell cycle will drive the expression of the GLN3-URE2p subcircuit causing their corresponding mRNA and protein species to oscillate in phase5,6. The measurement of such signals is important to further our understanding of the relationship between the organization of genetic circuitry and the dynamic responses that it is capable of transducing. That is, we are trying to understand the structure theorems that underpin what adaptation has forged into robust and responsive pathways working with the limitations imposed by biophysics. Understanding such theorems and their limitations will improve the understanding of the robustness of biological systems, help us build fault tolerant computer networks, design adaptive nano devices, and design more efficient bioprocesses.
Figure 1.1: The NCR circuit. The square blocks represent mRNA of the respective NCR gene. The rounded block represents the transcribed protein of the URE2 gene. Green arrows indicate up-regulation and blunted red arrows represent down-regulation at the level of transcription. Dashed lines represent a weaker response. Blue lines represent repression that is not at the transcription level.
The existence of regulatory loops, time delays, and complex transport phenomena has brought mathematical modeling and analysis to the forefront of systems biology. To date, many signal transduction motifs have been identified in well studied regulatory networks and also by large-scale screens 10. Carefully considered and important results about model identification for motifs and general reaction terms have appeared in the literature 4,21,22. General results for pattern forming circuits have also been published 12. Numerical screens have been performed suggesting that biologically adapted circuits possess exceptional robustness 24. Rigorous analyses have been performed on these circuits to understand the mathematical origins of robustness 3. The majority of these results come from systems that are relatively data poor. Whether or not these models and the information contained within them survive the test of time depends crucially on the ability to make careful measurements at the molecular level and on physiological timescales.
History of Biological Measurement
Unfortunately, many if not most traditional biophysical techniques were not developed with dynamics in mind and do not have the power to effectively interrogate the dynamics of genetic regulatory systems. It is important to realize that scientific progress typically hinges upon technological advancement. For example, the crowning achievement of the 1950's was the discovery of the structure of DNA that required the chemistry of crystallography, the physics of diffraction, and the mathematics of group theory to accomplish. Over the next decade, the tenets of the Central Dogma of Biology were established and gave biology its first real logical molecular underpinnings. Interestingly,
up until the early 1980's sophisticated studies of yeast physiology and biochemistry were routine 7,17,25. However, the focus on the gene as the fundamental unit of biological explanation led to a roughly 25 year change of focus toward static gene discovery and a near abandonment of individual and population physiology. Paradoxically perhaps, the ascendancy of genomics has now reintroduced the desire to understand individual and population physiology at the molecular level. Armed with molecular information and powerful computers, there has been a steady increase in literature involving the modeling of pathways, circuits, organelles, and even whole cells 20. In fact, it is the reductionists’
dream to build a computational model of a cell that would respond to stimuli as real cells do. Systems biologists from all disciplines have fully embraced this goal. This endeavor has exposed several experimental obstructions. We and many others have been forced to focus on the problem of measurement. For example, the basic biology lab staple of Southern Blotting was developed in the 1980’s and has been used countless times to provide evidence for the existence of a particular gene in a cell line; however, the technique lacks the sensitivity to detect subtle changes in gene expression. These subtle changes are often expected to be essential to the functional dynamics of gene regulatory networks6.
Steps of Gene Expression Measurement
Faced with the need to produce quantitative measurements of the NCR circuitry dynamics, but realizing that currently available techniques fall short of the needed quantitative accuracy, we began to analyze the measurement process step by step.
Quantitation of gene expression from regulatory networks can be separated into three
steps: nucleic acid harvesting through cell disruption (CHAPTER II), cell cycle synchronization/population modeling (CHAPTERS III, IV, & V), and nucleic acid quantification (CHAPTER VI). The inaccuracy of any of these processes impact the accuracy of gene expression data. In fact, depending on experimental design, other processes may be involved whose accuracy may also be essential to the overall accuracy of gene expression data. For example, an additional step such as reverse transcription is commonly used to convert harvested RNA into DNA prior to nucleic acid quantitation.
However, this dissertation will focus on the three steps mentioned above.
Cell Disruption
Cell disruption is perhaps the most commonly overlooked source of quantitative error in studies where biomolecules are quantified from single cells. It fact, the measurement of biomolecules is directly proportional to the number of cells disrupted. This dependency lends the process to errors since samples are typically taken in a time-course and are disrupted independently. Variations in the percentage of disrupted cells from sample to sample produces an inherent error in the end quantitation. One could imagine that particular cells may be more likely to disrupt than others, possibly due to replicative age or cell cycle position. Therefore, gene expression dependent on age or the cell cycle may be inaccurately quantified from obtaining a biased pool of nucleic acids through typical cell disruption protocols. Many use internal controls such as actin to normalize disrupted samples, but this process could be logically circular if variations in the standard exist.
CHAPTER II of this dissertation provides an in-depth analysis of cell disruption and the
process of harvesting nucleic acids from yeast. Modifications to traditional techniques are proposed in order to provide more reliable and uniform cell disruption.
Cell Cycle Synchrony
Cell cycle dependence is also a complication in quantifying gene expression values. The cell cycle poses a significant problem for the following reason. As yeast age, their volume grows. There is a volume checkpoint required of newly budded daughter cells to enter the cell cycle that immediately and completely dephases mothers and daughters making the culture notoriously asynchronous. The quantitative phase shift depends on the specific growth conditions, but in rich media it is approximately 11 minutes, or 1/12th of the total cell cycle time. This small difference will within three cell cycles drive the entire population to stationary asynchrony that will obscure any periodic signal. In addition, since all age classes are mixed in a stationary culture, one cannot discern age differences in gene expression – an entirely open and fascinating subject. Furthermore, at stationary state, cells are expected to be uniformly distributed around the cell cycle with respect to time. Thus, if a particular gene is expressed in sinusoidal form around the cycle, but a pool of nucleic acids are harvested from a population of cells distributed uniformly around the cycle, a constant signal instead of the dynamic signal of the individual cell will be detected.
Common techniques for achieving cell cycle synchrony in yeast produce a mere 3 to 4 synchronous cycles, results from which are typically far short of validating mathematical models for gene network dynamics. Additionally, many of these techniques, such as
alpha factor arrest, starvation, and elutriation could likely produce a stress response related to the gene under study, leading to a measurement influenced by the measurement process itself. For this reason, this dissertation focuses on alternative techniques capable of producing extended cell cycle synchrony without invasive methods (CHAPTER III), possibly providing the missing link to obtaining more useful information about the expression patterns of cell cycle dependent genes. This technique utilizes continuous volume filtration on synchronous yeast populations as a mechanism for maintaining synchrony.
A further alternative for extending cell cycle synchrony is to exploit autonomous cell cycle oscillations that have been reported in the literature for over four decades 8,13,14,18,23
. Many of the details of the feedback mechanism(s) that underlie these oscillations are still poorly understood. These oscillations provide an interesting research opportunity as well as a vehicle for producing synchrony. A potential disadvantage is that these oscillations have only been achieved by carefully controlling the environment (dilution rate, pH, dissolved oxygen, nutrients, etc.) within the bioreactor. This dependency means that the environmental variables are limited in their flexibility during experiments while preserving culture synchrony. This restriction potentially limits the ability to learn about the dynamics of the NCR circuitry. CHAPTER IV of this dissertation focuses on the development of using these oscillations as a tool for measuring synchronous gene expression, particularly those genes of the NCR circuitry.
The autonomous oscillations described in Chapter IV are typically considered an obstruction within the bio-manufacturing industry 15. In fact, just as these oscillations
can be utilized by scientists to measure synchronous gene expression, as described in Chapter IV, they could also be utilized by engineers as a mechanism of persistent synchronous production of cell cycle dependent bio-materials. Downstream bioprocessing costs constitute over 75% of the total cost of production for bio-materials1. These costs are generally associated with purifying a desired product away from undesired biological material, the ambient bio-complexity. By utilizing systems that permit synchronous production of bio-products, rather than the typical asynchronous production, the product concentration within the effluent of the bioreactor can be enriched relative to the biocomplexity. Chapter V of this dissertation focuses on developing these ideas.
Polymerase Chain Reaction (PCR)
Since many genes, including those of the NCR circuit, are believed to be cell cycle dependent, there is a vast research effort to detect expression levels from single cells in order to avoid population convolution of the measured signal 16. The only readily available technique for quantifying of nucleic acids at the single cell level is the Polymerase Chain Reaction (PCR). The advantage of PCR over other existing techniques is the ability to exponentially amplify small signals into a detectable range.
Unfortunately, the PCR process also amplifies any error created in sample preparation.
Additionally, problems with DNA contamination become increasingly more important as samples become more dilute. Thus, the two largest problems of using quantitative PCR, exponential amplification of error and DNA contamination, are most prevalent within the realm of DNA concentrations expected within a single cell.
Although the literature has been flooded with PCR studies in virtually every realm of biology, very few studies have investigated the quantitative nature of the technique itself
2,11,19
. Over the past two decades, PCR has been used countless times to quantify nucleic acids, yet the vast majority of studies seem to avoid the topics of accuracy and reproducibility. Furthermore, no study of which we are aware has investigated the quantitative nature of PCR for the realm of dilute nucleic acid concentrations pertaining to single cell measurements. For this reason, a section of this dissertation focuses on nucleic acid quantitation using PCR, with specific emphasis on dilute nucleic acid concentrations (CHAPTER VI).
The research presented in this dissertation focuses on the development of new tools and techniques to make quantitative measurements on subtle changes in gene expression patterns. Cell disruption and the harvesting of nucleic acid molecules are explored and a quantitative model for a specific protocol is developed. Two separate strategies for combating cell cycle dependence of gene expression are explored. These two techniques have separate advantages and defects, and these are discussed later. Lastly, the direct quantitation of nucleic acids is explored through an analysis of reproducibility and accuracy of PCR.
References
1. Aldridge, S. 1996. Downstream processing needs a boost. Genetic Engineering and Biotechnology News. 26:1.
2. Abramov, D., Trofimov, D. and Rebrikov, D. 2006. Accuracy of a real-time polymerase-chain-reaction assay for quantitative estimation of genetically modified food sources in food products. Applied Biochemistry and Microbiology. 42:428-430.
3. Barkai, N. and Leibler, S. 1997. Robustness in simple biochemical networks. Nature.
387:913-917.
4. Beck, T. and Hallman, M. 1999. The TOR signaling pathway controls nuclear localization of nutrient regulated transcription factors. Nature. 402:689-692.
5. Boczko, E.M., Cooper, T.G., Gedeon, T., Mischaikow, K., Murdock, D.G., Pratap, S., and Wells, K.S. 2005. Structure theorems and the dynamics of nitrogen catabolite repression in yeast. Proc. Natl. Acad. Sci. 102:5647-5652.
6. Boczko, E.M., Gedeon, T., and Mischaikow, K. 2007. Dynamics of a simple regulatory switch. Journal of Mathematical Biology. 55:679-719.
7. Brewer, B.J., Chlebowicz-Sledziewska, E., and Fangman, W.L. 1984. Cell cycle phases in the unequal mother/daughter cell cycles of Saccharomyces cerevisiae. Mol.
Cell. Biol. 4:2529-2531.
8. Chen, Z., Odstrcil, E., Tu, B., and McKnight, S. 2007. Restriction of DNA replication to the reductive phase of the metabolic cycle protects genome integrity. Science.
316:1916-1919.
9. Cooper, T. 2002. Transmitting the signal of excess nitrogen in Saccharomyces cerevisiae from TOR proteins to the GATA factors: connecting the dots. FEMS Microbiology Reviews. 26: 223-238.
10. Cunningham,T. Rai, R., and Cooper, T. 2000. The level of DAL80 expression down- regulated GATA factor-mediated transcription in Saccharomyces cerevisiae. Journal of Bacteriology. 182:6584-6591.
11. Diehl, F., Li, M., Dressman, D., He, Y., Shen, D., Szano, S., Diaz, D., Goodman, S., David, K., Juh, H., Kinzler, K., and Vogelstein, B. 2005. Detection and quantification of mutations in the plasma of patients with colorectal tumors. Proc. Natl. Acad. Sci.
102:16368-16373.
12. Ermentrout, B. 1998. Neural networks as spatio-temporal pattern-forming systems.
Rep. Prog. Phys. 61:353-430.
13. Essajee, C. and Tanner, R. 1979. The effect of extracellular variables on the stability of continuous baker’s yeast-ethanol fermentation process. Process Biochemistry. 25:16- 21.
14. Heinzel, E., Dunn, I., Furukawa, K., and Tanner, R. 1982. Modeling of sustained oscillations observed in continuous culture of Saccharomyces cerevisiae. Proceeding of the 1st IFAC Workshop. 57-65.
15. Jules, M., Francois, J., and Parrou, J. 2005. Autonomous oscillations in Saccharomyces cerevisiae during batch cultures of trehalose. FEBS Journal. 272:1490- 1500.
16. Longo, D. and Hasty, J. 2006. Dynamics of single cell gene expression. Mol. Syst.
Biol. 2:64.
17. Lord, P. and Wheals, A. 1980. Asymmetrical division of Saccharomyces cerevisiae.
J. of Bacteriology. 142:808-818.
18. Murray, D.B., Klevecz, R.R., and Lloyd, D. 2003. Generation and maintenance of synchrony in Saccharomyces cerevisiae continuous culture. Exp. Cell Res. 287:10-15.
19. Roussel, Y., Harris, A., Lee, M., and Wilks, M. 2007. Novel methods of quantitative real-time PCR data analysis in a murine Helibobacter pylori vaccine model. Vaccine.
25:2919-2929.
20. Sanbonmatsu, K. and Tung, C. 2006. Large-scale simulations of the ribosome: a new landmark in computational biology. J. of Theoretical Biology and Biophysics. 46:334- 342.
21. Santillan, M. and Mackey, M. 2004. Influence of catabolite repression and inducer exclusion on the bistable behavior of the lac operon. Biophysical Journal. 86:1282-1292.
22. Swameye, I., Muller, T., Timmer, J., Sandra, O., and Klingmuller, U. 2003.
Identification of nucleocytoplasmic cycling as a remote sensor in cellular signaling by data-based modeling. Proc. Natl. Acad. Sci. 100:1028-1033.
23. Tu, B.P., Kudlicki, A., Rowicka, M., and McKnight, S.L. 2006. Logic of the yeast metabolic cycle: temporal compartmentalization of cellular processes. Science. 310:1152- 1158.
24. von Dassow, G., Murno, E., and Odell, G. 2000. The segment polarity network is a robust developmental module. Nature. 406:188-192.
25. Wheals, A.E. 1982. Size control models of Saccharomyces cerevisiae cell proliferation. Molecular and Cellular Biology. 2:361-368.
CHAPTER II
RELIABLE CELL DISRUPTION IN YEAST
Introduction
Yeast is an important eukaryotic model system whose physiology, regulation, and adaptation is beginning to be understood in quantitative terms 1,2,3,4,7,17,26,28,29
. As systems biology is evolving ever more sophisticated mathematical models, the need and desire for precise quantitative measurements is increasing. It is a consequence, perhaps of some cosmic conservation that while yeast genetics are relatively straightforward, their biochemistry is complicated by their thick cell wall that can withstand extreme pressures of greater than 300 MPa 8. This fact complicates the procedures to isolate and analyze intracellular macromolecules and metabolites.
There has been a long-standing tradition in biochemistry and molecular biology to normalize measured quantities, such as mRNA, with constitutive internal controls. Actin, for instance, is thought to be a housekeeping gene and is often used to normalize the loading and comparison of samples. A problem with this practice is that without a known gold standard this approach leads to circular reasoning. What if actin levels are instead oscillating? Then anything that appears as constant compared to actin, is not actually constant, but rather oscillating. As methods of detection increase in resolution, the problem of normalization becomes only more apparent. Our ultimate goal is to resolve a conjecture that certain yeast mRNA concnetrations are oscillating periodically with the
cell cycle as predicted by a mathematical model 2,7. There is growing evidence for and renewed interest in periodic gene expression and its relation to the cell cycle as well as to ultradian rhythms whose causes remain uncertain 12,16,18,24
. As this interest grows, so does the need for logically sound and quantitative protocols for normalization.
In order to convincingly demonstrate the precise dynamical behavior of a given mRNA species from a culture of yeast cells, it is important to demonstrate a logically and practically sound method for normalization between sample variations. Many recent papers have discussed both the theoretical and practical issues surrounding the normalization problem 5,11,15,25. Because the use of internal controls is inherently circular, we are drawn to the logical clarity of external controls 28. In this practice, a known quantity of foreign RNA is introduced into the sample during extraction. The single assumption of this practice is that the introduced species is indistinguishable from the other RNA molecules from the point of view of the remainder of the extraction process.
The practice depends on a single parameter: how much external control does one add to each sample?
Typically, in a time course, independent samples will contain different numbers of cells.
With the use of a coulter counter, it is possible to directly measure the total volume of cells in a sample. It seems natural and reasonable that an external control proportional to the total volume of disrupted cells be used to normalize mRNA expression. Thus, a logical goal would be to spike yeast samples with a quantity of external RNA control that is proportional to the total sample volume. If, however, the volume of cells disrupted by a method for RNA extraction is not a constant and reproducible fraction of the total cell
volume, then this practice cannot work. We consulted the literature for data describing a method to quantitate cell disruption and found none. This problem is typically of the nature of laboratory folklore, and we found unreferenced statements similar to the following:
‘ Disintegration of yeast cells has been estimated by protein concentration in the supernatant’ 22.
It is important to observe that disruption for the purpose of biochemical isolation is related to cell wall integrity and not cell vitality. This work demonstrates that the dye aniline blue, that specifically binds β 1,3-Glucan, clearly distinguishes disrupted cells13,14. In typical yeast disruption protocols, cells suspended in a phenol chloroform mixture are disrupted by beating them against glass microbeads on a vortex mixer. The protocol suggests beating for 10 minutes. The data taken in this study demonstrate that 10 minutes is sufficient to disrupt roughly 57% +/- 13, while disruption greater than 94% +/-3 requires 30 minutes. Furthermore, agitation times short of 30 minutes are shown to be insufficient to uniformly disrupt cells across all phases of the cell cycle.
Because the percentage of cells disrupted at time t is a monotonically increasing function and the damage sustained by a cell over time is cumulative, it is reasonable to suspect that this process is modeled by a cumulative distribution function. The data generated in this study are used to demonstrate that the percentage of cells disrupted by the protocol after t minutes of agitation is well modeled by a Weibull distribution as shown below in Equation (2.1),
β
α)
1 (
) (
t
e t
F = − − Equation (2.1)
This distribution has found extensive application in engineering problems involving fatigue, fracture, and reliability modeling 19. The shape parameter β allows one to capture processes that have time-dependent, non-constant failure rates. The data collected in this study show a decreasing failure rate that is consistent with the observation of cell cycle phase dependent disruptability.
Materials and Methods
Yeast cells of Saccharomyces cerevisiae strain LHY3865 (mat a- URA, LEU, bar1∆) were grown in YNB media without ammonia or amino acids and with 100 mg/L leucine, 20 mg/L uracil, 0.2% glutamine, and 2% glucose at 30 °C. Batch cultures were grown with agitation at 225 rpm in a New Brunswick Innova 44 orbital incubator/shaker.
Continuous cultures were grown in a New Brunswick BioFlow 110 3.0 L bioreactor with a dilution rate of D=0.35 hr-1, the pH was maintained at 5.3 standard units by sparging CO2, and the culture was aerated with a Rushton-type impeller run at 225 rpm. RNA quality was determined with an Agilent bioanalyzer 2100 Expert System.
Disruption Assay
Cells were harvested from batch cultures or from continuous cultures from the bioreactor at OD600=0.6 and pelleted by centrifugation at 12,000 rpm for 2 minutes. A scaled down Ambion RiboPure assay (kit #1926) was performed according to the described protocol with the following modifications: the reactions were performed in 0.2 mL PCR tubes and the reagents were scaled down 25-fold (19 µL of lysis buffer, 2 µL of 10% SDS, and 19 µL of phenol chloroform mixture (60:40) per reaction).
The lysis mixture was added to a PCR tube containing approximately 30 µL of cold zirconia beads (supplied within the Ambion kit). Each PCR tube was fit inside a 1.5 mL Epindorf tube, placed in a vortex adapter, and agitated for the specified time. The lysate was rinsed from the PCR tube with several washes of phosphate buffered saline (PBS) to ensure that all cells, particularly damaged cells, were washed free from the beads. The lysate was pelleted by centrifugation for 5 minutes at maximum speed (15,000 rpm). The RNA enriched supernatant was removed for subsequent analysis, while the remaining cell pellet was resuspended in 250 µL of GIBCO 1x PBS (#14040-133). Aniline blue Sigma (#415049) was added to the cell lysate at concentration of 1 mg/mL. The stained lysate was analyzed using a conventional microscope equipped with a DAPI filter.
Scoring Algorithm
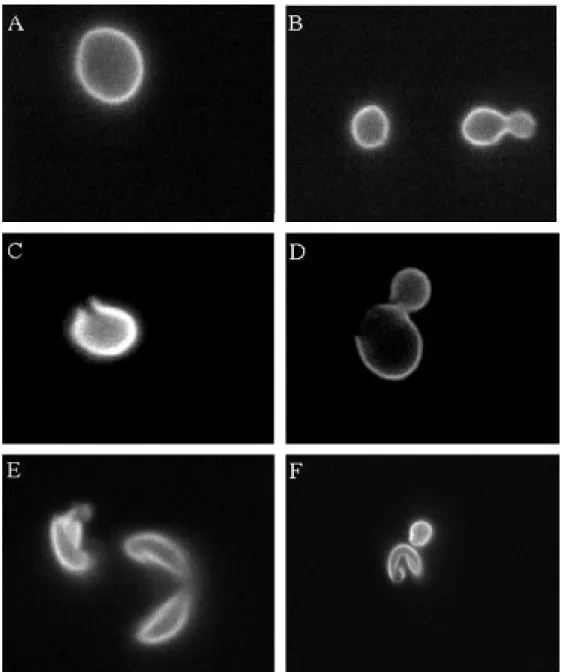
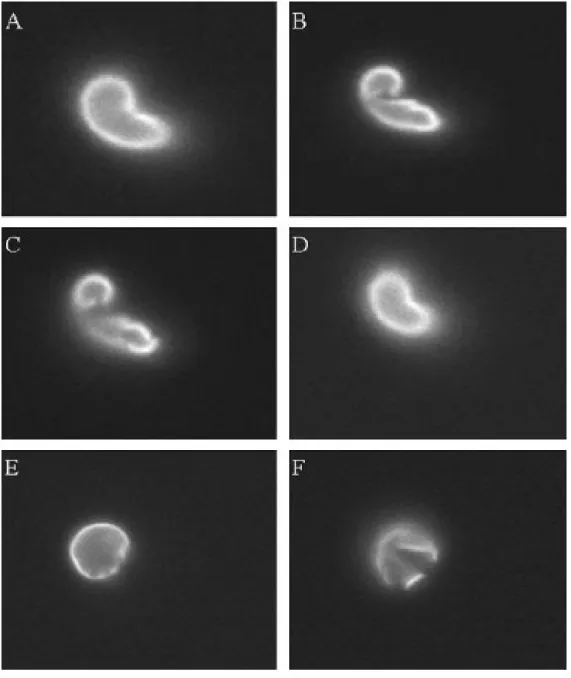
The aniline blue dye robustly illuminates the cell wall allowing interrogation of individual cell wall integrity. Stained cells were scored as intact or disrupted by visual inspection with the following criteria: A disrupted cell has sustained sufficient damage to spill its intracellular contents to the void. The decision process is illustrated in Figures 2.1-2.3. Typically, cells judged as disrupted had collapsed intracellular compartments or holes within the cellular membrane comprising at least 20% of the surface area of the cell. Cells with minimal damage to their cellular membrane were scored as intact. Cells with substantial damage often exhibited collapsed intracellular compartments allowing them to be clearly scored as disrupted, see for instance Figure 2.1-E and Figure 2.2 (all but E) and Figure 2.3-C. Individual cells were scrutinized in several focal planes to ensure accuracy (see Figure 2.2). Cells were scored 100 at a time. Each estimate of the fraction disrupted was computed from no less than 9 independently prepared slides.
Figure 2.1: The panels illustrate the visual scoring algorithm designed to determine cell disruption. Cells were labeled with aniline blue. The cell in image (A) is completely intact. The cells in image (B) appear to have small nicks in their cell wall, but these are deemed insufficient to spill their intracellular contents. The budded cell is considered as a single cell because no septum has yet formed. The cell in image (C) has sustained more pronounced damage, but is deemed intact because its contents appear to remain intracellular. Of the two cells in image (D), the mother cell is disrupted. The daughter is considered her own cell and remains intact. The cell(s) of image (E) are considered disrupted as their cell walls are cleaved and they have released their contents to the void.
In the final frame (F), one of the two cells is deemed as disrupted.
Figure 2.2: This panel of images illustrates the importance of the focal plane in determining cell disruption by the scoring algorithm. Images A-D shows four different focal planes for the same cell. Accordingly, this cell was classified as disrupted. The images in E-F support the same conclusion for a different cell. In our counting procedure, cells were scrutinized 100 at a time and each cell was individually examined for defects to ensure accuracy.
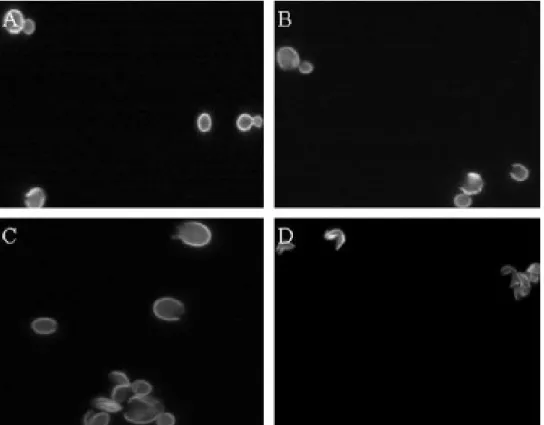
Figure 2.3: The images in this panel are taken along a time course of disruption and are representative of the process. Image (A) shows cells subjected to 2 minutes of disruption.
All of the cells in this image were deemed intact. Image (B) is taken after 10 minutes of disruption, the standard time suggested by the protocol. Two of the five cells were scored as disrupted. Image (C) is taken after 20 minutes of disruption. Six of the nine cells in the field were scored as disrupted. Image (D) shows cells after 30 minutes of disruption and all of the cells in this frame were scored as disrupted.
Cell Cycle Synchronization
Yeast cells were arrested through the addition of 3x10⁻⁵ M α-factor mating pheromone (Sigma #63591) and were incubated for 3 hours. Cells were subsequently released from arrest by pelleting followed by three washes with fresh pre-conditioned media, free of α- factor, containing 0.1 mg/mL Pronase E (Sigma # P-6911). The preconditioned media was prepared by allowing LHY3865 yeast cells to grow within the media for 4 hours at OD600 = 0.4 before being removed by a 0.2 µm filter. The synchronized cells were grown in the bioreactor as described above and were harvested at six time points pre- determined to correspond to critical points within the cell cycle. The time points were determined from preliminary experiments using microscopy to establish the timing of standard cell cycle morphological landmarks characteristic of cell cycle transition 9,10. Briefly, these landmarks are the following: G1 is marked by the separation of a parent and daughter cell, the beginning of S and end of G1 is marked by bud emergence, the beginning of the M phase is marked as the emergence of bud necking. It is widely accepted that the S portion of the cell cycle is 20-30 minutes for Saccharomyces cerevisiae. For the strain used in this study, we have determined S to be approximately 30 minutes by analyzing volume growth measurements.
Results
The disruption of the yeast cells by mechanical agitation was visualized because the dye aniline blue clearly stains the cell walls of budding yeast such that it was possible to monitor and score cell breakage as described above. It was an important consideration to find a dye that did not simply stain for cell vitality, but allowed us to assay cell wall integrity since mechanical agitation is designed to liberate the intracellular contents of cells through rupture.
Since we know of no protocol or device that is capable of directly measuring the degree to which the intracellular contents of a cell are free for extraction, an indirect measurement was utilized. The staining procedure and the scoring protocol that was employed produced consistent and reproducible results. This judgment is based on several independent observations. First and foremost, cellular disruption through mechanical agitation is a cumulative process and the fraction of disrupted cells as a function of time should be modeled by a cumulative distribution function. We found that our data are well modeled by a Weibull distribution. Second, the relative recovery of well mixed intracellular species should be proportional to the relative volume of disrupted cells. We also found this to be true.
The data in Table 2.1 summarize the results of six independent experiments. Each of the individual data points describing the degree of disruption is the result of considering over 900 independent cells. These data were used to produce the graph in Figure 2.4 that shows how the variance decreases with agitation time and how the data are well
described by a Weibull distribution with scale parameter α=10.97 min and shape β=0.77.
The significance of the shape parameter is that unlike an exponential or Poisson process, the Weibull process with β < 1 implies a nonconstant disruption rate that is decreasing with time. Fewer cells are being disrupted per unit time as the agitation time increases.
The data can also be accurately modeled by an exponential function. Fitting the data to a single parameter exponential function provides a similar value for the time constant, α, of 11.65 min. The cells described by the data in Table 1 were harvested at OD600=0.6 near mid-log phase. The same quantitative results were observed for cells at lower OD600=0.4 and higher OD600=1.0 densities, and also with another strain of Saccharomyces cerevisiae BY4743(data not shown).
Table 2.1: Data and statistics summarizing the percentage of cells disrupted from six identical and independent (iid) experiments. Each individual entry is the result of inspecting at least 900 aniline stained yeast cells. The average values and their standard deviations (SD) are plotted in Figure 2.4. Among other things, these data indicate that 30 minutes is sufficient to reproducibly disrupt greater than 90% of cells with a coefficient of variation (CV) of less than 4%.
Time
(min) Fraction disrupted (iid) samples 1-6 Average SD CV 2 0.230 0.375 0.346 0.374 0.215 0.060 0.267 0.124 0.463 10 0.657 0.628 0.644 0.636 0.504 0.332 0.567 0.128 0.226 20 0.853 0.838 0.863 0.832 0.720 0.594 0.783 0.106 0.136 30 0.945 0.957 0.962 0.963 0.888 0.897 0.935 0.034 0.036
Figure 2.4: The best fit Weibull distribution to the cell disruption data tabulated in Table 2.1. The corresponding best fit parameters are α=10.97 min and β=0.77.
The data in Table 2.2 describe the quantitative yield of RNA recovered from 6 independent experiments. The high quality of the extracted RNA is inferred in part from the RIN (RNA Integrity Number) that were determined through bioanalysis21. All of the samples had RIN numbers between 9.8 and 10. The 260:280 ratios of all the samples lie between 2.11 and 2.29 and the 260:230 ratios lie between 2.0 and 2.47. Thus, the quality of the extracted RNA does not decrease with increasing agitation times. The data in Table 2.2 clearly indicate that the quantity of extracted RNA increases with disruption time. In order to demonstrate that the yield is proportional to fraction of cells disrupted, the ratio of the yield of RNA, Y, is plotted relative to the fraction of disrupted cells, F, as counted by the disruption assay developed in this study (see Figure 2.5). Finally, we observe that the variance in yield is markedly decreased with 30 minutes of disruption.
These observations support the notion proposed above that the scoring method employed is at least consistent.
Table 2.2: RNA yield is shown as a function of disruption time. The results from six independent and identical experiments are shown.
Time(min) RNA yield (ng/µL)
2 86.2 89.5 140.8 146.3 178.6 191.1
10 202.9 228.6 258.1 283.5 290.1 305.6
20 328.8 357.6 372.4 480.2 483.2 492.7
30 543.3 557.1 558.1 564.9 566 605.7
In addition to exploring the behavior of stationary batch cultures, we explored the degree of disruption as a function of the cell cycle phase and agitation time. The cell cycle data are summarized in Table 2.3 and are plotted in Figure 2.6. The data show that agitated yeast cells are most likely to break in M-phase and that the degree of disruption approximates a saw tooth function around the cell cycle, with a linear increase in disruptability from G1 to M and then back again. It has previously been observed that cells are heartiest in G120
. The observed cell cycle dependent disruptability is consistent with the observation that FKS1 expression is cell cycle dependent and peaks in G123
. FKS1 encodes a subunit of β 1,3-glucan synthase6.
Figure 2.5: The recovered yield of RNA is proportional to the fraction of disrupted cells.
The recovered yield of RNA from six independent experiments, see Table 2.2, were divided by their respective fraction disrupted and normalized by the total average RNA yield per fraction of disrupted cells. The means and standard deviations are plotted along with the best fit line. The best fit slope is 0.008 and the intercept is 0.83. These data indicate that the yield of mRNA is directly proportional to the fraction disrupted.
Table 2.3: Data summarizing the percentage of cells disrupted as a function of disruption time and as a function of the cell cycle. The data are plotted in Figure 2.6.
Time (min) Cell Cycle
Phase 2 10 20 30
G1 Release 0.118 0.357 0.478 0.929
G1 0.192 0.296 0.604 0.965
G1-S trans 0.277 0.513 0.652 0.905
S 0.265 0.541 0.832 0.973
S-G2 trans 0.384 0.688 0.929 0.957
M 0.462 0.708 0.947 0.945
M-G1 trans 0.214 0.441 0.611 0.904
Figure 2.6: Cell disruption as a function of the cell cycle and agitation time. For a given agitation time less than 30 minutes, cell disruptability grows throughout the cell cycle and is maximized in M-phase. Thirty minutes agitation is sufficient to achieve uniform disruption. The intervals between cell cycle phases are plotted as equidistant for convenience. The blue curve shows the results for 2 minutes of agitation, the green curve is 10 minutes, the cyan curve is 20 minutes, and the red curve is 30 minutes.
The marked difference in disruptability is consistently and reproducibly seen for agitation times less than 30 minutes. At and beyond 30 minutes of agitation, cells from the different phases of the cell cycle suffer similar amounts of disruption at greater than 90%, in agreement with the batch culture data. Finally, we observe that the phase dependent disruptability is consistent with the calculated nonconstant and decreasing disruption rate implied by β < 1 as discussed previously. The phase dependent disruptability would explain why the data are better fit by the Weibull distribution with shape parameter β=0.773 than with an exponential distribution.
Conclusions
Understanding how the expression of arbitrary genes are related to and regulated by the cell cycle is a central question being pursued vigorously by systems biologists and has direct implications for diseases like cancer. The most important conclusion that can be drawn from these data is that disrupted populations, unless they are completely broken, can be biased depending on the length and degree of agitation. Supernatants from disrupted batch cultures of yeast will be biased at least with respect to the cell cycle unless the cells are agitated long enough. This bias could in fact be exploited to an advantage for the selective harvest of bio-molecules. The results of this study indicate that for shorter disruption times, cells in the M- phase of the cell cycle are most likely to be disrupted, promoting selective harvest of biomolecules from these cells.
It is not yet clear how the expression of genes are linked quantitatively to the cell cycle;
however, it is clear that experimental designs will impact the results and hence the
interpretation of the data. Thus, every effort must be made to understand and properly control quantitative assays of gene expression, protein, lipid, or metabolite levels. We were not able to find data of the type reported here in the current and past literature nor were we able to find it in manufacturer’s technical reports.
This study demonstrates that for a popular commercial method, 30 minutes of mechanical agitation is sufficient to disrupt cells uniformly with respect to the cell cycle and reproducibly with a coefficient of variation that is less than 4% and such that greater than 90% of the total cell volume is disrupted. Additionally, the results show that this period of time does not affect the yield nor the quality of recovered total RNA. This work also demonstrates that the Weibull cumulative distribution function provides a reasonable model to describe the process of yeast cell disruption by mechanical agitation.
References
1. Blank L., Kuepfer L., and Sauer U. 2005. Large scale analysis reveals mechanistic principles of metabolic network robustness to null mutations in yeast. Genome Biology 6:R49.
2. Boczko E., Cooper T., Gedeon T., Mischaikow K., Murdock D., Pratap S., and Wells K. 2005. Structure theorems and the dynamics of nitrogen catabolite repression in yeast.
Proc. Natl. Acad. Sci. 102:5647-5652.
3. Chen C., Calzone L., Ccikasz-Nagy A., Cross R., Novak B., and Tyson J. 2004.
Integrative analysis of cell cycle control in budding yeast. Mol. Biol. Cell. 15:3841-3862.
4. Cross F., Archambault V., Miller M., and Klovstad M. 2002. Testing a mathemtical model of the yeast cell cycle. Mol. Biol. Cell 13:52-70.
5. Dheda K., Huggit F., Bustin S., Johnson M., Hook G., and Zumla A. 2004. Validation of houskeeping genes for normailzing RNA gene expression in real time PCR.
BioTechniques. 37:112-114.
6. Douglas C., Foor F., Marrinan J. et al. 1994. The Saccharomyces cerevisiae FKS1 gene encodes an integral membrane protein that is a subunit of 1,3-β-D-glucan synthase.
Proc. Natl. Acad. Sci. 91:12907-12911.
7. Gedeon T., Boczko E., and Mischaikow K. 2007. Dynamics of a simple regulatory switch. Journal of Mathematical Biology. 55:679-719.
8. Hartman C. and Delgado A. 2004. Numerical simulation of the mechanics of a yeast cell under high hydrostatic pressure. J. Biomechanics. 37:977-987.
9. Hartwell L. and Unger M. 1977. Unequal division in Saccharomyces cerevisiae and its implications for the control for the cell division. J. Cell. Biol. 75:422-435.
10. Hartwell L. 1974. Saccharomyces cerevisiae cell cycle. Bacteriol. Rev. 38:164-198.
11. Kanno J., Aisiki K., Igarashi K., Nakatsu N., Ono A., Kodama Y., and Nagao T.
2006. Per-cell normalization method for mRNA measurement by quantitative PCR and microarrays. BMC Genomics. 7:64.
12. Keulers M., Sazuki T., Satroutdinov A., and Kuriyama H. 1996. Autonomous metabolic oscillations in continuous culture of Saccharomyces cerevisiae grown on ethanol. FEMS Micro. Lett. 142:253-258.
13. Kipper F., and Lloyd D. 1995. The aniline blue flourochome specifically stains the septum of both live and fixed Schizosaccheromyces pombe cells. FEMS Microbiol. Lett.
132:215-219.
14. Klis F., Mol P., Hellingwerf K., and Brul S. 2002. Dynamics of cell wall structure in Saccharomyces cerevisiae. FEMS Microbiology Reviews. 26:239-256.
15. de Kok J., Roelofs R., Giesendorf B., Pennings J., Waas E., Feuth T., Swinkels D., and Span P. 2005. Normalization of gene expression measurements in tumor tissues:comparison of 13 endogenous control genes. Laboratory Investigation. 85:154- 159.
16. Lloyd, D. and Murray, D. 2005. Ultradian metronome: timekeeper for orchestration of cellular coherence. T.I.B.S. 30:333-337.
17. Yeger-Lotem, E., Sattah, S., Kashtan, N., Itzkovitz, S., Milo, R, Pinter, R., Alon, U., and Margalit, H. 2004. Network motifs in integrated Cellular networks of transcription- regulated and protein-protein interaction. Proc. Natl. Acad. Sci. 101:5934-5939.
18. Murray, D., Klevecz, R., and Lloyd, D. 2003. Generation and maintenance of synchrony in Saccharomyces cerevisiae continuous culture. Exp. Cell Res. 287:10-15.
19. Murthy, D., Xie, M., and Jiang, R. 2004. Weibull Models. ISBN 0-471-36092-9, John Wiley & Sons.