In addition, a special thanks goes to the staff in the production line, who ensured good cooperation throughout the project period. The results obtained are based on a survey conducted at Camfil Malaysia Sdn Bhd.
Introduction
Background
In a semi-automated production line, the optimal distribution of tasks between human and machine is important to control the efficiency of combined systems of dynamic human-machine interactions (Oh et al., 2015). Additionally, some aspects of the production line that are too difficult to fully automate will implement a semi-automated production support system (Kaber. & Endsley, 2004).
Problem Statement
By using the capacity utilization, the company is able to determine the efficiency of the resources, which is good to eliminate the waste. Moreover, inventory management is one of the essential issues for the manufacturing industry during the pandemic.
Aim & Objectives
Project Scope
Outline of Thesis
Introduction
Redesign Facility Layout
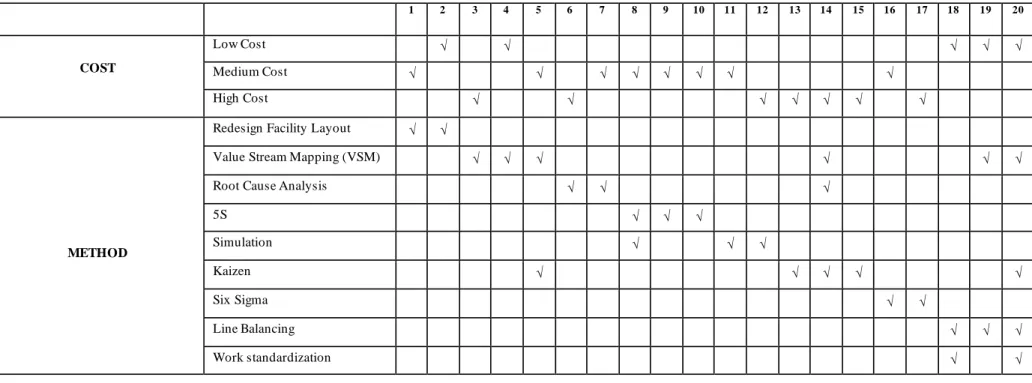
In the research, process flow diagram, data collection and relationship diagram are the significant components used to generate possible alternative layouts. The alternative layouts will then be evaluated by the Graph-Based Method and Efficiency Rate for the purpose of choosing the optimal layout.
Value Stream Mapping (VSM)
According to the result of the selected layout, the total processing time per batch able to reduce by about 10% and 11% improvement in manufacturing productivity. They also predicted that the lead time reduction target would be able to be met if they successfully convert the future VSM to the current VSM.
Root cause analysis
The problems encountered in manufacturing are small depth of cut, high finishing cuts, low feed rate and rpm. They develop 5's practice as how items should be arranged for sorting led to a dramatic improvement in throughput.
Simulation
Kaizen
Lean -Kaizen is a manufacturing strategy that combines both Lean and Kaizen approaches to reduce the non-value adding activities and eliminate inefficiencies in the organizations. In the study, VSM was constructed to visualize the workflow, 5 why the method was implemented for root cause identification while Kaizen was used for continuous improvement. Two different types of Kaizen were used in the production line: the poka-yoke technique and the brainstorming technique.
In the study, unnecessary movements and transports, a high stock of AVI and a poor working environment are the main concerns of the company. With the successful implementation of Lean RACE, the company was able to increase throughput and reduce waste.
Six Sigma
Line Balancing & Work Standardization
Nallusamy and Saravanan (2016b) proposed lean manufacturing in a small-scale industry and emphasized on line balancing and work standardization with the aim of shortening the cycle time, lead time and setup time, and improving the overall output. In the research, line balancing was introduced to arrange the manpower efficiently, while work standardization works as a sequential method to identify the best work practices and encourage workers to strictly follow the standard operating procedure. With the help of various lean manufacturing tools like VSM, kaizen and 5s, improvement on cycle time reduction created significant impact on overall output and customer satisfaction.
It is clear that the total turnaround time can be reduced by approximately 32% with a total reduction of 1850 seconds in set-up and cycle time through line balancing and work standardization.
Comparison of Methods
Discussion of Methods
More emphasis will be placed on the Set in Order and Sort technique compared to other three main practices such as Shine, Sustain and Standardize. Similarly, the successful implementation of Six Sigma in the study of Kabir et al was unable to disregard the contribution of the auxiliary tools such as Root Cause Analysis, 5s and Line Balancing as well. In this situation, Kaizen would be better to use in the semi-automatic production line in this case study.
In the research of Kamble and Telsang (2019), the Maynard Sequence of Operations Technique (MOST) and Discrete Event Simulation were applied. In addition, the research study of Mulugeta (2021) and Nallusamy and Saravanan (2016) emphasize the creation of line balancing and work standardization in the manufacturing company.
Introduction
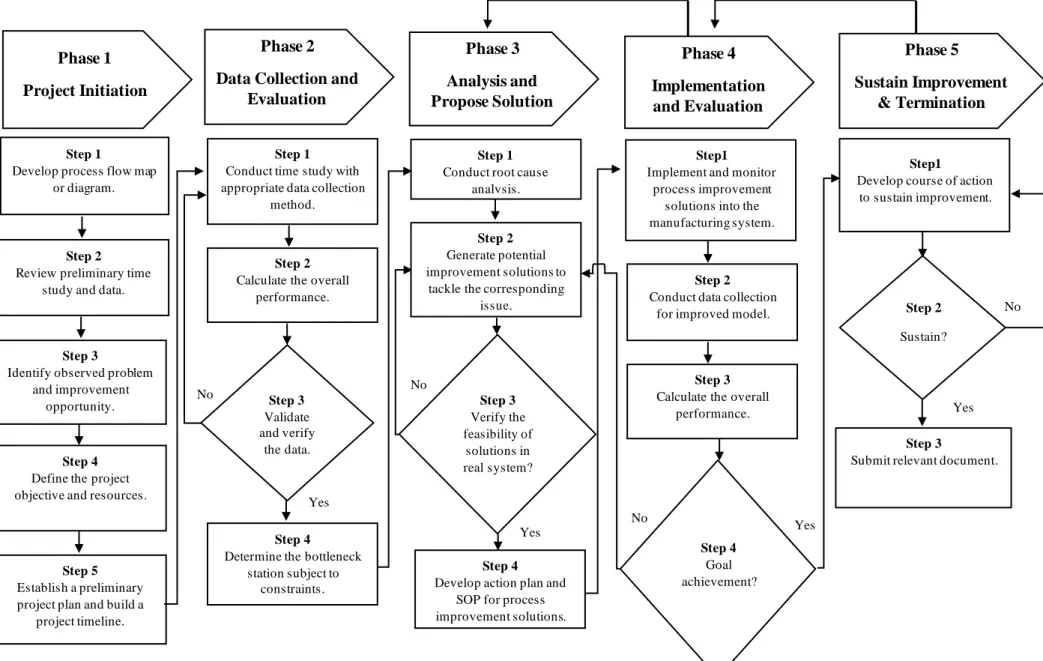
Project Framework
Explanation of Framework
- Phase 1: Project Initiation
- Phase 2: Data Collection and Evaluation
- Phase 3: Analysis and Propose Solution
- Phase 4: Implementation and Evaluation
- Phase 5: Sustain Improvement & Termination
Therefore, the collected data will be used to calculate and measure the overall process performance for the current system. In addition, root cause analysis will be the subsequent process of investigation in bottlenecks in order to determine the factors that contribute to non-value-added activities. If the solution created is achievable, an action plan and a standard operating procedure will be required to provide comprehensive guidance in order to monitor the process.
Similar data collection steps and methods will be implemented to ensure that sufficient and appropriate data is collected. Furthermore, the overall result for the improvement model is summarized and compared with the current model.
Introduction
Information of Research Company
In 2020, the production line of the company could produce 202 units of product in a year. Exponential increase in customer demands in the following year which led to increased production and they successfully produced 1426 units of products. The company predicted that the demand will increase by 30% compared to the actual demand in the year 2021.
According to the company, the factory operates on a three-shift system and each shift lasts 8 hours.
Validates the Proposed Framework
Phase 1: Project Initiation
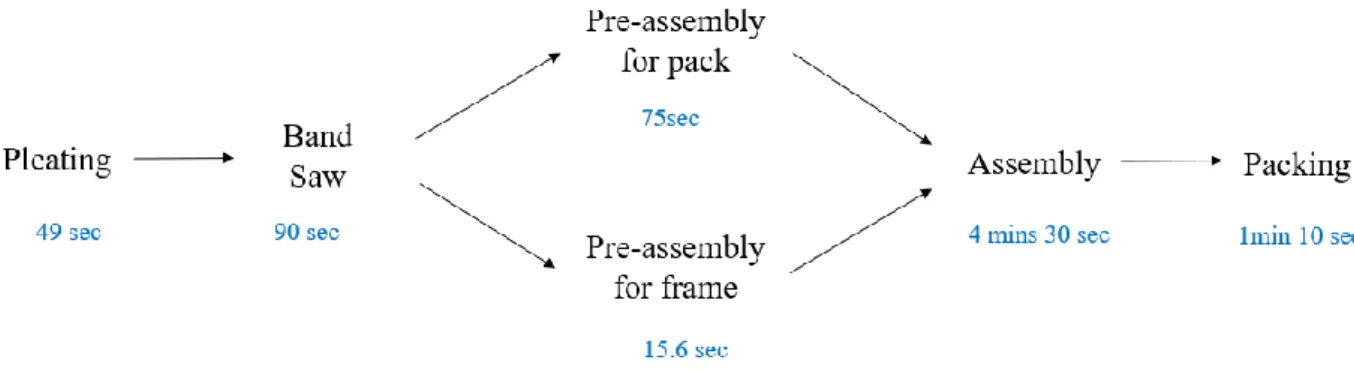
In the study, the exploration of the production process was carried out with a process flow map shown in figure 4.1. The first manufacturing step involves an automated machine to fold the filter media. Pre-assembly of the media pack and frame will be done after the filter media is ready.
Both the pre-assembly processes are performed manually with cycle time of 75 seconds and 15.6 seconds respectively. To correct the problem, they expect solutions that can reduce the impact due to the weaknesses of the production line such as limited movement in the work area.
Phase 2: Data Collection and Evaluation
Low manufacturing operations and production output affected the study resulting in low sample size of data could be collected. To remedy the situation, a learning curve has been applied to reveal the relationship between the predicted production output and the time and it will be beneficial to help the calculation process of production throughput afterwards. After consulting the engineer, it was suggested that the forecast production output be established based on the average production volume before the COVID-19 pandemic, which is 20 units per day.
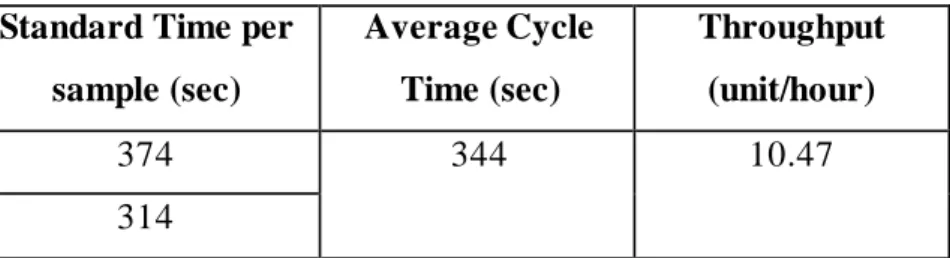
Standard time and production throughput were measured afterwards and shown in table 4.7. In addition, the percentage differences in throughput were calculated using the formula: Based on Table 4.7, the result of the percentage difference in actual production output and expected production output showed a minor discrepancy in production throughput which is 7.45%.
Phase 3: Analysis and Propose Solution
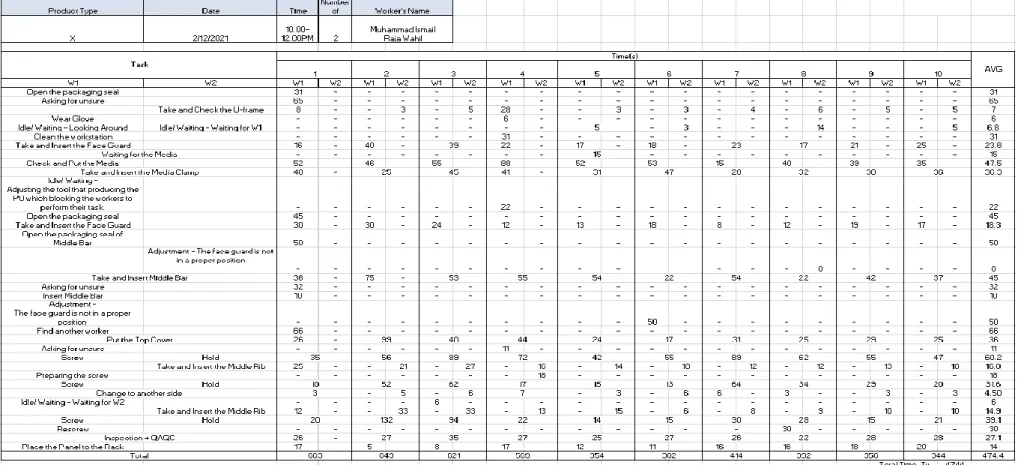
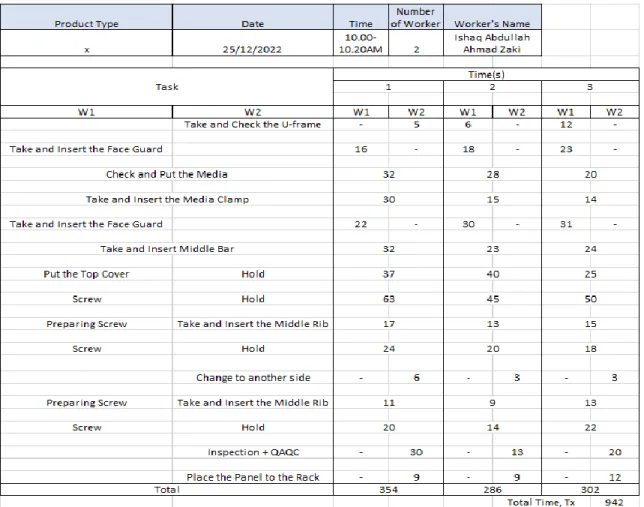
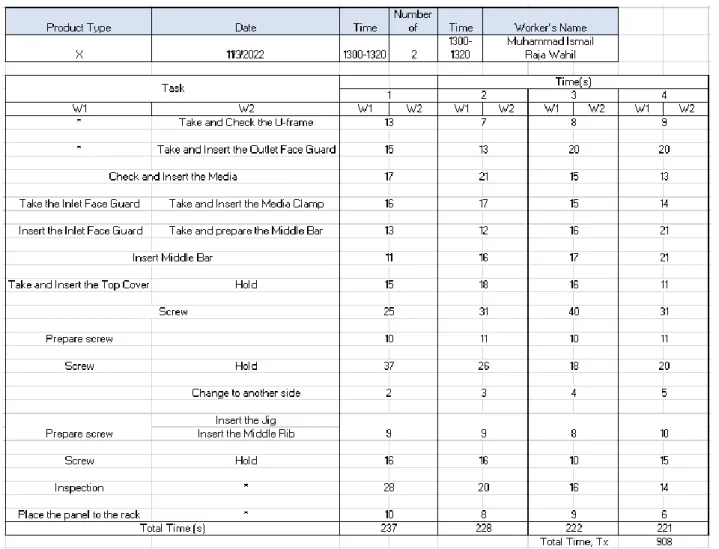
Moreover, it is discovered that different levels of human skill appeal as a limiting factor in the project. Highly skilled operators (Dataset 2) took a shorter time to complete a part, while junior operators (Dataset 1) spent a longer period of time assembling one unit in the manual bottleneck station. It is noted that there was a confused task procedure and different work steps were involved in the production where tasks handled by each operator in each production cycle were inconsistent as shown in Table 4.1 and Table 4.2.
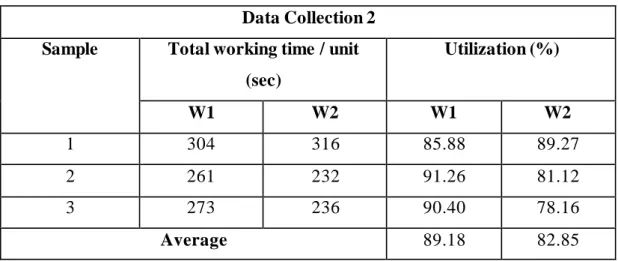
The erratic utilization results of W2 from Table 4.4 embodied an inconsistent performance of an operator in the manufacturing line. Furthermore, poor work flow was manifested in the production line as material unavailability was encountered in the bottleneck station.
Phase 4: Implementation and Evaluation
To ensure that the trail race could run smoothly, all the operators responsible for this particular production were involved to encourage information sharing and open discussion to accelerate the adoption of the new system. In the next section, the performance results of the current system and improvement system were compared as shown in Table 4.13. The percentage improvement was calculated using the formula as manifested below and the result was recorded in Table 4.13.
A high percentage of improvements achieved in the production line was able to achieve the organization's goal of improving the flow by 30% more than the current flow. In addition, several targets entered into the production plan were met, achieving the overall project objectives.
Phase 5: Sustain Improvement & Termination
Findings and Discussion
In addition, improvement solutions can be interpreted using graphs to display more statistical and powerful data and results that encourage production teams to adapt the new modified system in the production line. This is because the existing way of solving problems in the company is still in its infancy. In the research, the proposed solutions followed the concept of Kaizen and gained many advantages.
In the study, the redesign of the facility layout meets the necessary needs of people by creating an ergonomic workspace for the employees to perform their roles most efficiently. Employees need to practice being more interactive, adapting and increasing their knowledge base or sophistication.
Introduction
Summary of research
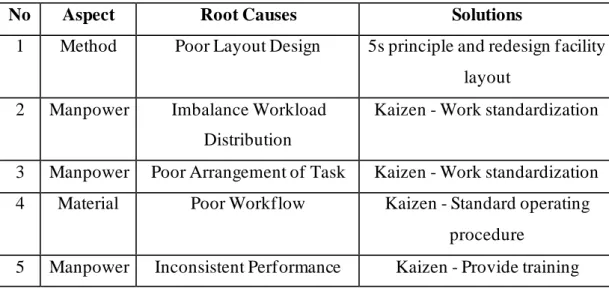
The project gained insight from the data obtained in the preliminary and detailed time studies and it was discovered that the manufacturing problems originated at the manual assembly workstation where the process has the longest cycle time and the lowest production output. Meanwhile, a comprehensive framework has been compiled to clarify the direction on how the implementation should be carried out in a chronological order. In this research, it was found that poor arrangement of tasks, inconsistent work performance, imbalanced workload distribution, poor work flow and poor layout design were the main issues encountered in the production line.
Based on the result, there is approximately a 38.69% decrease in production cycle time at the bottleneck workstation. In addition, the implementation of the solutions was performed in production to validate the selected solutions.
Recommendation for future research
Successful implementation of the modified system and the excellent improvement results proved that the solution is feasible for the real system, and it is claimed that the final goal of the project was achieved. In this case, a new frame could be constructed to tackle the next bottleneck that develops in production. Furthermore, the production manager should keep track of the workers' behavior and performance regularly to ensure the effectiveness of training sessions as well as enable the workers to be better engaged in their roles with the best possible efficiency.
Applying Root Cause Analysis to Increase Material Removal Rates for Productivity Improvement: A Case Study of the Press Manufacturing Industry. Cycle time reduction for coil setup process through standard work: Case study in ceramics industry.