In your opinion, in your country, what will be the impact of the Covid-19 pandemic. Asian countries have made the most progress towards the SDGs since the adoption of the goals in 2015. This year's edition of the SDG Index and Dashboards cannot integrate the impact of Covid-19 on the SDGs due to time lags in official statistics and reporting.
Political leadership and policy environment
Most countries have also identified a coordinating unit or agency responsible for coordinating the implementation of the SDGs. Only 16% of respondents believed their country was on track to achieve all or most of the SDGs. A second obstacle is the lack of awareness of the SDGs among policy makers and the general public.
In your view, is your country on track to achieve the SDGs by 2030?
Overall, respondents believed that before the outbreak of the Covid-19 pandemic, the world was not on track to achieve the SDGs. Of the six SDG transformations, respondents perceived that their governments had made the greatest effort to implement Transformation 6 (Digital Revolution for Sustainable Development). Finally, respondents identified three major challenges that hinder further implementation of the SDG transformations and progress towards the SDGs.
Since 2015, how do you perceive government efforts and actions to implement the six transformations in your country?
In your view, what are the main barriers to achieving the SDGs in your country?
In April 2020, the SDSN surveyed the SDG community on the impact of the Covid-19 pandemic on achieving the SDGs. Overall, 53% of respondents believed that the impact of Covid-19 would not be negative across the board for achieving the SDGs by 2030, and that positive transformations could occur for some SDGs. What do you think will be the impact of the Covid-19 pandemic in your country on achieving the SDGs by 2030.
In your view, in your country, what will be the impact of the Covid-19 pandemic on the achievement of the SDGs by 2030?
Almost 10% of respondents mentioned that it is too early to say what the long-term impact of Covid-19 would be on the SDGs. Finally, respondents believed that political leadership will be crucial to maintaining the SDGs as shared global priorities as countries recover from the Covid-19 outbreak. In your opinion, in your country, what will be the impact of Covid-19 on each of the six SDG transformations.
In your view, in your country, what will be the impact of Covid-19 on each of the six SDG Transformations?
In your view, is the current SDG framework and reporting process suited to help prevent and mitigate major global risks (e.g., pandemics)?
- Data, statistics and monitoring
- International SDG monitoring reports focus on all 17 SDGs and provide comparative assessments of
- National SDG indicator and monitoring reports are based on a national set of indicators identified
- Goal-specific monitoring initiatives focus on monitoring progress towards individual SDG out-
- Policy trackers are needed to create forward-looking assessments of countries’ trajectories towards the SDGs
- Subnational and city-level SDG assessments track the efforts and performance of cities, provinces,
- Corporate benchmarks and sustainability metrics
- Capacity-building and partnerships to develop alternative data sources. PARIS21 has been named
The 2030 Agenda states that “the goals and targets will be monitored and reviewed using a set of global indicators”, while a dedicated section provides key principles for tracking progress and contextualises the SDG assessment processes and instruments at all levels. To assess the current state of data and monitoring, we assessed the data availability and timeliness of the indicators included in this SDR2020. Second, it is still difficult to assess whether the adoption of the SDGs has had a positive impact on the availability and timeliness of official statistics.
Non-official data sources help address data gaps and time lags in official statistics
On the one hand, we note that more data is now available to measure sustainable development than there was in 2015. On the other hand, many data points that are available now have a reference year before the adoption of the SDGs. The slight increase in data availability for OECD countries is mainly due to new data on freshwater withdrawals (FAO) and mortality from air pollution (WHO).
First, it may be too early to evaluate the impact of statistical projects and programs launched since the adoption of the SDGs in 2015. It takes many years to collect and standardize official statistics in collaboration with national statistical offices, especially when there are no agreed definitions or methods. We could not find out on which date the data was collected from international data portals.
Therefore, these findings can only reinforce the point made earlier about significant time lags in the reporting of official data. Using official and unofficial data sources, we find that data coverage and timeliness tend to be better for socioeconomic goals such as SDG 3 (good health and well-being) and SDG 5 (gender equality). Data availability and timeliness for tracking SDG 10 (reduced inequalities) are more problematic, with many countries reporting outdated or no information for the GINI coefficient.
On a global level, data availability and timeliness is also low for environmental and biodiversity goals, including SDG 12 (Responsible consumption and production) and SDG 14 (Life Below Water).
Overall, there are more official data available in 2020 than between 2010–2015 to measure
Yet, it might be too soon to see an “SDG effect”
The need for real-time contact tracing highlights ethical and other concerns about new data sources and the role private providers play in data generation and use (Orrell, 2020; Marks, 2020; Espey, 2020). The SDSN TReNDS network and Data4Now support partnerships between governments and other stakeholders (including the private sector) to increase data availability and timelines for the SDGs (GPSDD et al., 2019), while the Data Collaboration Contract (C4DC) project supports governments in the development and execution of economic data University-GOV, GOV. Forum and TRENDS, 2020).
Data availability and timeliness vary extensively across the SDGs
Interpreting the Index and Dashboards results
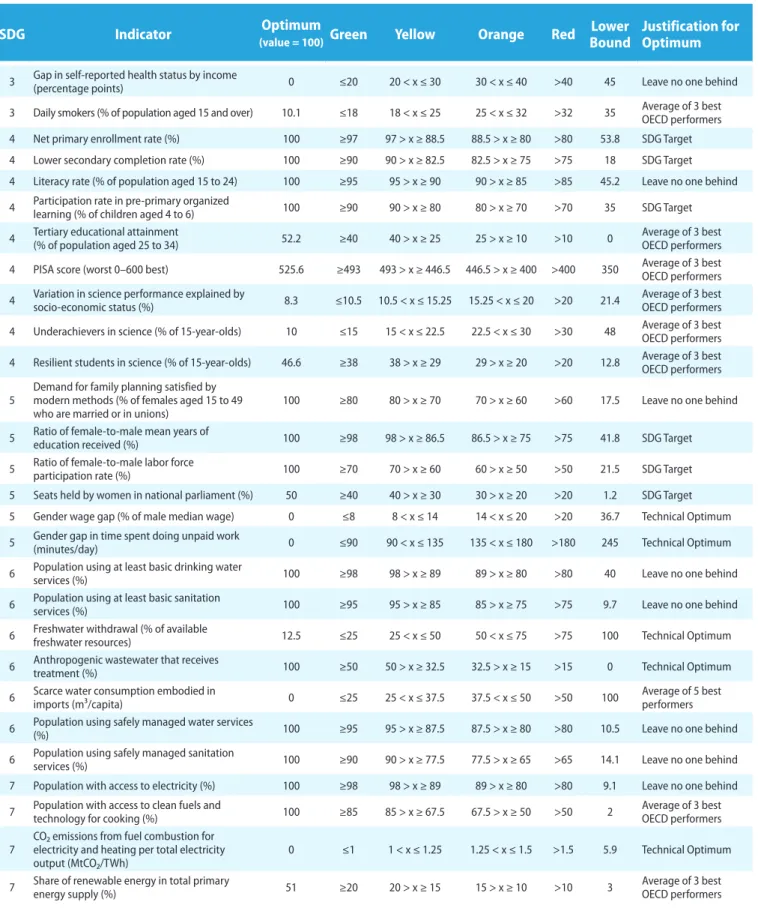
The Sustainable Development Report 2020 details each country's progress towards achieving the SDGs and identifies areas that require faster progress. A country's overall SDG index score and its score on individual SDGs can be interpreted as a percentage of optimal performance. The difference between the score and 100 is therefore the distance, in percentage points, that must be overcome to achieve optimal performance.
Substantial differences in rankings may be due to small differences in the overall SDG index score. Differences of two or three places between countries should not be interpreted as "significant", while differences of 10 places or more may indicate a significant difference (JRC, 2019). The SDG trend dashboards show whether a country is on track to achieve a specific goal by 2030, based on its recent performance on given indicators.
Indicator trends are aggregated at the target level to provide a trend indication of how the country is progressing towards that SDG. The European Commission's Joint Research Center (JRC) conducted an independent statistical audit of the report's methodology and results in 2019.
Changes made to the 2020 edition, and main limitations
The same basket of indicators is used for all countries to create comparable scores and rankings. As in previous years, the dashboards and country profiles for OECD countries include additional metrics not available for non-OECD countries. 12 Production-based SO₂ emissions (kg/capita) Change: To increase timeliness and country coverage, the data source has been changed to Lenzen, M.
12 SO₂ emissions embodied in imports (kg/capita) Adjustment: To increase timeliness and country coverage, the data source has been changed to Lenzen, M. 13 CO₂ emissions embodied in fossil fuel exports (kg/capita) Adjustment: To avoid penalizing trading and transit countries, fuel exports are now limited to the country's production level. 16 Unconvicted prisoners (% of prison population) Change: Data is now calculated as 3-year averages due to volatility 17 Government expenditure on health and education (% of GDP) Change: Changed data source for OECD countries to be consistent.
SDG Issue Desired metrics
- Methodology (summary)
- Data selection
- Global relevance and applicability to a broad range of country settings: The indicators are
- Statistical adequacy: The indicators selected represent valid and reliable measures
- Timeliness: The indicators selected are up to date and published on a reasonably prompt schedule
- Data quality: The data series used represent the best available measure for a specific issue and derive from
- Coverage: Data must be available for at least 80% of the United Nations Member States with a national
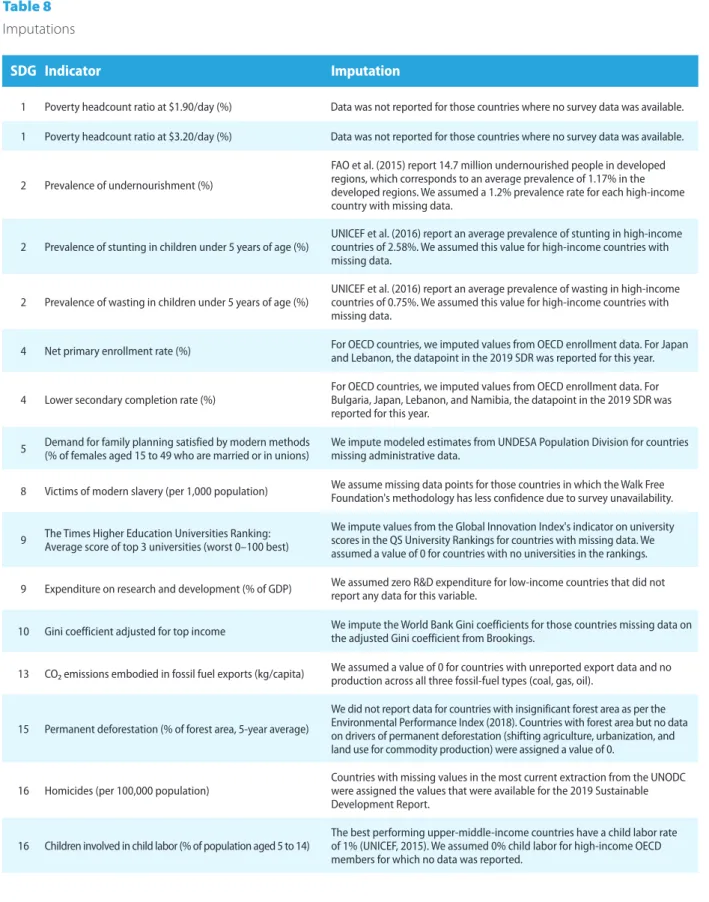
- Missing data and imputations
- Life Below Water). Imputed goal scores are used solely for the computation of the index, and they are
- Method for constructing the SDG Index
- Method for constructing the dashboards
- SDG trends
To minimize bias from missing data, the SDG index only includes countries that have data for at least 80% of the variables included in the global SDG index. To reduce missing data biases in the calculation of the SDG index, we impute the regional average target scores to those target scores that are missing or missing data for more than 75% of the indicators under this target. For global indicators, the upper limit was set by taking the average value of the top 5 global performers.
The red band is bound at the bottom by the value of the 2.5th percentile of the distribution. For the design of the dashboards, the same issues related to weighting and aggregation of indicators apply as discussed above for the SDG index. We then averaged the two rescaled variables on which the country performed worst to identify its rating for that objective.
Indicator trends that are "stagnant" were assigned a value of 1–2, where 2 corresponds to 50% of the growth rate needed to reach the target by 2030. Overall target trends were calculated as the arithmetic mean of the rescaled values for all trend indicators under each target. Score is increasing at a rate above 50% of the required growth rate, but below the rate needed to achieve the SDG by 2030.
These indicators show how the situation in the country has changed since the adoption of the SDGs.
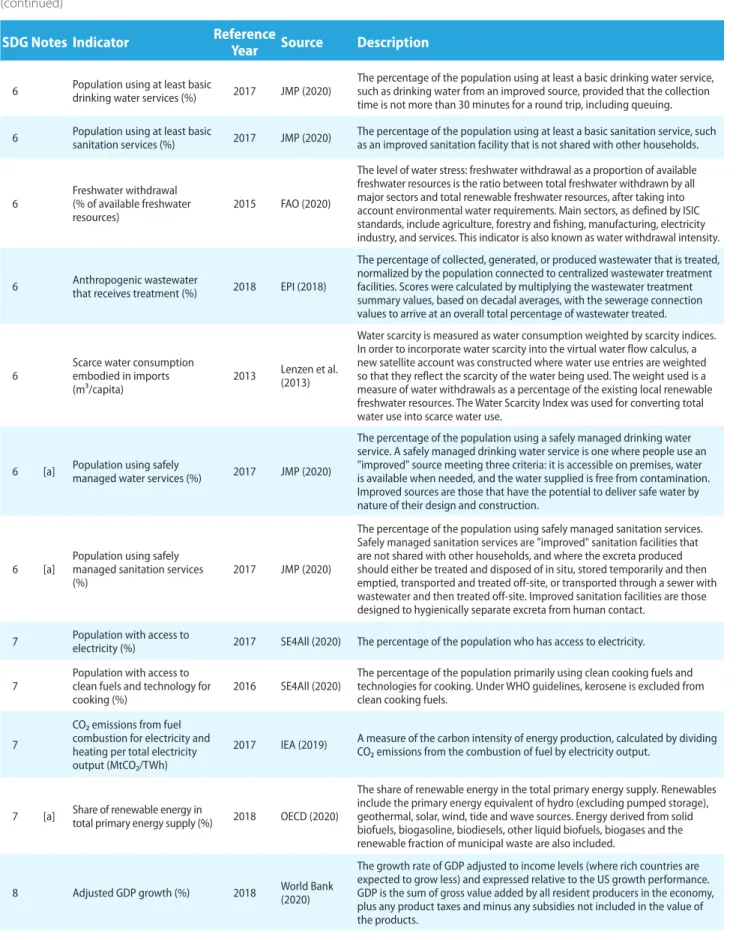
SDG Notes Indicator Reference
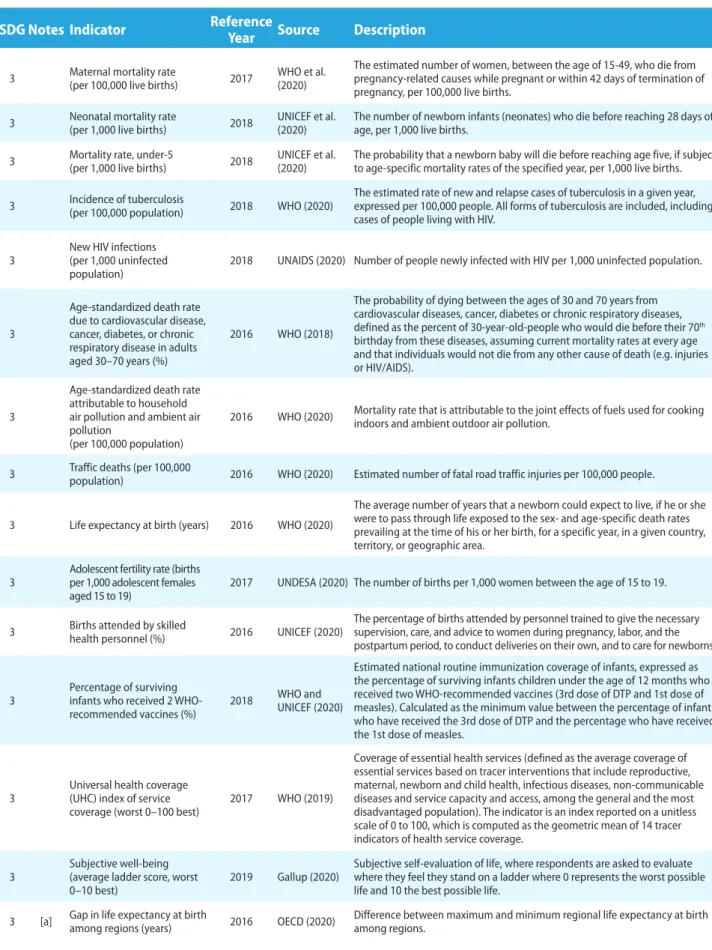
2018 OECD (2020) Difference in the percentage of people who consider their health to be good or very good between the poorest 20% and the richest 20% of the population. 4 Net primary school enrollment rate (%) 2018 UNESCO (2020) Percentage of children of the officially school-age population who are enrolled in primary school education. Percentage of population using at least a basic drinking water service, such as drinking water from an improved source, provided collection time is no longer than 30 minutes for a round trip, including queuing.
Applied weight is a measure of water abstraction as a percentage of existing local renewable freshwater resources. 2018 ITU (2020) Percentage of population that used the Internet from any location in the last three months. Mobile broadband subscriptions refer to subscriptions to mobile cellular networks with access to data communications (eg the Internet) at broadband speeds, regardless of the device used to access the Internet.
The average score of the top three universities in each country that are included in the global top 1,000 universities in the world. The percentage of the urban population with access to improved drinking water through on-site piping. The percentage of the population surveyed who answered "satisfied" to the question "Are you satisfied or dissatisfied with public transport in the city or area where you live?".
The percentage of children between the ages of 5 and 14 who were involved in child labor at the time of the survey.
Country Missing Values Percentage of Missing Values
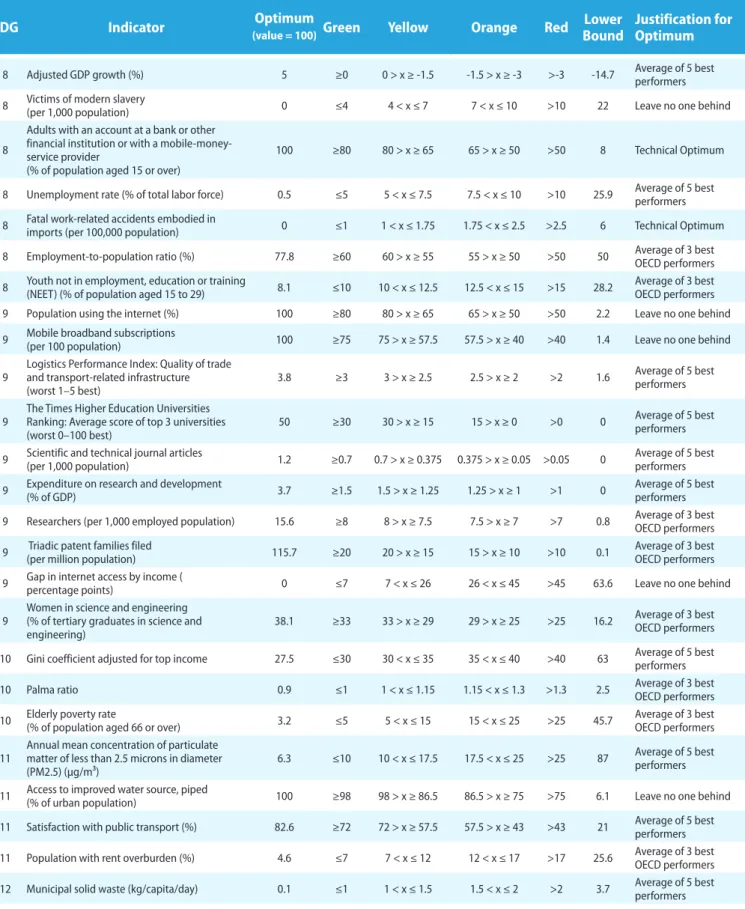
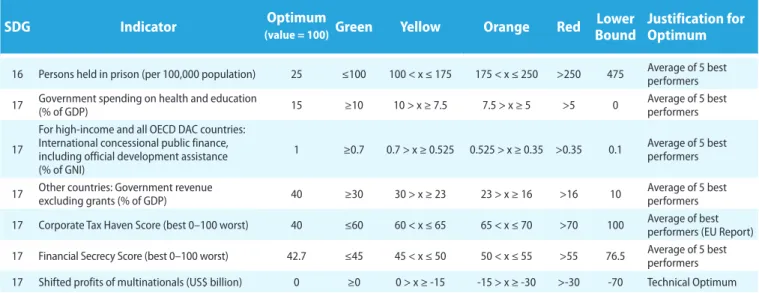
Bound
Justification for Optimum
SDG Indicator Optimum
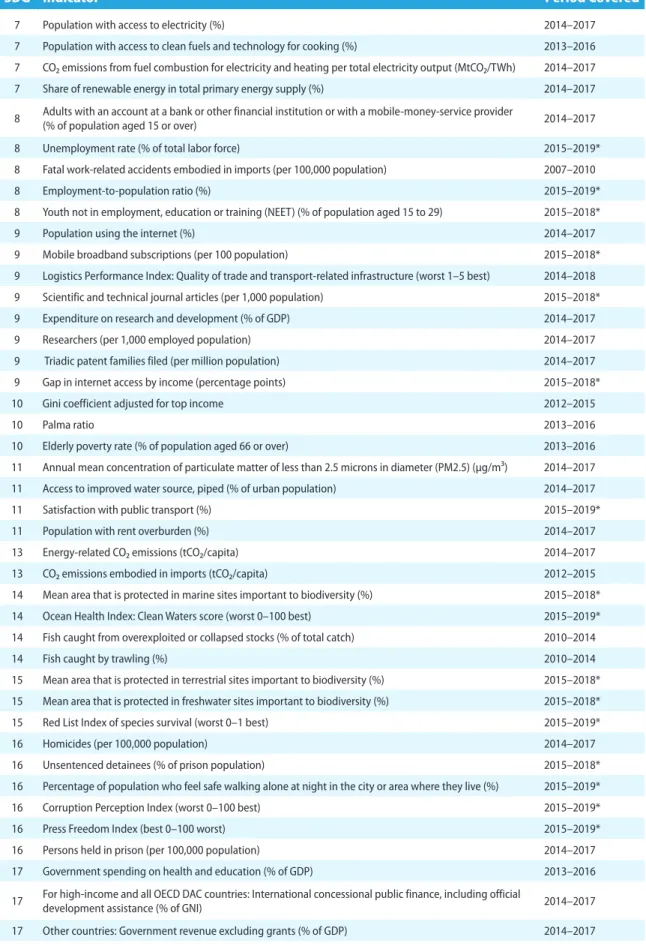
SDG Indicator Period Covered
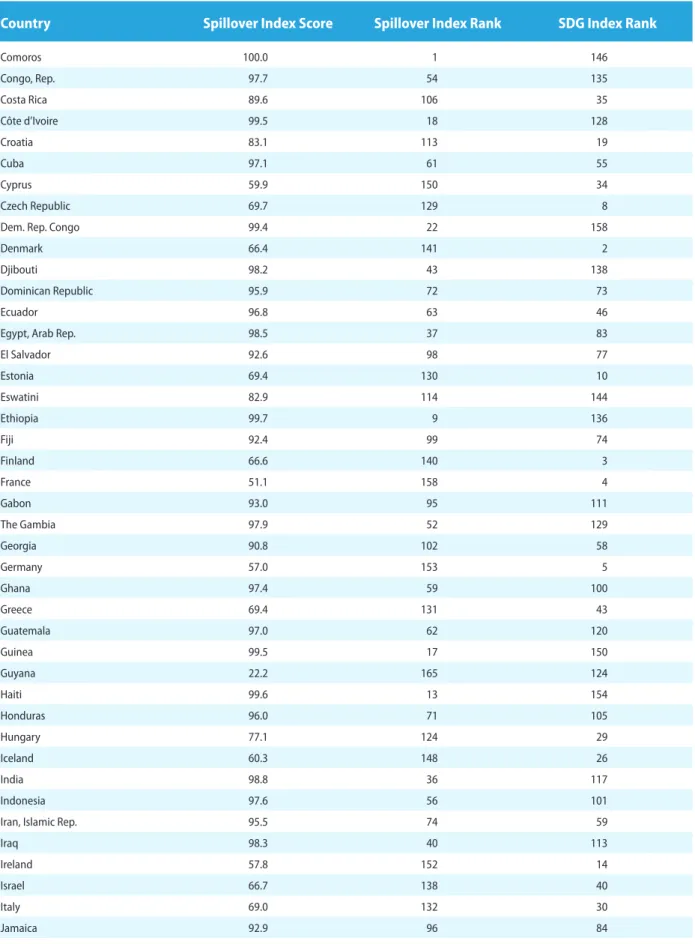
Country Spillover Index Score Spillover Index Rank SDG Index Rank
Sustainable development in the European Union — Monitoring report on progress towards the SDGs in an EU context, 2017 edition. Sustainable development in the European Union — Monitoring report on progress towards the SDGs in an EU context, 2018 edition. Sustainable development in the European Union — Monitoring report on progress towards the SDGs in an EU context, 2019 edition.
SDG Index and Dashboards: detailed methodological paper.” Bertelsmann Stiftung and Sustainable Development Solutions Network, Paris. National Baselines for the Sustainable Development Goals Assessed in the SDG Index and Dashboards." Nature Geoscience. Sustainable Development Solutions Network and Barilla Center for Food and Nutrition, New York and Milan.