Online Learning as a Remedy for Course Failure: An Assessment
of Credit Recovery as an Intervention to Earn Credits and Graduate from High School
By
Samantha Lillian Viano
Dissertation
Submitted to the Faculty of the Graduate School of Vanderbilt University
in partial fulfillment of the requirements for the degree of
DOCTOR OF PHILOSOPHY in
Leadership and Policy Studies August 10, 2018 Nashville, Tennessee
Approved:
Gary T. Henry, Ph.D.
Carolyn Heinrich, Ph.D.
Joseph Murphy, Ph.D.
Kris Preacher, Ph.D.
Copyright © 2018 by Samantha Lillian Viano All Rights Reserved
iii
To my former students in Chicago, whose struggles and triumphs inspired this dissertation
iv
ACKNOWLEDGEMENTS
This dissertation received financial support from the National Academy of Education and the National Academy of Education/Spencer Dissertation Fellowship Program. I especially want to thank the National Academy of Education members and post-doctoral fellows, who provided me guidance and feedback on my dissertation at the fall and spring retreats.
My main source of guidance, support, and mentorship throughout my Ph.D. program came from Gary Henry, who has consistently advocated for me and my dissertation over the last four years. I am also indebted to the faculty of the Leadership, Policy, and Organizations
department at Peabody College. In particular, I want to thank Joe Murphy and Carolyn Heinrich, who have been incredibly thoughtful and helpful in developing and finalizing my dissertation. I also want to thank Ron Zimmer and Stella Flores, who provided excellent research and
mentorship support throughout my Ph.D. program.
I also want to acknowledge the academic support, great advice, and friendships of the students in the Leadership and Policy Studies Ph.D. program. Working with my cohort, especially during the first two years in the program, very much enhanced my learning and
enjoyment. I thank my family for their support, including my parents, Alice and Michael, and the Viano family. Thank you to my son, Aaron, who has been an inextricable part of this dissertation process. Also, I would not be in this Ph.D. program without the encouragement of my husband, Jeff, whose support has been instrumental in my journey to a Ph.D.
v
TABLE OF CONTENTS
Page
DEDICATION iii
ACKNOWLEDGEMENTS iv
LIST OF TABLES viii
LIST OF FIGURES x
INTRODUCTION 1
Chapter
I. Credit Recovery and Repeating a Course for Credit: Which Students Enroll in Each Option, and What Are the Consequences of Each Assignment? 4
Introduction 4
Literature Review on Credit Recovery 8
Background on Credit Recovery in North Carolina Public Schools 12
Methods 14
Data and Sample 14
Measures 16
Empirical Framework 18
Results 20
Conclusion 27
Appendix 29
References 41
II. Are Credit Recovery Courses An Effective Intervention
To Address Course Failure? 44
Introduction 44
Literature Review 46
The Effect of Credit Accumulation or Course Failure
on High School Graduation 47
Solutions Available to High Schools to Address Course Failure 49
Methods 52
Data and Sample 52
Measures 53
vi
Covariates 54
Empirical Framework 55
Limitations 62
Results 63
Robustness Checks 65
Conclusion 68
Appendix 71
References 81
III. The Effects of Credit Recovery: An Examination of Graduation
Rates and Negative Effects 85
Introduction 85
Policy Tools and Programs Available to High Schools
to Increase Graduation Rates 89
Potential Unintended Consequences of Dropout Prevention Programs 93 Credit Recovery as an Intervention to Increase Graduation Rates 94
Data and Sample 95
Measures 97
Credit Recovery Schools 97
Dependent Variables 99
Empirical Framework 100
Validity Checks 114
Model Specifications 115
Dosage of Credit Recovery 117
Limitations 118
Results 120
Validity Checks 103
Model Specifications 104
Dosage of Credit Recovery 106
Limitations 107
Results 108
Validity Checks 111
Dosage Analysis 113
Conclusion 116
Appendix 120
References 139
Appendix
A. Comparison of Weighted and Unweighted Linear Probability Models 144 B. Using Percent Absences in Eighth Grade Quintile for Coarsened Exact Matching
Instead of Eighth Grade Test Score 147
vii
C. Students Who Only Failed One Course 152
D. Students Who Failed the End-of-Course Exam in Math I 156 E. Students Who Failed the End-of-Course Exam in English II 160
F. Students Who Failed the End-of-Course Exam in Biology 164 G. Students Who Failed One or More EOC Courses, Combined 168
viii
LIST OF TABLES
Table Page
1. Estimates of Credit Recovery (CR) Course Enrollment
or CR Course Availability 29
2. Percentage of Students Who Failed Courses by Course
Credit Remediation Option 30
3. Results from a Multilevel Logit Model Predicting Taking
a Credit Recovery Course as Compared to Repeating a Course for Credit 31 4. Multilevel Logistic Regression Model Predicting Earning Credit
for a Course 34
5. Ordinary Least Squares Model Predicting the Percentage
of Students Repeating a Failed Course 35
6. Balance Check After Matching Process 71
7. Sample Sizes By Treatment Status 72
8. Comparison of the Treatment and Comparison Group Samples 73 9. Results from Logistic Regression With School-by-Cohort Fixed Effects
Using a Matched Sample 74
10. Results from Logistic Regression with School-by-Cohort Fixed Effects
Using a Matched Sample by Race and Socioeconomic Status 76 11. Fixed Effects Models Investigating the Association Between
Credit Recovery Courses and Outcomes 77
12. Credit Recovery Schools by Year 120
13. Dependent Variable is High School Graduation Rate, Standardized 121 14. Dependent Variable is Passing Rate of
Previously Failed Courses, Standardized 122
15. Dependent Variable is Dropout Rate, Standardized 123
ix
16. Dependent Variable is Chronic Absenteeism Rate, Standardized 124
17. Dependent Variable is EOC Proficiency Rate, Standardized 125
18. Dependent Variable is Course Failure Rate, Standardized 126
19. Granger Test 127
20. Balance 128 21. Results from Dosage Models Predicting the Outcomes Based on Percentage
of Enrollment in Credit Recovery Using School Fixed Effects 129
x
LIST OF FIGURES
Figure Page
1. Change in Percentage of Students in Credit Recovery
Within School Over Time 36
2. Ratio of Credit Recovery Courses to Repeating Courses for Credit 37 3. Ratio of Credit Recovery to Repeating Courses Over Time 38 4. Number of Credit Recovery and Repeating Course
Enrollments Over Time 39
5. Ratio of Credit Recovery Courses to Repeating Courses Over Time 40 6. High School Graduation Rates by Student Race
(“National Center for Education Statistics,” n.d.) 78
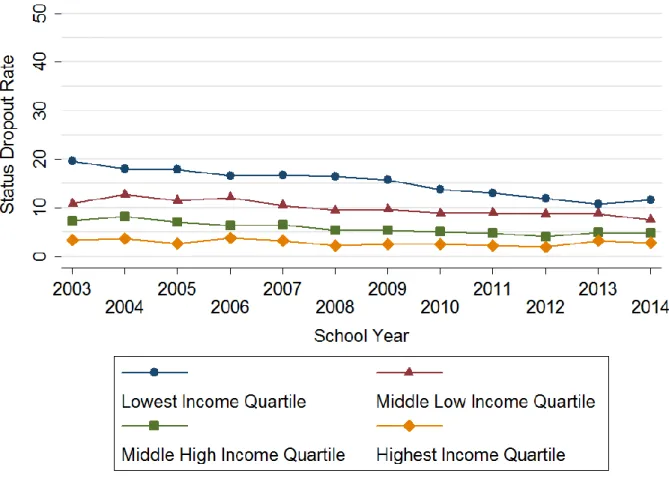
7. Status Dropout Rates by Income
(“Digest of Education Statistics, 2015,” n.d.) 79
8. Number of Credit Recovery Courses
Taken by Students in the Sample 80
9. Trends in Credit Recovery Enrollment Over Time 130
10. Pretreatment Trends 131
11. Predicted Standardized High School Graduation Rate Based
on Credit Recovery Enrollment 132
12. Predicted Standardized Dropout Rate Based
on Credit Recovery Enrollment 133
13. Predicted Standardized Chronic Absenteeism Rate Based
on Credit Recovery Enrollment 134
14. Predicted Standardized EOC Proficiency Rate Based
on Credit Recovery Enrollment 135
15. Predicted Standardized Core Course Failure Rate Based
on Credit Recovery Enrollment 136
xi
16. Predicted Standardized Passing Rate of Previously Failed Courses
Based on Credit Recovery Enrollment 137
17. Kernel Density Distribution of Schools Based on Enrollment
in Credit Recovery and Treatment Status from the CITS Analysis 138
1
INTRODUCTION
While prior literature has focused on potential reasons why students do or do not graduate from high school, very few studies evaluate interventions that specifically target a common predictor of not graduating from high school: the failure of required courses. This study works to strengthen this literature by addressing an increasingly popular tool schools are using to help students regain credit they lost through course failure: credit recovery courses. Credit recovery refers to online courses that students take after failing a class the first time they enroll in the course. While online learning was originally designed for students interested in accelerated or enrichment activities, credit recovery courses are specifically designed for at-risk high school students whose motivations and skill levels are likely different from the intended online learner.
Furthermore, the increasing popularity of credit recovery is clear, but the actual enrollment in credit recovery and the effectiveness thereof are unknown. Prior to credit recovery, students who failed a course simply repeated it in full, either in summer school, after school, or during the school year. While the efficacy of these traditional interventions is unclear, the comparison of the effectiveness of traditional approaches versus credit recovery in helping students regain course credit and graduate from high school has only rarely been assessed.
This dissertation aims to address these gaps in the literature on credit recovery through three separate essays, each taking a different approach to credit recovery. In order to gain a baseline understanding of credit recovery enrollment and efficacy, the first essay compares enrollment in credit recovery to enrollment in repeating a course traditionally for students who fail courses. This first essay answers baseline questions about enrollment numbers, changes over time, the type of student who enrolls in credit recovery, and the type of school that is more likely
2
to enroll students in credit recovery. This essay also investigates the efficacy of credit recovery as an intervention to regain course credit lost through course failure.
While the first essay relies on descriptive analysis, the second essay makes claims about the causal effect of credit recovery by using quasi-experimental methods. The second essay investigates whether students who enroll in credit recovery are more likely to graduate and less likely to drop out of high school compared to other students who fail courses but repeat the course in full. While it is important as a baseline measure that students earn course credits from credit recovery courses, if such students are not more likely to graduate from high school, then credit recovery cannot be deemed an effective intervention for its intended distal outcome. Using fixed effects and a matching approach, this essay integrates a host of robustness checks to
attempt to find the causal effect of credit recovery on the likelihood of high school graduation.
The first two essays are mostly focused on the student-level correlates and effects of credit recovery, especially comparing credit recovery students to students repeating courses traditionally. However, credit recovery courses can have associated externalities that go beyond the individual student effects. Implementing credit recovery courses could have an effect on the climate of a school, since it changes the traditional paradigms of how schools are responding to course failure. While repeating a course can naturally feel like a burden to a student, credit recovery—a time during the school day with almost unfettered access to the internet and time away from classrooms and teachers—might seem like a reward to some. This kind of positive reinforcement of negative behavior could have negative effects on all areas of school
performance. Conversely, credit recovery could only positively affect school performance by increasing graduation rates while avoiding the reinforcement of negative behavior. The third essay uses a comparative interrupted time series approach to address these policy-relevant
3
questions by answering questions about the effects of credit recovery implementation on school- level outcomes.
This dissertation represents an important step in understanding the underlying patterns, effectiveness, and intended and unintended consequences of credit recovery. While practitioners in schools are incentivized by unforgiving accountability targets to implement quick and easy interventions like credit recovery, it is important to understand whether this particular
intervention is meeting its intended purpose, and whether it comes with unexpected costs to the school’s performance. Using highly generalizable data from all non-charter public schools in the state of North Carolina, this dissertation provides valuable information that will increase
knowledge about credit recovery to help practitioners make informed decisions.
4 CHAPTER I
CREDIT RECOVERY AND REPEATING A COURSE FOR CREDIT:
WHICH STUDENTS ENROLL IN EACH OPTION AND WHAT ARE THE CONSEQUENCES OF THIS ASSIGNMENT?
Introduction
Recently, high schools have been subject to federal accountability pressures to increase graduation rates (“No Child Left Behind High School Graduation Rate Non-Regulatory
Guidance,” 2008; “Overview Information; Race to the Top Fund; Notice Inviting Applications for New Awards for Fiscal Year 2010; Notice,” 2010). At the same time, high school graduation rates have hit a historic high, setting new annual records (“Common Core of Data (CCD),” n.d.;
“National Center for Education Statistics,” n.d.; “U.S. High School Graduation Rate Hits New Record High | U.S. Department of Education,” n.d.). One possible explanation is credit recovery courses. Credit recovery, a recent addition to the possible remedies for course failure, refers to online courses specifically designed for students who have previously failed a traditional (i.e., face-to-face) version of that course. Since course failure is a strong predictor of failing to
graduate from high school (see Allensworth & Easton, 2005; Bowers, 2010; Mac Iver & Messel, 2013), credit recovery offers students who fail courses the ability to regain those credits in a way that was not available to them before. Traditionally, students have addressed course failure by retaking the course in full, taking the course after school (e.g., in a twilight program), or taking the class in summer school. However, credit recovery is arguably a more efficient way to earn
5
course credit for failed classes because of the flexible online format and the ability to complete multiple courses within the same timeframe as retaking one full course.
Several recent studies strongly suggest that credit recovery has become a staple offering in high schools around the U.S, apparently dominating online course offerings. A nationwide survey in the 2009-10 school year indicated that approximately 55 percent of school districts enrolled students in distance education courses, with 62 percent—over 1.1 million enrollments—
for credit recovery (Queen & Lewis, 2011). When North Carolina Virtual Public Schools (NCVPS), now the second largest statewide virtual school in the U.S. (Murin, Powell, Roberts,
& Patrick, 2015), began offering online courses in summer 2007, 78 percent of enrollments were for students in credit recovery courses (Oliver, Osborne, Patel, & Kleiman, 2009). In a 2012-13 survey of public high schools in Iowa and Wisconsin, credit recovery was their top reason for offering online courses (Clements, Stafford, Pazzaglia, & Jacobs, 2015). From a 2012-13 survey of public high schools in the Albany, New York, area, about 60 percent of schools offered online courses, and about three quarters of students enrolled in online courses were enrolled in a credit recovery course; 82 percent of schools reported that online courses for credit recovery was a very important reason for having online courses (Clements, Zweig, & Pazzaglia, 2015). As shown in Table 1, overall estimates of enrollment or offerings of credit recovery are highly disparate, depending on the study. Reports on schools in Iowa, Wisconsin, North Carolina, and nationwide indicate credit recovery as an option at three quarters of schools. A study of schools in the Albany, New York, area (the Capital Region) indicates credit recovery as an option at about half of schools. Longitudinal evidence from the Florida Virtual School indicates that credit recovery enrollment is growing quickly over time, from 259 enrollments in 2007-08, to 4,063 enrollments in 2010-11.
6
Evidence on distance learning in higher education suggests that online learning might not be an effective tool for student learning, especially for high-risk students who may need extra support and structure (Xu & Jaggars, 2011). Only two available studies have assessed the effectiveness of credit recovery. The first, using a randomized control trial design, found that students in Algebra I summer credit recovery courses in Chicago were less likely to receive course credit and received lower posttest scores than students assigned to a traditional face-to- face summer school course (Heppen et al., 2016). The second study included students who failed core courses, comparing those who enrolled in the state-run North Carolina Virtual Public School’s credit recovery courses to students who made up the credit by repeating the full course during the school year, or taking it in summer school. Using ordinary least squares and logistic regression, this study found that credit recovery students had lower scores and were less likely to pass an end-of-course exam. Credit recovery students were less likely to graduate from high school, but were more likely to graduate from high school on time (i.e., in four years) (Stallings et al., 2016).
Despite limited evidence available on the proliferation and effects of credit recovery, many major media outlets like Education Week and NPR have published pieces excoriating schools and districts for giving students the option to take what the journalists assume to be low- quality credit recovery courses that are used as an easy way to graduate more students (Burke, Chapman, & Monahan, 2013; Gardner, 2016; Turner, 2015). These media sources accuse schools and districts of funneling at-risk students into credit recovery courses that are low- quality, and wherein students gain little from the course besides the credit itself. However, we actually know little about these courses, the students who take them, and the schools that offer them.
7
This study focuses on the prevalence, distribution, and variation in credit recovery course-taking at both the student and school level. The findings represent an important first step in investigating whether credit recovery is being widely used enough to warrant future study through experimental and quasi-experimental designs. Course failure is not a new problem, but credit recovery offers a new solution. Knowing the popularity of credit recovery compared to other options for addressing course failure is an important step toward understanding how schools are using credit recovery courses. To address these areas, I will assess the following research questions:
1. When students fail a core course required for high school graduation, how often do they repeat the course for credit, take the course through credit recovery, do neither, or do both?
2. To what extent do the ways in which a student addresses course failure vary across schools and change over time?
As noted above, journalists and researchers have raised many concerns about credit recovery, and I will address several areas where potential issues with credit recovery might arise.
With no information pointing to the efficacy of credit recovery, there is a natural concern that the most vulnerable student populations are disproportionately exposed to credit recovery courses. It is unknown whether credit recovery is being used with mostly marginalized student populations or in under-resourced school settings. Schools that traditionally struggle to graduate students might be more likely to implement a program like credit recovery, which offers a low-cost way for more students to earn credits in less time (see below for more information on costs and time associated with credit recovery). In order to assess whether or not course-taking is associated with certain student or school characteristics, I will address the following research question:
8
3. To what extent does a student’s enrollment in credit recovery or repeating a course for credit relate to the students’ characteristics or the characteristics of the school they attend?
Another natural concern about credit recovery is whether or not students are actually gaining course credit if they take a credit recovery course, and how those course credit earning rates compare to the traditional method of repeating a course for credit:
4. To what extent is repeating a course for credit, credit recovery, neither, or both associated with ultimately gaining credit for the course?
If credit recovery has become an especially popular option at schools, it is possible that repeating a course for credit could become increasingly obsolete. Credit recovery crowding out other options available to students who fail courses could have major ramifications for student learning if credit recovery courses are systematically of lower quality than traditional courses. In order to assess whether or not this is occurring, I will address the following research question:
5. To what degree are credit recovery rates increasing at the school-level over time at a rate that is high enough to lead to a crowding out of other options for addressing course failure?
Literature Review on Credit Recovery
As noted above, in many schools, credit recovery has become a common remedy for course failure in an effort to reduce the risk of dropping out and failing to graduate.
Traditionally, students who failed courses had two options: repeat the course in a subsequent semester, or take a version of the course specifically designed for students who had failed, which is taught in a traditional classroom setting, but offered after school or over the summer. Online
9
learning through credit recovery provides an alternative for gaining credits from previously failed courses and offers several appealing attributes, which can include flexibility, relatively easy expansion, a lack of interference with students’ carrying a normal course load, and lower costs for delivery. Schools have the option of offering credit recovery at any time in any location, thus making it simple for students to recover course credit on their own schedules, though
schools can choose to offer credit recovery during the school day. The other methods of gaining course credit require a certified teacher as the instructor, leading to potentially higher costs and less flexibility than a self-paced online course. Unfortunately, research has not devoted much attention to the popularity of credit recovery, but a few studies have been conducted on the costs, implementation, and experiences of those involved with it.
Expansion of the number of students enrolled in credit recovery comes at some cost to the school district; however, this cost is considered to be less than the cost of hiring more teachers to teach additional students (Murin et al., 2015). Some public providers of online credit recovery courses (i.e., state or district-run courses) do not charge schools to enroll students in courses, so costs are potentially limited to the necessary technology (i.e., computers and internet access). However, many online courses are partially taught by an online instructor, include an in- room monitor to supervise the credit recovery students, and/or have a monitor who is a certified teacher, all of which add substantial costs. Credit recovery course flexibility can also range from the traditional constraints of being offered within the school day as a part of the student’s course schedule (and most likely with an in-class monitor or teachers), to the extreme fluidity of being available for students to complete at their own pace anytime, anywhere they wish to work on the course (Ingerham, 2012; Levy, 2011; Murin et al., 2015; Oliver & Kellogg, 2015). We know little about the extent to which these two credit recovery formats are utilized. A 2012-13 survey
10
of a stratified random sample of schools in Iowa and Wisconsin indicated that most schools enrolled students in synchronous online courses, for both credit recovery and non-credit
recovery, where the students had the opportunity to communicate directly with an online teacher, and schools assigned an onsite monitor to supervise students in online courses (Clements,
Stafford, et al., 2015).
Credit recovery can be offered through statewide virtual schools, district virtual schools, or private providers. As of 2008, 40 states had state-run online course providers, which are designed to offer online courses to students enrolled in traditional brick-and-mortar schools, thus supplementing the more traditional face-to-face offerings (Watson, Gemin, & Ryan, 2008). The largest state-run virtual course provider is in Florida, and enrolled over 377,000 students in 2013- 14, followed by NCVPS, which enrolled about 105,000 students in online courses the same year.
While these enrollment numbers include credit recovery and other online learners, all courses offered through Florida Virtual School have a version that can be taken for credit recovery.
Many large school districts also have their own, in-house providers of online courses, which function in the same capacity as the state-run virtual schools (Watson, Gemin, & Ryan, 2008).
Another significant provider of credit recovery courses are for-profit companies that contract to schools and districts to provide specific courses to the schools (Murin et al., 2015). For instance, Apex Learning is a privately-held company founded and staffed by former executives at Apple and Microsoft, and claims on their website boast that their online course enrollments in 2014-15, including credit recovery, reached over two million (“Apex Learning—About Us,” n.d.). More detailed information on the widespread use of private providers of credit recovery courses is difficult to find. As described in a recent report on credit recovery in North Carolina public schools, these private providers do not readily share information, such as the schools and districts
11
with whom they have contracts, and overall enrollment numbers. After interviewing representatives from seven private credit recovery providers in North Carolina, the report’s author had little detailed information, but confirmed with the vendors that at least 87 percent of districts in North Carolina had a contract with one of the seven interviewed providers (Stallings et al., 2016).
Additionally, little is known about the content, pedagogical approaches, and assessments in credit recovery courses. In an article on NCVPS deployment in summer 2007, the authors indicate that all courses were aligned to the Southern Region Education Board’s e-learning standards, which were later adopted by the North American Council for Online Learning as the National Standards for Quality Online Teaching (Oliver et al., 2009). This study also includes information from a survey of all online instructors and students who enrolled in an online course through NCVPS that summer, separating both groups into those involved in an accelerated course and those involved in a credit recovery course. Teachers of credit recovery courses rated the quality of resource materials as significantly lower than those submitted by teachers of accelerated courses. The majority of credit recovery students did not have a clear idea of how their work was evaluated, and often did not receive timely feedback on assignments (Oliver et al., 2009). In an attempt to understand the content of credit recovery courses, a follow-up survey of teachers of credit recovery courses was conducted in a more recent summer (actual year of the survey was not noted in the paper), with teachers indicating that credit recovery courses are mastery-based, included new teaching strategies, and utilized interactive web tools. The online instructors rarely encouraged collaborative assignments, provided little prompting for peer-to- peer learning, and offered little use of hands-on or authentic projects (Oliver & Kellogg, 2015).
In an ethnographic study of NCVPS Algebra I credit recovery students, Ingerham (2012) found
12
that the majority of students spent a significant amount of time on other, unrelated websites (mostly YouTube) during the class period they were assigned to work on their credit recovery curriculum. In contrast to this study, Levy’s (2011) ethnographic study of migrant students in Texas indicated that those students were given access to a personal laptop for a year, which they could use to complete multiple credit recovery courses. Students could work on their credit recovery courses offered through NovaNET (Pearson) any time after 5 p.m. on weekdays, and throughout the weekend. The average student in that program earned three-and-a-half course credits through credit recovery courses.
Background on Credit Recovery in North Carolina Public Schools
Since 2007, the NCVPS has provided sufficient online courses to make it the second largest state-run virtual provider of online courses, as noted above. The North Carolina General Assembly created NCVPS in 2002, originally to assist with homebound student instruction, to reduce class sizes, and to offer advanced courses to rural students whose home schools had limited course offerings (Banks, Bodkin, & Heissel, 2011). As of the 2016-17 school year, NCVPS offered 14 credit recovery courses. Students from all 115 North Carolina school districts and most charter high schools take NCVPS courses, and schools are charged between $235 and
$438 per course enrollment, depending on the time of year the course is offered (i.e., summer, year-long, or semester-length). All courses have an online instructor (“North Carolina Virtual Public School,” n.d.). Many districts and schools in North Carolina also contract to private credit recovery providers, including Apex, Edmemtum, PLATO, and Odysseyware.
Nevertheless, it is unclear and likely highly varied how students are enrolled in credit recovery. In order to gain a clearer picture of the credit recovery assignment or enrollment
13
process, I conducted interviews with district and school-based officials in several school districts in North Carolina. Based on these interviews, credit recovery assignment varies depending on district/school policies. One policy that came up more than once is one that only allows a student to take a credit recovery course if their grade in the course they failed was between a 50 and 59 percent (60 percent and above is passing). Another district reported allowing only students who failed a course due to excessive absences to take credit recovery. In both of these districts, however, students can appeal their assignment to repeating a course for credit such that credit recovery is not strictly limited to students who meet the district requirements. Thus, the districts have official appeals processes that allow students some autonomy in their course assignment. In at least one school site, students can decide whether or not to take a credit recovery course, although teachers can also be part of this decision-making process (and both parties can change their mind mid-semester). The ways credit recovery courses are supervised also varies by
district. One district reported having a certified teacher in every credit recovery classroom, while other districts have an attending employee who is similar to a teacher’s aide. In those school districts, the person supervising credit recovery only needs a high school diploma for the position. While I did not speak to a district that has an unsupervised credit recovery model (i.e., students are expected to complete their credit recovery course outside of school hours), I am unaware of any state requirement or regulation that would prohibit or discourage this practice.
The North Carolina State Board of Education has adopted several official policies on credit recovery courses that apply to all courses regardless of whether they are offered through NCVPS or a private provider. Officially, credit recovery indicates instruction that is less than the entirety of The Standard Course of Study (i.e., the official state-wide standards for required academic courses) for that course, instead focusing on problem areas in the student’s learning.
14
Credit recovery courses are offered as pass/fail with no grades that will factor into a student’s GPA. If students wish to earn a new grade for a course, then they must repeat the entire course, a process officially termed repeating a course for credit. The length of credit recovery courses is based on the amount of time it takes a student to master the content, and students are not to be limited in the number of credit recovery courses they are allowed to take. Students take the official state end-of-course exam upon completion of the credit recovery course when applicable (Garland, Brown, & Beamon, 2010).
While these are the official regulations governing credit recovery, the state has not indicated how often students are enrolling in credit recovery courses or any outcomes of credit recovery students, such as the rates at which credit recovery students earn course credits. This study aims to fill this information gap by exploring the prevalence of credit recovery across the state. Additionally, it investigates which students are more likely to take credit recovery based on their characteristics and the characteristics of their schools.
Methods
Data and Sample
The data from this project includes student-level records from an administrative database, including all students enrolled in public schools in North Carolina. This administrative database is maintained by the Education Policy Initiative at the University of North Carolina at Chapel Hill (EPIC), and includes longitudinal information on students, their schools, and their teachers.
Student-course roster files and student grade records are essential data files for this project, as these files identify students who have enrolled in credit recovery or who are repeating a course
15
for credit. These files also identify each course (e.g., Math I, English II) in which a student is enrolled.
The unit of analysis is the student-course. Each record represents one course that a student has failed anytime in high school (i.e., the number of records for each student is equal to the number of unique courses a student has failed). The sample is restricted to high school student-course records for only core, required courses (see “High School Graduation Requirements,” n.d.)1 that a student failed anytime in high school (i.e., 9th-12th grade). The sample includes only student-course records for courses that a student failed between the 2012- 13 and 2016-17 school years. In order to investigate student and school characteristics associated with credit recovery enrollment or repeating a course for credit, I compiled several data files with information on demographics, academic performance, and attendance at both the student and school level.
This study focuses on core, required courses for two reasons. First, if credit recovery courses were specifically implemented in order to raise graduation rates (as was explained in the introduction), then, theoretically, the impact of offering credit recovery would be concentrated among the courses that address graduation requirements. The second reason is practical. Students enroll in thousands of courses annually, and the credit recovery identification process (explicated below) involves identifying either all of the courses or a well-defined subset of those courses.
Identifying all courses in which students enroll regardless of their utility in determining whether or not a student graduates from high school would be extremely time-consuming, and possibly subject to greater error due to the number of courses with numbering or title changes. Since
1 Regardless of year or track, students are required to complete four years of English, at least three math courses, Biology along with at least one other science course, and at least two social studies courses. Go to
http://www.ncpublicschools.org/docs/curriculum/home/graduationrequirements.pdf for more information.
16
credit recovery is first and foremost an intervention to obtain credit and stay on track for high school graduation, focusing on the subset of required core courses makes the process manageable and provides important evidence related to the overall goals for credit recovery.
Measures
The key measure to address the research questions of this study is how students responded to course failure: through repeating a course for credit, credit recovery, neither, or both. While students might repeat a course for credit during the school year, over the summer, or after school, this study does not differentiate between these options due to data limitations. The first task is to identify which students failed a core, required course using students’ grades and course roster information. Repeating a course for credit is defined as failing a course and
repeating the course for credit with no indication that, when they repeated the course, they did so online. Identifying whether a student’s course is credit recovery is based on several source variables. A student can both repeat a course for credit and take credit recovery, because they might have attempted one of those options and failed the course a second time. Because no single variable or procedure can identify all credit recovery courses, I follow a multistep process to identify credit recovery courses and students enrolled in those courses. Students in credit recovery previously failed a course, and then retook the course online, as indicated through course codes and course titles. Credit recovery courses are also identified through grades, where a grade of a “pass” or “fail” indicated a credit recovery course because only credit recovery courses are graded on a pass/fail basis, according to state-level rules.
In order to answer the third research question about the ways in which student and school characteristics influence how students address course failure, the dataset includes a rich set of
17
covariates. Student demographic and other student-level information is available on an annual basis and includes student race/ethnicity, gender, whether the student is or was designated as Limited English Proficient (LEP), whether the student is gifted, whether the student is classified as economically disadvantaged, and whether the student is enrolled in special education services.
These covariates will indicate if certain types of students—particularly students at risk of not graduating, who, based on the disparity in graduation rates, tend to be low-income and from a racial minority—are more or less likely to be in credit recovery. These same covariates are available at the school-level for the percentage of students in the school in each category.
Financial information is available at the school-level, indicating different financial resources available to the school. Financial information will allow for the comparison between a school’s financial resources and credit recovery course taking. In high school, students take end-of-course exams in Math I, Biology, and English II. The lagged proficiency rates on these exams at the school level will be included to examine whether school performance in the previous school year is associated with how students address course failure. The lagged high school graduation rate will also be in the models to assess whether schools respond to the graduation rate through placing more or less students in credit recovery. The last lagged variable will be the course failure rate. The course failure rate indicates the percentage of first-time, core course enrollments that result in a failure. Schools might respond to higher course failure rates by increasing their credit recovery enrollment the following school year, which will be tested by including this variable. Other school-level variables that will be included are enrollment, teacher experience levels, the percentage of teachers with National Board Certification, suspension rates, and the number of violent acts per 100 students. Covariates are also included, indicating the student’s middle school academic performance, including average scores on the end-of-grade tests given
18
in eighth grade, to see whether different indicators of being at-risk from middle school are associated with how a student addresses course failure in high school.
The outcome for the fourth research question is whether or not students gain credit for a course that they previously failed. A student has gained credit for such a course if the credit recovery course or the course in which they are observed to be repeating for credit is associated with a numeric or letter grade above failing, or a grade of “pass.”
Variables measuring the prevalence of credit recovery in a school are necessary to answer the second and fifth research questions. This measure indicates the percentage of failed student- course records that fall into one of four categories: did not repeat or take credit recovery, took credit recovery only, repeated the course only, repeated the course and took credit recovery.
Empirical Framework
The first research question for the study asks how often students who fail courses repeat a course for credit, take credit recovery, do both, or do not appear to address their course failure.
The second research question asks how and whether or not students address course failure varies across schools and has changed over time. In order to answer these two questions, descriptive tables, bar charts, and trend lines will show enrollment rates in credit recovery or repeating courses for credit for failed students both overall and over time.
The third research question asks whether the decision between repeating a course for credit or credit recovery is related to student or school characteristics. A multilevel logistic regression model will answer this research question. The model is logistic because the option of
19
repeating a course for credit or taking credit recovery is a binary outcome.2 The model is multilevel because student-course records are clustered within students, and students are
clustered within schools, resulting in three levels.3,4 The covariates listed in the Measures section will be in the model at the student- or school-level. The covariates at the course-level will be indicators of the core course subject (i.e., Math, Science, Social Studies, or English). The
analysis will explore which course-level, student-level, and school-level covariates are predictive of enrolling in credit recovery as opposed to repeating a course for credit. I will explore the resulting coefficients from the model both for their statistical as well as practical significance to see if there is any indication that credit recovery is systematically being used for some students or in some settings over others.
The fourth research question asks if repeating a course for credit, taking credit recovery, neither, or both is associated with gaining credit for a course. To answer this research question, I will estimate a multilevel logistic regression model with enrollment in credit recovery, not addressing course failure, or enrolling in credit recovery and repeating the course for credit as separate variables on the right-hand side of the equation at the course level. The comparison will be with student-courses that were only repeated for credit. The outcome will be gaining credit for the previously failed course. The same variables from the multilevel logistic regression will be
2 The correlates with assignment to credit recovery, repeating a course, or being assigned to neither option are not explored in this study because the multilevel, multinomial logistic regression models, where the four different assignment options are all included as separate levels of the outcome, would not converge.
3 This model could also be run as a multiple membership model, as students can attend more than one school during this time period. However, only two percent of the sample attends more than one high school, a small enough proportion where a multiple membership model is not necessary.
4The ICCs from the baseline model are 0.25 at the school-level, and 0.53 at the student-within-school level, indicating that using a multilevel model is worthwhile.
20
included in this model, but the coefficients of interest are on the variables for credit recovery, neither credit recovery nor repeating the course, or both options.
The fifth research question asks whether there is a possible crowding out effect of credit recovery, where higher levels of credit recovery over time lead to fewer students accessing other options to address course failure. This question will be answered by examining school-level aggregated enrollments in credit recovery and repeating a course for credit. The model will take the following form:
𝑅𝑒𝑝𝑒𝑎𝑡𝑖𝑡 = 𝛽0+ 𝛽1𝐶𝑅𝑖,𝑡−1+ 𝑿𝑖𝑡𝜷𝒌+ 𝑢𝑖𝑡
The variable 𝑅𝑒𝑝𝑒𝑎𝑡𝑖𝑡 represents the percentage of students who failed a course and later
repeated the course for credit at school i at time t. The variable 𝐶𝑅𝑖,𝑡−1 represents the percentage of students who failed a course but repeated it through credit recovery at school i at time t-1 (i.e., the lagged credit recovery enrollment). The vector of school characteristics is represented by 𝑿𝑖𝑡, and this includes the same school characteristic as the previous analyses of this paper. The coefficient of interest is 𝛽1. A negative, significant coefficient would indicate that the prior year credit recovery enrollment led to fewer students repeating a course for credit—a possible crowding out effect. Standard errors are clustered at the school level. All of the results are generated using Stata.
Results
Between the 2012-13 and 2016-17 school years, high school students in North Carolina failed 742,462 core courses. Of that total number, approximately 48 percent of the student-course records indicate that the course was neither repeated nor taken through credit recovery, as
indicated on Table 2. About 16 percent of courses were later addressed through credit recovery,
21
and almost exactly double that percentage of courses (31.5 percent) were repeated for credit.
About five percent of courses were later repeated for credit and taken through credit recovery.
Overall, plurality student-course records are not associated with any form of course credit remediation, and repeating a course for credit is the second most popular option.
The most obvious reason why almost half of failed student-course records are not taken through credit recovery or repeated for credit is that these represent students who are not on track to graduate and/or they dropped out of high school. Although 48 percent of student-course records are in this “neither” course makeup category, these records only represent 27 percent of students who fail courses. Students in this category are failing multiple courses, and are either at risk of dropping out before remediating course credit, or have a low graduation probability.
Another potential explanation for why almost half of student-course failures are not addressed through credit recovery or repeating a course for credit lies in the requirements for graduating from high school in North Carolina. For some courses (for example, all English courses),
students have a specific class they must pass to graduate with no substantive alternatives. For all Math courses as well as select science and social studies courses, students can take different classes to meet the graduation requirements. Approximately 40 percent of the student-course failures that are not addressed are Math courses. These students could elect to take a different Math class that also counts toward high school graduation instead of repeating the course or taking credit recovery (although this might require the student to change their track from college- bound to career-ready).
The next set of analyses address the second research question on how changes over time and across schools affect how students address course failure. To assess within-school changes in credit recovery enrollment, Figure 1 shows the changes over time, within-school, in the
22
percentage of student-course records associated with a failure that was later redeemed through credit recovery. This measure ranges from -100 to 100 percentage point changes, with almost a quarter of schools not changing their percent credit recovery enrollment over time (i.e., the change in percent is zero). Approximately 64 percent of schools increased the percentage of student-course failures that result in credit recovery over time. Three percent of schools increased credit recovery enrollments by more than 50 percentage points.
In order to assess the differences across schools in how students address course failure, I created a measure of credit recovery enrollment that represents the ratio of the number of
student-course records that are associated with credit recovery over the number of student-course records that are associated with repeating a course for credit (calculated at the school-level).
Figure 2 is a bar graph of the resulting ratios that have been sorted based on the size of the ratio.
Each bar represents the ratio for a different school. The ratios range from zero, indicating no students at that school enrolled in credit recovery, to eight, indicating there are eight credit recovery student-course records for every one repeating-a-course student-course record at that school. A dashed line is drawn at the y-value of one because a ratio of one indicates that the school has the same number of student-course enrollments in credit recovery and in repeating a course for credit. As shown on Figure 2, the majority of schools have higher enrollments in repeating a course for credit, since most schools have ratios less than one, although 17 percent of schools (115 schools out of 680) do have more credit recovery enrollments than enrollments for courses repeated for credit.
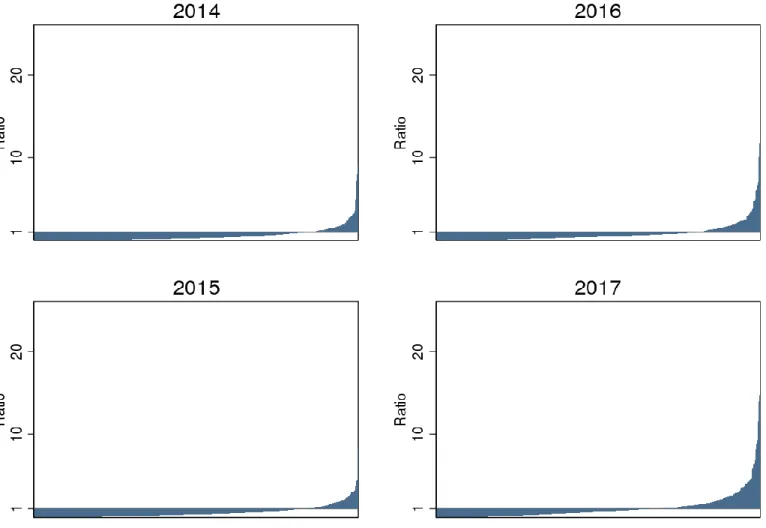
The ratio of credit recovery to repeating courses for credit did change over time, as shown in Figure 3. Figure 3 is equivalent to Figure 2, except that Figure 3 shows these data by year, beginning with the 2013-14 school year and ending with the 2016-17 school year. The bar
23
charts look very similar for 2013-14 (titled “2014”) through 2015-16, since roughly the same proportion of schools have higher enrollments in repeating a course than for credit recovery.
When comparing the 2016 and 2017 graphs, there is a discernable shift in the location, where the ratio of credit recovery to repeating a course records crosses the y-line at one. A higher
proportion of schools in 2017 were enrolling more students in credit recovery than in repeating a course for credit. Consistently, from 2012-13 through 2015-16, 15-18 percent of schools had more failed courses remediated through credit recovery than repeating a course for credit. In 2016-17, a third of schools had more credit recovery courses than courses repeating for credit.
The mean ratio of credit recovery to repeating a course for credit also jumped above one (to 1.1), in 2016-17, from a mean of 0.79 in 2015-16. Indeed, credit recovery became an increasingly popular option across many schools over time.
While these graphs show overall credit recovery enrollment by school and by school over time, investigating patterns more generally over time is part of answering the second research question. Figure 4 shows trend lines for the number of student-course enrollments that are
associated with credit recovery, repeating a course for credit, or neither option (for failed courses only) over time. Enrollments in credit recovery increased between 2012-13 and 2015-16,
followed by a slight decline in 2016-17. Credit recovery enrollments are always lower than repeating a course for credit enrollments, although the distance between the two bars does lessen over time. By 2016-17, the difference between the number of repeated courses and the number of credit recovery courses is approximately 10,000, while, in 2013-14, the difference is
approximately 40,000. As the number of enrollments in credit recovery and repeating a course for credit increase between 2013 and 2015, the number of courses that are not addressed by
24
either option is decreasing, showing an overall trend towards more course failure being addressed by one of the remediation options.
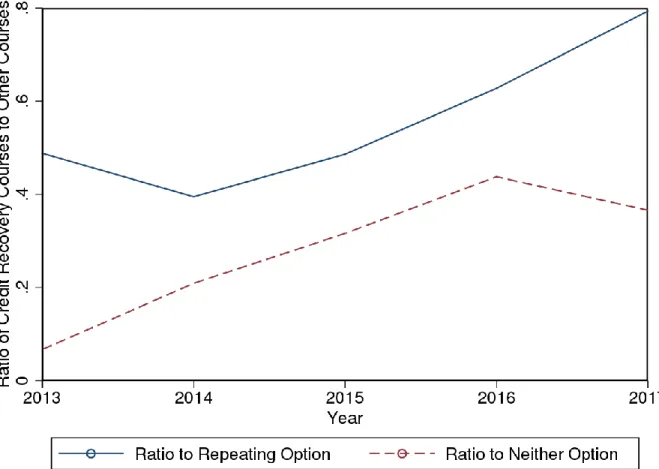
In order to show these data in a different way, Figure 5 shows these same enrollment numbers as the ratio of credit recovery enrollments over repeat enrollments, or not enrolling in either option by year. In 2013, there was approximately one credit recovery enrollment for every two repeat enrollments (ratio of 0.5). By 2017, there was approximately one credit recovery enrollment for every 1.25 repeat enrollments (ratio of 0.8). In 2013, enrollments in neither option vastly outpaced credit recovery enrollments with only one credit recovery enrollment for every ten course failures that were not addressed (ratio of 0.1). The ratio increases over time as more students are taking credit recovery and fewer students are not addressing course failure, and in 2017, for every credit recovery enrollment, there were just over three course failures not addressed (ratio of 0.37).
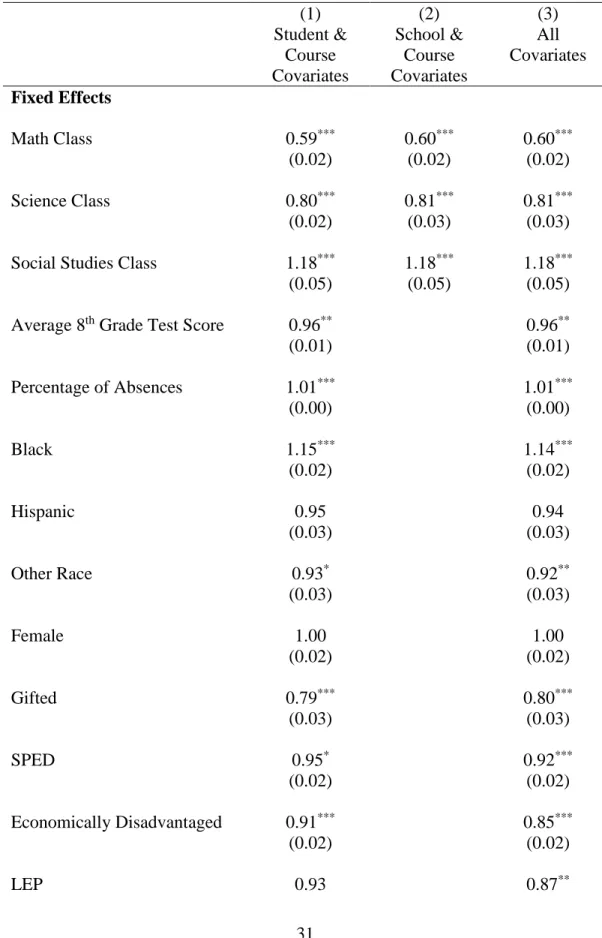
The next set of results answers the third research question: whether student and school characteristics predict the likelihood of enrolling in credit recovery instead of repeating the course for credit. The results from the multilevel logit model predicting credit recovery
enrollment are listed in Table 3. The outcome is a student-course failure that results in taking a credit recovery course with the comparison being student-course failure that results in repeating a course for credit. Student-course failures that do not result in repeating a course or credit recovery are excluded as well as student-course failures that result in students both repeating a course and taking credit recovery. Table 3 includes three specifications. In the first column, only course- and student-level covariates are included; in the second column, only course and school- level covariates are included; finally, the third column includes all covariates.5 Across all
5 Column (3) of Table 3 does not include the percent gifted covariate because the model would not converge with all listed covariates.
25
specifications, the type of course significantly predicts enrollment in credit recovery. Students have higher odds of enrolling in credit recovery if they are in a social studies course, and lower odds of enrolling in credit recovery if they are in a math or science class.
Results for the student characteristics are relatively consistent across model
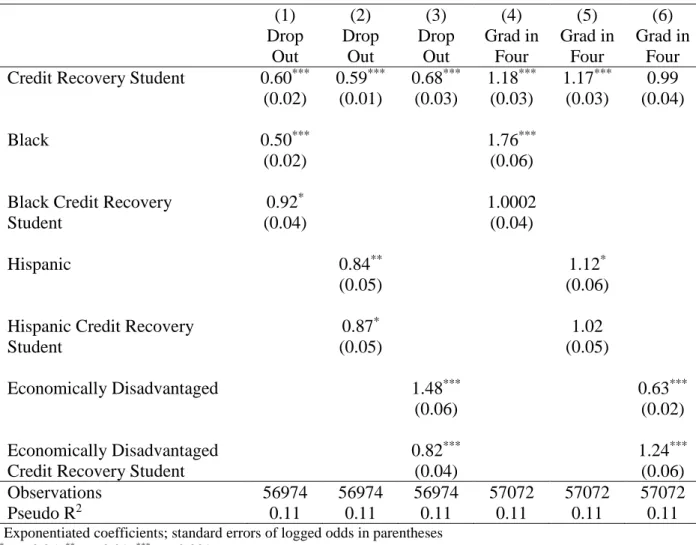
specifications. Higher eighth grade test score averages of students are associated with lower odds of enrolling in credit recovery. Higher percentages of days that a student is absent (measured for the years they are enrolled in the course) are associated with higher odds of enrolling in credit recovery. Black students are more likely to enroll in credit recovery, while students of other races (i.e., non-black, Hispanic, or white) are less likely to enroll in credit recovery. Students who are gifted, SPED, economically disadvantaged, LEP (model (3) only), and over-aged for their grade area all have lower odds of enrolling in credit recovery.
Models including school-level covariates are listed in columns (2) and (3) of Table 3.
Higher percentages of teachers with National Board Certification are associated with lower odds of enrolling in credit recovery. Larger school per-pupil expenditures are associated with
increased odds of credit recovery enrollment. Based on the lagged EOC proficiency rate, schools could be responding to lower test score proficiency by lowering the odds that students are
assigned to credit recovery. The opposite is the case with the lagged high school graduation rate, which indicates that schools would respond to higher graduation rates by raising the probability of assignment to credit recovery. The odds ratio on the lagged course failure rate indicates that schools could be responding to higher initial course failure rates by decreasing the probability a student is assigned to credit recovery in the following year. Increases in the percentage of black students in the school is associated with a lower odds of credit recovery enrollment, while increases in the percentage of Hispanic students are associated with a higher odds of enrollment
26
in credit recovery. I do not find an association between urbanicity or school type and credit recovery enrollment.
To address whether repeating a course for credit or credit recovery is more likely to result in earning credit for a failed course, Table 4 includes the results from a multilevel logit model predicting whether course credit was earned after failing a course. The reference group is courses that a student repeats for credit only. The odds of earning credit through a credit recovery course are almost 2.5 times higher than the odds of earning credit for a student who repeats the course for credit. Students who do not take credit recovery or repeat a course for credit have an extremely low odds of earning course credit, essentially zero (as would be expected). Students who repeat a course for credit and take the course through credit recovery have a slightly lower odds of earning course credit compared to students who only repeat a course for credit, likely because this sample is student-course records, where the student continues to fail the same course multiple times.
The final research question asks if credit recovery is being used as a supplement to or a substitute for students repeating courses for credit. The results of this analysis are listed in Table 5. The coefficient on the percent of failed courses that are retaken through credit recovery in the previous school year (“Percent Credit Recovery, Lagged”) is negative and statistically
significant. This coefficient indicates that, for every percentage point increase in credit recovery enrollment in the previous school year, the percentage of failed courses that are repeated for credit in the current school year is predicted to decrease by 0.37 percentage points. Schools, on average, increased the percentage of students in credit recovery from around six percent in 2012- 13 to 18 percent in 2016-17. This increase of 12 percentage points in credit recovery enrollment
27
is equivalent to an effect of a 4.44 percentage-point decrease in the percentage of students who repeat courses for credit.
Conclusion
This paper confirms speculations on the part of the media that credit recovery courses are becoming an increasingly popular tool that schools are using to increase the likelihood that students earn credit for previously failed courses. Credit recovery enrollment is increasing in North Carolina, and it is being used to replace or crowd out the option of repeating a course for credit as the preferred strategy to regaining credit for a failed course. Schools could be
responding to the success of credit recovery with this particular outcome by increasing credit recovery enrollment. Students are much more likely to regain course credit if they are in credit recovery than if they were repeating a course for credit.
This result could be endogenous, especially if students who are more likely to regain course credit are placed in credit recovery. For instance, in interviews with district officials in North Carolina, officials confirmed that they are more likely to enroll a student in credit recovery if they only barely failed a class, or only failed a class due to absences (i.e., they met all
academic requirements but were not allowed to pass due to excessive absences).
Compared to students repeating a course for credit, credit recovery students are lower performing and have higher absence rates, but are not as likely to be SPED or economically disadvantaged. It appears that credit recovery students might be lower-performing in many ways, but credit recovery is less likely to be used for students with disabilities or economically
disadvantaged students, indicators that are commonly associated with low academic performance. Schools that are enrolling students in credit recovery are more likely to be
28
advantaged and high-performing in several ways, including higher per-pupil expenditures, higher high school graduation rates, and lower course failure rates.
As credit recovery grows in popularity, it will be important to critically examine who is given access to credit recovery courses and why these decisions are being made. Schools appear to be responding to the increased likelihood of credit-earning of credit recovery students by increasing their credit recovery enrollments, but this decision could have unintended
consequences if credit recovery courses are low-quality or detract from the learning environment or rigor of the school. Schools might discover that the productivity of credit recovery could lead to the perverse incentive of high course failure rates if students and teachers are aware that students can easily make up courses through credit recovery. While credit recovery appears to be successful in obtaining course credit for failed courses, future research is warranted to address these other areas of concern.
29 APPENDIX
Table 1: Estimates of Credit Recovery (CR) Course Enrollment or CR Course Availability Sample
Study Year State District School Students CR Enrollment
Clements, Pazzaglia,
& Zweig, 2015
2012-13 SY
New York
State - 99 Schools in New York's
Capital Region - 46% Schools Offer
CR (27 schools) Clements
et al., 2015
2012-13 SY
Iowa and
Wisconsin - 168 Schools in Each State (A
Statewide Random Sample) -
71% of Schools in IA; 66% of Schools
in WI Offer CR*
Hughes, Zhou, &
Petscher, 2015
2007-08 through 2010-11 SYs
Florida All Districts All Schools
About 866,000 Students Per Year (All High Schools
Students)
4,063 Enrollments in CR in 2010-11;
3,236 Enrollments in CR in 2009-10;
2,053 Enrollments in CR in 2008-09;
259 Enrollments in CR in 2007-08 Queen &
Lewis, 2011
2009-10 SY
All 50 States
2,290 Districts (Nationally- Representative Random Sample)
- - 1,126,000
Enrollments* Picciano
et al., 2012
2008-09
SY - - 441 High School Principals
73% of Schools Offer CR (322
Schools) Note: *Weighted estimate(s). SY is an acronym for School Year. IA is Iowa; WI is Wisconsin
30
Table 2: Percentage of Students Who Failed Courses by Course Credit Remediation Option No Credit
Recovery
Credit
Recovery Total
Did Not Repeat 47.58 16.35 63.93
Repeated 31.51 4.56 36.07
Total 79.09 20.91 N=742,462
31
Table 3: Results from a Multilevel Logit Model Predicting Taking a Credit Recovery Course as Compared to Repeating a Course for Credit
(1) (2) (3)
Student &
Course Covariates
School &
Course Covariates
All Covariates Fixed Effects
Math Class 0.59*** 0.60*** 0.60***
(0.02) (0.02) (0.02)
Science Class 0.80*** 0.81*** 0.81***
(0.02) (0.03) (0.03)
Social Studies Class 1.18*** 1.18*** 1.18***
(0.05) (0.05) (0.05)
Average 8th Grade Test Score 0.96** 0.96**
(0.01) (0.01)
Percentage of Absences 1.01*** 1.01***
(0.00) (0.00)
Black 1.15*** 1.14***
(0.02) (0.02)
Hispanic 0.95 0.94
(0.03) (0.03)
Other Race 0.93* 0.92**
(0.03) (0.03)
Female 1.00 1.00
(0.02) (0.02)
Gifted 0.79*** 0.80***
(0.03) (0.03)
SPED 0.95* 0.92***
(0.02) (0.02)
Economically Disadvantaged 0.91*** 0.85***
(0.02) (0.02)
LEP 0.93 0.87**
32
(0.05) (0.04)
Former LEP 1.03 1.00
(0.04) (0.03)
Overage for Grade 0.81*** 0.84***
(0.02) (0.02)
Suburb 0.84 0.90
(0.33) (0.32)
Town 0.79 0.79
(0.32) (0.31)
Rural 0.88 0.9999
(0.28) (0.29)
Percentage of Teachers with 3 0.995 0.995
or Fewer Years of Experience (0.01) (0.01)
Percentage of Teachers with 0.94*** 0.94***
National Board Certification (0.01) (0.01)
Short Term Suspension Rate 0.99 0.99
(0.01) (0.01)
Number of Violent Acts per 0.99996 1.00
100 Students (0.0002) (0.0002)
School Per Pupil Expenditures 1.01*** 1.01***
(in 100s) (0.002) (0.002)
EOC Proficiency Rate, Lagged 0.99*** 0.99***
(0.003) (0.003)
Percent LEP 0.93 0.94
(0.03) (0.03)
Percent Gifted 0.97
(0.02)
Percent SPED 0.99 0.97**
(0.01) (0.01)
Percent Chronic Absenteeism, 0.999 0.999
Lagged (0.01) (0.01)
33
Enrollment (in 100s) 1.02 1.02
(0.04) (0.04)
HS Graduation Rate, Lagged 1.02** 1.02**
(0.01) (0.01)
Course Failure Rate, Lagged 0.96*** 0.96***
(0.01) (0.01)
Percent Economically 0.99 0.99
Disadvantaged (0.005) (0.005)
Percent Black 0.98** 0.98**
(0.01) (0.01)
Percent Hispanic 1.10*** 1.09***
(0.02) (0.02)
Magnet School 1.41 1.42
(0.36) (0.37)
Alternative School 0.62 0.82
(0.53) (0.68)
Constant 0.39 0.45 0.43
(0.03) (0.55) (0.51)
N 285477 285477 285477
Random Effects
Between-School Variance 1.57 2.52 2.32
(intercept) (0.12) (0.45) (0.39)
Between-Student Variance 1.76 1.79 1.78
(intercept) (0.06) (0.06) (0.06)
Residual ICC
School level 0.24 0.33 0.31
(0.01) (0.04) (0.04)
Student-Within-School level 0.50 0.57 0.55
(0.01) (0.03) (0.02)
Exponentiated coefficients; standard errors of logged odds in parentheses. Percentage gifted excluded from model (3) because the model would not converge when including all covariates.
* p < 0.05, ** p < 0.01, *** p < 0.001
34
Table 4: Multilevel Logistic Regression Model Predicting Earning Credit for a Course (1)
Earned Credit Credit Recovery Only 2.46***
(0.18) No Credit Recovery 0.004***
Did Not Repeat (0.0003)
Credit Recovery 0.82***
and Repeat (0.03)
Observations 534835
Exponentiated coefficients; standard errors of logged odds in parentheses; covariates not included for brevity
* p < 0.05, ** p < 0.01, *** p < 0.001
35
Table 5: Ordinary Least Squares Model Predicting the Percentage of Students Repeating a Failed Course
(1)
Percentage Repeated Percent Credit Recovery, Lagged -0.36***
(0.03)
Observations 1957
Standard errors in parentheses; covariates excluded for brevity; standard errors clustered at the school level.
* p < 0.05, ** p < 0.01, *** p < 0.001
36
Figure 1: Change in Percentage of Students in Credit Recovery Within School Over Time