Running head: ORGANIZATIONAL HEALTH AND TEACHER EFFICACY
Organizational Health and Teacher Efficacy: A Qualitative Analysis of Two Measures in Elementary Schools
Nichol A. Eaton Moses
A Dissertation Submitted to the Faculty of ALFRED UNIVERISTY
In Partial Fulfillment of the Requirements for the Degree of DOCTOR OF PSYCHOLOGY
In
SCHOOL PSYCHOLOGY Alfred, New York
01/21/2010
Organizational Health and Teacher Efficacy:
A Qualitative Analysis of
Two Measures in Elementary Schools
by
Nichol A. Eaton Moses
St. Bonaventure University, B.A. (2003) West Chester University of PA, M.A. (2005)
Alfred University, M.A. (2008)
APPROVED BY: Dr. Cris W. Lauback Committee Chairperson
Dr. John D. Cerio Committee Member
Dr. Hannah L. Young Committee Member
Dr. Arthur L. Greil
Committee Member
ACCEPTED BY Dr. Nancy Evangelista Chairperson, Division of School Psychology
ACCEPTED BY Dr. Nancy Evangelista Associate Provost and Director of Graduate Studies
ACCEPTED BY Dr. William Hall Provost & Vice President for Academic Affairs
iii
Acknowledgements
I would like to extend appreciation to my dissertation committee members for supporting and guiding me through a successful project. Dr. Lauback- for providing me with the
encouragement and motivation to press on through the times when completion seemed so very far away, as well as for keeping me focused on the things that matter most in life. Dr. Greil- for encouraging me to evaluate my interests and pursue a project that I truly enjoyed. Dr. Young- for remarkable insight into qualitative research and constant words of encouragement. Dr.
Cerio- for your attention to detail and for providing me with opportunities of challenge and growth throughout this process.
I recognize and am appreciative of the work of Dr. Ellen Faherty of the Lea R. Powell Institute for Children and Families to make dissertation research grants available to doctoral students. The grant provided me with research funding that greatly assisted in the execution of my project in a timely and efficient manner.
I am also grateful of the support, direction, and encouragement provided by my internship supervisor, Dr. John Wolfgang. Dedication to his job and his appreciation for research allowed this project to take place. With his guidance, I have gained a greater understanding of the field and have grown as a professional.
I am indebted to my family for instilling in me a love of learning, a strong work ethic, and a goal-driven approach to life. To my parents- you have taught me to dream big and believe in myself. Without your unconditional support and love, I would not have achieved my dream.
To my husband, Patrick- thank you for the support and encouragement you have shown me throughout this process, the sacrifices you have made, and the hard work you have done to
iv
provide for our family as I have pursued this dream. To our son, Liam- for reminding me of what is important in life and for the sheer joy and happiness that you give me each day. To my gram, Carol- who showed me, at an early age, the enjoyment learning can bring, as well as encouraging me to pursue my dreams.
v
Table of Contents
List of Tables vii
List of Appendices viii
Abstract ix
Chapter 1: Introduction and Literature Review 1
Self-efficacy 1
Teacher Efficacy 3
Teacher Efficacy and Student Outcomes 4
Development of Teacher Efficacy 4
Measurement of Teacher Efficacy 7
Organizational Health 9
Measurement of Organizational Health 11
Dimensions of Organizational Health 11
Organizational Heath and Teacher Efficacy 13
Purpose 13
Chapter 2: Method 14
Research Questions 14
Qualitative Research 14
Participants 17
Variables 19
Instruments 20
Procedure 21
Analyses 21
Chapter 3: Results & Discussion 22
Organizational Health 23
Institutional Integrity 24
Collegial Leadership 28
Resource Influence 30
Teacher Affiliation 34
Academic Emphasis 37
Health Inventory 39
Teacher Efficacy 40
Contributions of the Measures 45
Implications 48
Limitations and Future Research Directions 49
vi
References 52
Tables 1-2 59
Appendices A-E 61
vii List of Tables
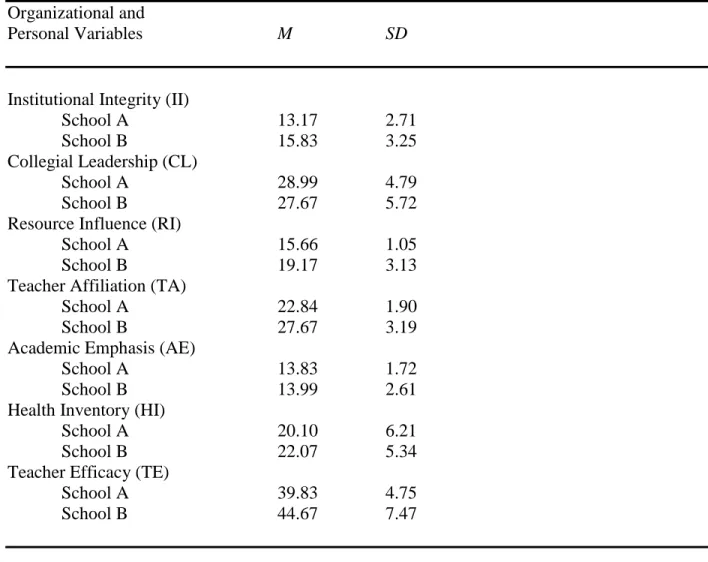
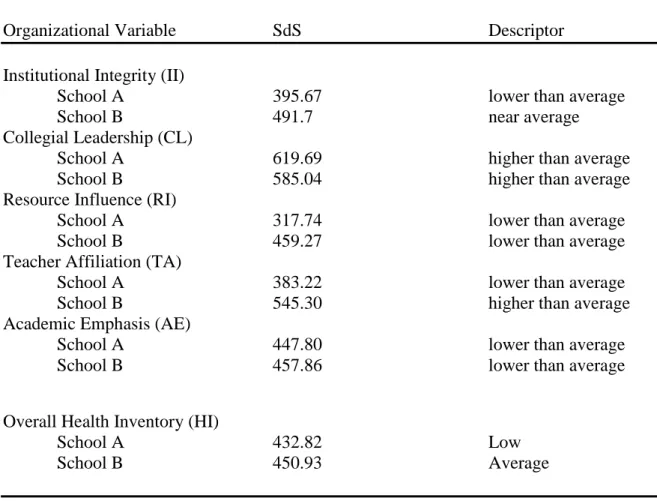
Table 1. Descriptive Statistics for Teacher and School Health Variables 59 Table 2. Standardized Scores (SdS) for School Health Variables 60
viii
List of Appendices
Appendix A. OHI-E 61
Appendix B. Teacher Efficacy Scale 62
Appendix C. Demographic Survey 63
Appendix D. Interviews 64
Appendix E. Informed Consent 65
ix Abstract
This study examined perceived organization health and teacher efficacy in two rural New York State schools using quantitative and qualitative measures. Quantitative data was collected using the Organizational Health Inventory for Elementary Schools (OHI-E) and the Teacher Efficacy Scale (Short Form). Qualitative data was collected using interviews developed by the researcher addressing the specific areas of organizational health and teacher efficacy assessed by the
measures. Quantitative data obtained from measures and qualitative data obtained from
interviews and observer perceptions were compared to determine if differences between schools existed, if the measures accurately assessed the variables in the schools, and if categorizations provided by the normative data was representative to the current sample. Results of this study indicated that quantitative differences did exist between schools with regard to organizational health; however, significant differences between schools did not exist for teacher efficacy.
Qualitative data provided further insight into each school’s profile and teacher response patterns.
Combining qualitative analysis with quantitative data collection was shown to be a resourceful approach in further assessing participant response patterns and perceptions.
Organizational Health and Teacher Efficacy: A Qualitative Analysis of Two Measures in Elementary Schools
Chapter 1: Introduction & Review of the Literature
Teacher efficacy has been shown to be a powerful construct related to student outcomes such as achievement (Armor, Conroy-Oseguera, Cox, King, McDonnell, Pascal, Pauly &
Zellman, 1976; Ashton & Webb, 1986; Moore & Esselman, 1992; Ross, 1992), motivation (Midgley, Feldlaufter & Eccles, 1989) and sense of efficacy (Anderson, Greene & Loewen, 1988). Of the many factors contributing to teacher efficacy is the concept of organizational health. Teacher efficacy and school health are the two major constructs of this study. The purpose of this study was to add to the knowledge base relating to teacher efficacy and organizational health by examining these variables in rural schools. This investigation was intended to build upon Hoy’s and Woolfolk’s (1993) study on urban and suburban samples;
however in this study rural schools were studied qualitatively. To date, research has failed to study these constructs in rural schools using these measures. The method used provides a more tangible depiction of internal factors observed and reported by teachers from two rural schools.
Self-efficacy
Self-evaluation is a concept that encompasses perceptions about various aspects of humanness (Judge, Bono & Locke, 2000). Through self-evaluations, people form perceptions about their self-worth, the amount of control they have over their own affairs, and about the value of life and their personal vulnerability (Steyn & Mynhardt, 2008). Additionally,
individuals form perceptions about their capacity to accomplish goals and overcome obstacles, a concept that Bandura refers to as self-efficacy perception (2002).
Bandura (1997) makes a clear distinction between the two concepts of self-efficacy and self-esteem that are often used interchangeably. Bandura identifies perceived self-efficacy as one being “concerned with judgments of personal capability,” whereas self-esteem is identified as concern “with judgments of self-worth” (p. 11).
Self-efficacy theory states that individuals with similar skills may perform quite differently depending on their personal beliefs of self-efficacy. Furthermore, effective functioning is thought to require both skills and self-efficacy beliefs. The ability to alter and modify pre-existing skills is necessary to be successful. As Bandura indicates, “perceived self- efficacy is not a measure of the skills one has but a belief about what one can do under different sets of conditions with whatever skills one possesses” (1997, p. 37).
Mone, Baker and Jeffries (1995) proposed that perceived personal efficacy predicts the goals people set for themselves as well as their performance attainments, whereas self-esteem affects neither. Bandura’s Model of Self-Efficacy Expectations (1977, 1997) postulates that self- efficacy expectations have at least three behavioral consequences (approach vs. avoidance behavior, quality of performance of behaviors, and persistence in the face of obstacles or disconfirming experiences). The model would then indicate that low self-efficacy expectations regarding a behavior would lead to avoidance, poorer performance, and a tendency to abandon the behavior when faced with difficulty or failure.
Bandura identifies four sources of efficacy information which lead to the initial development of efficacy expectations: performance accomplishments, vicarious learning
(modeling), emotional arousal (anxiety), and social persuasion/encouragement (1977, 1997).
These four sources can also be used to increase efficacy expectations in an individual or group (Betz, 2004).
Teacher Efficacy
Teacher efficacy is based on Bandura’s concept of self-efficacy. Teacher efficacy has been defined as “the extent to which the teacher believes he or she has the capacity to affect student performance” (Berman, McLaughlin, Bass, Pauly & Zellman, 1977, p. 137), or as the
“teachers’ belief or conviction that they can influence how well students learn, even those who may be difficult or unmotivated” (Guskey & Passarao, 1994, p. 4). Bandura (1977) found that teacher efficacy beliefs influence the amount of effort put forth, length of persistence in challenges, level of resiliency when dealing with failure, and the amount of stress and/or depression experienced when coping with demanding situations.
From a social-learning theoretical base, work by Rotter (1966) indicated that teachers with a high level of self-efficacy believed that they could strongly influence student achievement and motivation. Early studies related to this theory found teacher efficacy to have a strong positive effect on student performance, project goals achieved, and amount of teacher change (Armor et al., 1976; Berman et al., 1977). Research focusing specifically on Rotter’s theory indicated a scheme of internal-external locus of control concerned with causal beliefs regarding outcomes and actions (Tchannen-Moran, Hoy & Hoy, 1998).
Bandura (1997) on the other hand specifically identifies locus of control as a separate concept from self-efficacy. Bandura indicates that perceived self-efficacy is a strong predictor of behavior, whereas locus of control is a weak predictor. Beliefs about whether one can produce
certain actions (perceived self-efficacy) are not the same as beliefs about whether actions affect outcomes (locus of control) (Tchannen-Moran, Hoy & Hoy, 1998).
Teacher Efficacy & Student Outcomes
Teacher Efficacy (TE) “measures the extent to which teachers believe their efforts will have a positive effect on student achievement” (Ross, 1995, p. 228). Teacher efficacy has been found to consistently predict students’ cognitive growth, even when ability is controlled.
Teacher efficacy has also been found to be associated with affective factors such as enhanced student motivation, increased self-esteem, improved self-direction, and positive attitudes toward school. It is important to note that the associations between teacher efficacy and achievement have only been found to be correlational; therefore, unexamined variables may be present.
Research suggests that teachers with high teacher efficacy set higher standards for themselves, which would thereby indicate that they would adopt more challenging goals and increase persistence (Bandura, 1997). Furthermore, Bandura’s theory suggests that these individuals would set higher standards for their students, persist until goals were reached, and would make students accountable for behaviors (Ross, 1995). In addition, it is likely that a reciprocal relationship between student success and teacher feelings of competence and anticipation of success for the future exists.
Development of Teacher Efficacy
Research suggests that self-efficacy beliefs, once developed, are somewhat resistant to change. Watters and Ginns (1995) found that coursework and practica have differential impacts on teaching efficacy. Their research suggests that general teaching efficacy (efficacy related to beliefs about the task) are more likely to change when students are exposed to vicarious learning
experiences or social persuasion such as experienced during coursework. However, actual teaching experiences such as student teaching practica have been found to have a greater impact on personal teaching efficacy, also known as their personal skills and abilities (Housego, 1992;
Hoy & Woolfolk, 1990). Bandura’s theory (1977) suggests that teacher efficacy would be most malleable early in learning, which logically leads to a discussion of the importance of preservice training.
Student teaching experiences and practica provide an excellent opportunity for training teachers to make evaluations about themselves in an effort to increase teaching capacities.
Tschannen-Moran, Woolfolk and Hoy (1995) indicate that the manner in which the preservice teacher is immersed into the field may be detrimental to his or her future as a professional. They stress the importance of training programs allowing for more actual experiences with proper supervision and guidance.
Bandura (1986, 1997) describes four sources of self-efficacy information: mastery experiences, physiological and emotional arousal, vicarious experience, and social persuasion.
Mastery experiences can be described as the perception that an experience has been successful.
Bandura (1986, 1997) states that efficacy is increased when success is achieved on difficult tasks, with little assistance, early in learning. Interestingly, Bandura (1986, 1997) indicates that not all successful experiences strengthen efficacy. Efficacy is not enhanced when a task is successful with extensive external support, the task is unimportant, or occurs late in learning.
This research indicates that teacher training should foster independence with guided support and should occur early. Physiological and emotional arousal has been found to improve performance when occurring at moderate levels resulting in increased attention and energy (Bandura, 1997).
However, high levels of arousal typically result in stress and impaired functioning. Therefore, early training experiences should include tasks that are challenging for the individual, but not overwhelming in nature. Mentors should provide emotional support and trainees should be encouraged to remain aware of the physical and emotional well-being. Vicarious experiences occur when a trainee watches another individual teach. By observing other individuals teach, a trainee can not only gain knowledge of strategy and skill, but by observing a teacher who is competent and confident, a trainee can actually increase personal teaching competence (Bandura, 1977, 1986). Finally, verbal persuasion can result in increased effort and even a willingness to try new things. Bandura (1982) indicates that persuasion from a competent, trustworthy, and credible source is most successful. Additionally, self-perceptions may actually be lowered as a result of harsh feedback. Therefore, the manner in which guidance and feedback is delivered may directly be related to self-perceptions of the trainee.
It is thought that these four sources are major contributors to a teacher’s analysis of a task as well as to teaching competence self-perceptions. Furthermore, a training model including the guidance and observations of a competent, trustworthy, credible, and self-efficacious teacher may contribute to the trainee engaging in self-comparison and self-analysis thereby promoting personal growth as well as the growth of teaching skills and methods.
For experienced teachers, support and improvement with regard to teacher efficacy is vital. Tschannen-Moren, Woolfolk-Hoy and Hoy (1998) focus on teaching competence defined as verbal persuasion in the form of professional development coupled with the development of new skills. Ross (1994) identifies implementation of change to be a time when increased supports are necessary including opportunities to engage in activities such as role play with
feedback. These practices and supports are identified as being vital in the rebound of efficacy beliefs during stressful or challenging times.
Teacher efficacy is not commonly treated as a unitary trait, but rather is distinguished by two traits of efficacy when quantitative data is obtained and analyzed (Ross, 1995). Personal teacher efficacy (PTE) is a teacher’s expectation that he or she can bring about student learning.
General teacher efficacy (GTE) is the belief that teachers are able to do so despite the impact of environmental factors beyond their control (Ross, 1995).
Measurement of Teacher Efficacy
From the two earlier discussed theories, Rotter’s social-learning theory and Bandura’s social-cognitive theory, a body of research in scale development emerged. A number of scales used to assess levels of teacher efficacy were consequently developed. Scales such as the Teacher Locus of Control (Rose, 1981) and Webb Efficacy Scale (Ashton, Olejnick, Crocker &
McAuliffe, 1982) were developed from Rotter’s concept of generalized expectancies of
reinforcement (Tchannen-Moran, Hoy & Hoy, 1998). Bandura’s concept of self-efficacy served as the basis for such scales as the Teacher Efficacy Scale (Tschannen-Moran & Woolfolk Hoy, 2001), Ashton Vignettes (Ashton et al., 1982), and Bandura’s Teacher Efficacy Scale (1998).
Gibson and Dembo (1984) developed a 30-item scale to assess teacher efficacy. Factor analysis yielded two independent dimensions: (1) outcome expectations about the consequences of teaching labeled as “general teaching efficacy”; and (2) self-efficacy expectations in relation to one’s own teaching labeled “personal teaching efficacy.” This first identified dimension reflects a general belief about power of teaching and attitudes toward education (GTE), whereas the second scale dimension is more representative of a teacher’s personal sense of efficacy
(PTE). Gibson and Dembo (1984) predicted that teachers who score high on both dimensions (PTE and GTE) would be active and confident in their responses to students, be persistent, provide a greater academic focus in the classroom, and provide influential feedback. The researchers conversely proposed that teachers scoring low on both dimensions would be more likely to give up and give in during challenging times. Hoy and Woolfolk (1993) have used an abbreviated form of the measure including 10 items: five PTE and five GTE. Reliability for the abbreviated version subsets was in the range of the longer measure.
Research using the Gibson and Dembo instrument has assessed the impact of teachers’
sense of self-efficacy on their behaviors and attitudes and on student achievement. Gibson and Dembo (1984) found that teachers with higher teacher efficacy (high scores on both PTE and GTE) exhibited the following behaviors: less student criticism, persistence during student failure, and leading small group instruction. Allinder (1994) found that PTE was associated with a willingness for instructional experimentation, implementation of innovative methods, high levels of organization and planning, fairness, and enthusiasm in teaching. Moreover, a high PTE is predictive of willingness to work with students experiencing academic difficulty rather than to refer to special education.
With regard to student outcomes, Moore and Esselman (1992) found that second and fifth grade students of teachers with a greater sense of GTE outperformed their peers in math on the Iowa Test of Basic Skills. Watson (1991) found an association between teachers with high GTE and student math scores as well as high PTE and reading achievement in majority Black,
majority White, and rural schools. Furthermore, Woolfolk, Rosoff and Hoy (1990) found that
teacher efficacy was not only related to student outcomes, but also students’ attitudes toward school itself including overall levels of student interest.
Organizational Health
Sheridan and Gutkin (2000) identify four pivotal assumptions addressing students within the contexts of classrooms, schools, and communities.
Assumption 1: Each student is an inseparable part of a small social system.
Assumption 2: Disturbance is not viewed as a disease located within the body of the student but rather, as discordance in the system.
Assumption 3: Discordance may be defined as a disparity between an individual’s abilities and the demands or expectations of the environment.
Assumption 4: The goal of any intervention is to make the system work. (p. 489)
With these assumptions in mind, it becomes clear that in order for a system to operate effectively and efficiently, social contexts must be evaluated.
Parsons, Bales and Shils (1953) identified four basic problems that social systems must solve to survive, grow, and develop: (1) acquiring sufficient resources and accommodating to their environments, (2) setting and implementing goals, (3) maintaining solidarity within the school, and (4) creating and preserving a unique value system. Furthermore, Parsons (1967) identifies three distinct levels of control over these needs: technical, managerial, and
institutional. The technical level functions to produce educated students and is concerned with the teaching-learning process. The managerial level focuses on the control of internal
administrative function, thereby focusing on principals’ abilities to develop and instruct loyalty,
trust, commitment, and motivation. Lastly, the connection of the school with the environment occurs at the institutional level.
Defined as “the quality and consistency of interpersonal interactions within the school community that influences children’s cognitive, social, and psychological development,” school climate has been reported to have a great impact on children (Haynes, Emmons & Ben-Avie, 1997, p. 322). Studying school climate focuses not only on the environment’s direct relationship with children’s development, but also on indirect factors as staff support. Research conducted by the Yale Child Study Center found that a positive school climate is especially important for children from low SES backgrounds (Haynes, Emmons & Ben-Avie, 1997).
The concept of organizational health is similar to that of school climate. Hoy and Sabo (1998) define the study of organizational health/school climate as producing a snapshot of behavior (organizational and individual) for the managing and changing of behaviors. In an early analysis of the organizational health of schools, Miles (1969) defined a healthy system as being a framework of an open social system with fairly durable system properties. The study of the health of an organization focuses on the factors that facilitate and impede the development of positive interpersonal relationships within the organization itself (Hoy & Forsyth, 1986; Miles, 1969). A healthy school is described as one in which harmonious relationships exist between individuals of all levels. Not only do healthy schools appear to be high-achieving (Hoy, Tarter &
Bliss, 1990) but, school health is identified as an important variable related to school effectiveness (Hoy & Feldman, 1987).
Measurement of Organizational Health
Following the attempts of other researchers to develop scales to assess organizational health, Hoy and Feldman (1987) produced the Organizational Health Inventory. Item generation followed the three-level model proposed by Parsons (1967). At each of the three levels, scale items focus on related issues. For example, at the technical level, items focus on morale, cohesiveness, trust, enthusiasm, support, academic press, order, and achievement. At the
managerial level, items focus on principal behavior, specifically task- and achievement- oriented behavior, collegial and supportive behavior, ability to influence superiors, and ability to provide adequate resources for teachers. Finally, institutional-level items focus on the school’s ability to cope successfully with outside forces.
Once the items were developed, participants were asked to rate items on a 5-point Likert scale. Seven dimensions of organizational health were identified: institutional integrity,
principal influence, consideration, initiating structure, resources support, morale, and academic emphasis. Institutional integrity serves as an indicator of health at the institutional level.
Principal influence, consideration, initiating structure, and resource support measure health at the managerial level. Morale and academic emphasis indicate health at the technical level.
Dimensions of Organizational Health
Institutional Integrity (institutional level) is defined as a school’s ability to cope with its environment in a way that maintains the educational integrity of its programs. A school scoring high on this dimension would encompass teachers that are protected from unreasonable
community and parental demands. Managerial level dimensions are principal influence,
consideration, and resource support. Principal Influence is the principal’s ability to influence the
actions of superiors. Effective principalship is defined as being able to persuade superiors, obtain additional consideration, and unimpeded by the administrative hierarchy. Consideration is principal behavior described as friendly, supportive, open and collegial. A genuine concern of a principal for the welfare of the teachers is identified here. Resource Support refers to a school where adequate classroom supplies and instructional materials are available and extra resources are supplied readily if requested.
The final two dimensions are regarded as technical level. Morale is described as a collective sense of friendliness, openness, enthusiasm, and trust among faculty members. A school rating high in this dimension would encompass teachers that liked each other and their jobs, help one another, feel a sense of accomplishment from their work, and feel pride for their school. Academic Emphasis is the extent to which a school is driven by a quest for academic excellence. A school with high levels of academic emphasis would set high, but achievable goals for students, the learning environment would be orderly and serious, teachers would believe in their students’ ability to achieve, and students work hard and respect those that perform well academically.
The final version of the original Organizational Health Inventory (OHI) was a 44-item instrument that mapped the organizational health of secondary schools along seven dimensions (Hoy & Feldman, 1987). More recently, Hoy has expanded the development and use of OHI to the OHI-Revised Middle (OHI-RM) a 45-item Likert questionnaire measuring six dimensions of the health of middle schools: academic emphasis, teacher affiliation, principal influence,
collegial leadership, resource support, institutional integrity (Hoy & Sabo, 1998). Most recently, the OHI for elementary schools was developed as a 37-item Likert questionnaire measuring five
dimensions of school health: Institutional Integrity, Collegial Leadership, Resource Influence, Teacher Affiliation, and Academic Emphasis (Hoy, Tarter & Kottkamp, 1991; Hoy & Tarter, 1997). Institutional Integrity (II), as previously described, describes a school that is not vulnerable to community interests and teachers are protected from unreasonable outside demands. Collegial Leadership (CL) refers to friendly, supportive, open, and equal principal behaviors. Resource Influence (RI) describes the principal’s ability to affect the action of
superiors to the benefit of the teachers; teachers are given adequate supplies. Teacher Affiliation (TA) refers to a strong affiliation with the school among teachers. Finally, Academic Emphasis (AE) refers to a school’s expectations for achievement.
Organizational Health and Teacher Efficacy
A study by Hoy and Woolfolk (1993) examined the relationships between teacher
efficacy and the aspects of a healthy school climate. A random sample of teachers from 37 New Jersey urban and suburban elementary schools completed the Teacher Efficacy Scale and the OHI for elementary schools. Results indicated that a healthy school climate (high ratings on a majority if not all of the six dimensions) was conducive to the development of personal teaching efficacy. Therefore, the results suggest that teachers’ confidence that they can successfully reach students is supported by organizational factors. Furthermore, the data indicated that institutional integrity and morale predicted general teaching efficacy, further demonstrating that the two dimensions of teaching efficacy (personal and general) are separate sets of beliefs.
Purpose
The focus of this investigation was to collect qualitative data from two rural schools regarding organizational health and teacher efficacy. Qualitative data collection is useful when
sample size is small and the subject is relatively unstudied. Currently, there is no evidence to show if Hoy’s and Woolfolk’s measures correspond to what an investigator may gather qualitatively or observe.
The focus of this investigation was to build upon Hoy’s and Woolfolk’s (1993) study.
However, here organizational health and teacher efficacy were studied in two rural schools using both the measures developed and modified by Hoy and Woolfolk followed by participant
interviews. Ultimately, the researcher aimed to determine if the instruments dovetail with participant perceptions and researcher observations.
Chapter 2: Method Research Questions
The following questions were addressed in this research study: (1) Based on the
researcher’s observations, do the OHI and TE measures appear to have face validity?, (2) Do the two schools differ with regard to organizational health?, (3) Does the OHI accurately capture the differences?, (4) Do the two schools differ with regard to teacher efficacy?, (5) Does the TE measure capture the differences?
Because qualitative research is inductive in nature, it is difficult to hypothesize outcomes.
However, good qualitative research typically generates themes. It was hypothesized that this research would capture multiple themes from each school individually as well as general themes from both schools.
Qualitative Research
Qualitative research methods are becoming more accepted in the field of social sciences due to the greater depth of understanding obtained from qualitative analyses (Berg, 1998).
Dabbs (1982) makes a distinction between quantitative and qualitative research indicating that quantitative research refers to counts and measures specifically, whereas qualitative research refers to such things as meanings, characteristics, and descriptions. Using qualitative research to study an agency’s meanings and characteristics through examining the social setting and its inhabitants is a procedure that seems more natural to a growing number of social science researchers (Berg, 1998).
Taking a multi-dimensional approach to data collection and analysis (triangulation) strengthens the support for an investigator’s/observer’s findings (Denzin, 1988). Qualitative methods used by researchers fall along a continuum ranging from controlled (e.g., standardized survey) to uncontrolled procedures (researcher observation). Thus, researchers must evaluate the nature of the study, the social setting, and the inhabitants to determine the specific procedures or combination of procedures to be used (Berg, 1998).
Once collected, data must be organized and analyzed to provide interpretations. Ryan (2003) names theme identification as one of the most fundamental tasks in analyzing qualitative research. He defines themes as, “abstract, often fuzzy, constructs which investigators identify before, during, and after data collection” (Ryan, 2003, p. 85). Ryan outlines a number of the theme identification techniques in existence based on such methods as: word analysis, comparison/contrast, and social science approach (2003).
The word repetition approach directly assesses the words people use, by observing the language. Ryan describes words that are used often as salient in the respondents’ minds (2003).
An informal word repetition analysis would involve simply noting words commonly used by a respondent.
In the compare/contrast approach, investigators note similarities and differences in data obtained. Glazer and Strauss (1967) refer to this as the constant comparison method. Using this approach, the investigator would question participants to gain further insight into how one participant’s perceptions may compare to another participant’s perceptions or the investigator’s observations.
A social science approach to qualitative research involves assessing for evidence of such things as social conflict, interpersonal relationships, status, and problem solving (Ryan, 2003).
Strauss and Corbin (1990) discuss the importance of an investigator’s sensitivity to context and conditions in an effort to fully understand the system or individual being studied.
Qualitative research, although informative, does not predict future behavior. Rather, the approach focuses on describing current behaviors which in turn help us to understand, modify, and possibly prevent some behaviors in the future (Polkinghorne & Gribbons, 1999).
In this study, interviews were created to allow for follow-up and additional data to be collected focusing on the OHI and TE measures. For the OHI, interview questions were
developed directly following the five organizational health dimensions outlined by the authors.
Each dimension was represented by an interview question (e.g., How do people get along?- Teacher Affiliation). A similar approach was taken for developing the interview questions addressing the TE measure. Based on the definition of teacher efficacy outlined by the authors, four questions were developed to address the teachers’ perceptions of strategies and responses to challenges in the field (e.g., What is the most challenging part of your role as a teacher? How do you respond to the challenges?).
Once interviews were complete, participant responses were noted in entirety then analyzed for overall themes, similarities and differences. Additionally, for each participant, interview responses were compared to measure responses to determine the correlation of information and to even assess the validity of responses in some cases. Additionally, school interview responses were assessed for overall themes, similarities and differences. School qualitative data was then compared to quantitative data obtained by the measures to determine if similar results were produced.
Observations and perceptions were also an integral part of this evaluation. The researcher observed, followed-up on interviews, questioned others, and noted perceptions throughout the research process in an attempt to thoroughly assess and report each school’s climate and teacher efficacy levels.
As a district intern, the researcher was able to have access to a more thorough observation and assessment of both schools. The researcher worked in both schools and had contact with all teachers through interviews, observation, and informal conversation. In addition, the researcher had access to third-party information that provided insightful and supplemental information in many areas. Observations and perceptions noted and reported in this study are based not only on information obtained from the researcher’s current position as district intern, but also based on the ongoing contact with the district since 2006 relating to a year-long field placement experience and an additional research project.
Participants
The participants in this study were 12 teachers from two rural New York elementary schools (School A and School B; 6 teachers from each school) located in the same district.
School A enrolls approximately 495 students (Grades K-5) and School B enrolls approximately 68 students (Grades K-5).
In addition to size, the two schools vary in additional ways. School A is located in an area of highter SES levels. Children attending School A are a mix of children of teachers from the district, medical and business professionals from the area, and some from lower SES families. Children attending School B are primarily low SES. The overall mentality of the district is that School A is the goal location for teachers and students. Families living in the School B area can choose to send their children to School A however, most do not. Additionally, teachers can put in requests to move between schools if openings exist; however, teachers from School A have very infrequently moved to School B and teachers from School B rarely get placed at School A. Most recently, a teacher from School B was moved to School A. This teacher was considered to be exceptional, thereby, justifying the transition. The move caused considerable tension among the teachers of School B.
With regard to appearance, School A is a newly renovated facility with large classrooms, newer desks and equipment, Smartboard technology, two gymnasiums, a large lunchroom with picture windows, two faculty rooms, and a fitness room for faculty and staff. School B is an older building and substantially smaller than School A. There is a faculty room that doubles as a mental health clinic facility operated by a nearby university in the evening, a small gym, and small classrooms containing older furniture and equipment. In addition, construction in School B has been ongoing for a number of months resulting in sections of the school being covered and access denied.
Teachers at School A present themselves professionally in dress, wearing dress pants or skirts each day with the exception of district-wide “dress down days.” Teachers from School B do not appear to as consistently adhere to the dress code policy. During district-wide events, teachers from the schools were not observed to interact across schools, but rather maintained contact with teachers from their respective schools.
Overall, Schools A and B are quite different with regard to size, appearance, teachers, families, and location. Ultimately, from an outsider’s view, one may not realize that the two schools are part of the same district. Consequently, they also appear to operate independently of one another. Furthermore, teachers from School B appear to take great pride in their
independence and lack of need for administrative leadership.
The participants varied based on age, gender, educational level, years of teaching experience, and years of experience within the current school. For School A: average teacher age was 32 years, all six participants were female and had obtained a master’s degree, average years as a teacher was ten, and average years teaching in School A was also ten. For school B:
average teacher age was 37 years, four participants were female and two participants were male, five participants were master’s level and one was bachelor’s level, average years as a teacher was twelve, and average years teaching in School B was eight.
Variables
Teacher efficacy is defined as a teacher’s belief in his/her ability to have a positive effect on student learning. Organizational health is defined as critical aspects of organizational life that meet the instrumental and expressive needs of the school social system (Hoy, Podgurski &
Tarter, 1991; Hoy, Tarter & Kottkamp, 1991).
Instruments
Variables of general teaching efficacy (outcome expectations about the consequences of teaching) and personal teaching efficacy (reflects self-efficacy expectations in relation to one’s own teaching) were measured using the Teacher Efficacy Scale- Short Form (Gibson & Dembo, 1984) as adapted by Woolfolk & Hoy (1988, 1990). A semi-structured interview addressing perceived teacher efficacy constructs as measured by the Teacher Efficacy scale was also conducted (see Appendix D).
The Organizational Health Inventory (OHI) for elementary schools was used to assess dimensions of the schools’ health. The OHI is a 37-item instrument that measures five elements of school health: Institutional Integrity, Collegial Leadership, Resource Influence, Teacher Affiliation, and Academic Emphasis. Items appearing on the inventory are descriptive statements in which participants were asked to indicate the extent to which each statement characterized their school along a four-point Likert scale from “rarely occurs” to “very frequently occurs.” Responses produce means for each item which can be converted to
standardized scores (SdS) for each of the five dimensions using normative data provided by the authors.
Each scale has a relatively high reliability coefficient as indicated by the developers (Hoy
& Woolfolk, 1993). Alpha coefficients for each subtest were as follows: institutional integrity (.86), principal influence (.83), consideration (.91), resource support (.87), morale (.89), and academic emphasis (.72).
A semi-structured interview was also conducted to obtain additional information regarding OH perceptions. Participants were asked to briefly discuss the five dimensions of organizational health relating directly to the constructs derived from the OHI (see Appendix D).
A demographic survey (Appendix C) was completed by each participant to assess: gender, age, education level, years experience as a teacher, and years employed in the school as a teacher.
Procedure
Participants were selected from the two predetermined elementary schools (School A and School B). Participants were provided with a letter of informed consent briefly describing the research and explaining confidentiality (Appendix E). Upon agreement to participate, the teachers completed the demographic survey, the OHI, and the Teacher Efficacy Scale in the presence of the researcher. The researcher then interviewed and audio taped the participants regarding perceived organizational health and teacher efficacy. Interviews followed the outline described in Appendix D.
Analyses
Qualitative organizational health and teacher efficacy data obtained from the participant interviews were analyzed for themes prior to the computing of scores from the measures in an attempt to control for confounding variables and to increase validity. Interview themes were extracted using the methods outlined by Ryan (2003). Data obtained from the measures and from the interviews were compared to determine if the findings matched and produced similar profiles. In addition, observer perceptions were noted. Demographic data was analyzed using
means to provide a profile of each school’s sample. The Organizational Health Inventories and Teacher Efficacy Scales were scored based on the procedures outlined by the authors.
The OHI measure was scored for each respondent resulting in an individual score on each subtest. Then, an average school score for each item was computed to be used to calculate each school’s overall health profile. Furthermore, the average school score (for School A and School B) for each subtest was computed, compared using an independent-sample t-test, and then
converted to standardized scores using the data provided by the authors. For the TE measure, the scores from all teachers were combined to calculate an average score for both Schools A and B.
Chapter 3: Results & Discussion
Microsoft Excel 2003 was used to calculate the means, standard deviations and t-test statistics. Qualitative data was assessed using theme identification techniques such as: word analysis, comparison/contrast, and the social science approach outlined by Ryan (2003). In addition, observer perceptions were noted.
Teacher respondents appeared to participate in the interviews actively and were engaged in the interview questions. Responses provided appeared to be genuine and honest. When asked to elaborate on certain areas, participants did so without reservation. Some participants
responded in ways that would be considered to be somewhat reserved, however were effectively able to express their true feelings through a careful selection of words and phrases. Other participants were very literal in their responses and reported vivid feelings and opinions.
Teachers participated on a volunteer basis and were told prior to the interview questions being asked that they were not obligated to answer all interview questions and could refuse to answer
or even end the interview at any point. No participants exercised this right. These observations indicate that the participant responses overall are reliable and useful for interpretation.
Organizational Health
Participants’ responses on the OHI were averaged for each of the five subtests for both School A and School B by summing the average school scores as outlined by Hoy, Tartar and Kottkamp (1991). Descriptive statistics for teacher OHI data are summarized in Table 1.
Using the method and data provided by the authors of the measure, subscale means for Schools A and B were converted to standardized scores (SdS) with a mean of 500 and a standard deviation of 100. As shown in Table 2, standardized scores yielded categorical comparisons.
Based on the normative data provided by the authors used as a comparison, for Institutional Integrity, School B reported near average scores and School A reported lower than average scores. On the dimension of Collegial Leadership, both schools reported higher than average scores, with School A reporting slightly higher scores. For Resource Influence, both schools reported lower than average scores, with School B reporting higher scores overall. On Teacher Affiliation, School B reported higher than average scores while School A reported less than average scores. Lastly for Academic Emphasis, both schools reported similar, lower than average scores.
Overall Health Inventory (HI) scores were determined for both schools by averaging the standardized scores. The authors also provide categorization criteria for standardized scores in this area. As summarized in Table 2, the reported HI for both schools was less than average based on the comparative data provided. School B reported higher scores than School A.
Institutional Integrity (II).
The standardized scores for II differ by approximately one standard deviation with School B reporting slightly higher scores. A t-test indicated that there was not a significant effect for means (t(10) = 1.54, p>.05).
Institutional Integrity is defined as describing a school that has integrity in its educational program (Hoy, Tarter & Kottkamp, 1991). A school reporting high scores in II would be
expected to not be vulnerable to narrow, vested interests of the community groups and to be an environment where teachers feel protected from unreasonable community and parental demands.
Therefore, results from the OHI standardization would indicate that School B teachers see slightly greater integrity in their academic programs and feel more protected from unreasonable demands.
Qualitative data was obtained by first asking teachers, “Tell me about the school’s central philosophy.” This question was then followed by more specific questions regarding external demands as the observer deemed necessary in an attempt to gather sufficient data.
Teachers from School B identified such themes as helping students reach his/her goals and potential, encouraging the development of productive individuals, meeting individual needs, and creating problem solvers and life-long learners. Teachers described the school to be like a
“family” and mentioned a “nurturing” quality. One teacher responded to this question with,
“nice in a nurturing way.” Another teacher identified the school as adaptive, “we roll with the punches…we all adapt easily.” In addition, this teacher indicated that the teachers make many decisions at this school, that parents are supportive and that there are not many outside demands.
Another teacher confirmed this by indicating that demands are not an issue, but rather that the
parents are uninvolved, “as long as we have their kids for 7.5 hours of the day they are happy.”
Another teacher stated that school is the only structure many of the children have, “a lot of kids don’t get that extra help at home.”
The teacher interview responses do, indeed, reflect a focus on the children’s education, but likely not in the programming integrity that the authors may have intended. The teachers of School B appear to focus more on educating the children for life beyond the classroom.
Additionally, the protection from unreasonable demands may not have been accurately assessed with the OHI, as teachers indicated an uninvolved parental community. Multiple teachers reported not having parental demands to be protected from. Therefore, the reported II score may not be truly representative for School B.
The reported scores for School A were slightly lower than School B in the area of Institutional Integrity. But, interestingly, School A appeared to the observer to have a stronger sense of academics and integrity of the educational program. Walking into the building of School A one would immediately see a sign that reads, “In this school, children are our first priority.” Teacher reports seem to support this display of integrity. When asked to tell about the school’s central philosophy, teachers from school A reported things such as: commitment, children as the “core,” programs geared towards children, helping children find their way, and proactive approaches. Additionally, teachers from this school commonly referenced some variation of the school’s vision or mission statement when first responding to this question: “All children will grow and succeed in their own way,” “create students to enter the world as creative and critical thinkers and to be successful citizens.”
Addressing the area of external demands, teachers from School A reported that
communication and parental inclusion in the classroom is an expectation, parents are vocal and opinionated at times, parents are known to be appeased due to fear of retaliation by parents, and that there is substantial teacher pressure. The teachers identified these external demands from the community as both positive and negative. Although the pressure keeps the teachers working hard and self-monitoring, it was reported as very stressful at times (e.g., “unnerving to be under a microscope”) and even affecting their decision making in the classroom. Overall, however, there seemed to be consensus that the integrity of the program holds up to the outside demands.
It is evident that School A and B are facing very different external demands. School A is facing very involved, active, and vocal parents, whereas School B is facing under-involved, even distant parents who, at times, devalue education and the system. School A appears to respond to its challenges by maintaining open lines of communication and instilling trust in families.
School B appears to respond by being the student’s “family” and even working toward instilling educational values in the child. It does not appear that either school truly possesses more Institutional Integrity than the other, but rather, it appears that the OHI has possibly measured two very different aspects of this variable.
A close evaluation of the OHI items for this subscale indicated that the items of the OHI that produce the II score may have been interpreted differently for Schools A and B. One item of the OHI, “The school is vulnerable to outside pressures,” is an example. For School A,
participants rated this item (reverse scored) as “often occurs” or “very frequently occurs” which resulted in a low score contributing to the overall II score. School B participants rated this item as “rarely occurs” or “sometimes occurs” resulting in a high score contributing to the overall II
score. Interestingly, School B participants indicated in the interview that there were not outside pressures to respond to, whereas School A participants identified very involved, active, and vocal parents in the community. A similar response pattern existed for, “Community demands are accepted even when they are not consistent with the educational program,” “Teachers feel pressure from the community,” and, “A few vocal parents can change school policy,” with teachers from School A identifying more demands.
Based on the standardized scores, both schools (A and B) were categorized as lower than average on the II dimension with school B approaching the average range. However, based on the observer’s perceptions and the participant interviews, it is unclear as to whether the OHI has accurately measured institutional integrity as it is defined by the authors. School B does not have many outside demands with regard to pressure; therefore, this may not have been an accurate assessment of how the school deals with such demands. Additionally, there are many other demands affecting the integrity of the academic programs that were not assessed on the OHI’s II scale, such as family dynamics and a lack of investment in education from families.
School A appears to have a great deal of community involvement; however, it is unclear from the OHI data if the pressure from vocal parents is viewed as positive or negative by the reporting teachers. The OHI appears to be assessing negative pressure. Teachers in interviews indicated that although difficult at times, the demands and pressures keep them responsible and committed to the educational programs.
In summary, based on the standardized scores, Schools A and B reported similar, lower than average scores with regard to Institutional Integrity. An interesting aspect of discrepancy is the external demands between Schools A and B that surfaced in the qualitative data. This
discrepancy resulted in questions regarding the accuracy of the variable being assessed for School B.
Collegial Leadership (CL).
The standard scores for CL were similar for Schools A and B with teachers from School A reporting slightly higher scores. Results of a t-test indicated that there was not a significant effect for means (t(10) = 0.164, p>.05).
Collegial Leadership refers to behavior by the principal that is friendly, supportive, open and guided by norms of equality (Hoy, Tarter & Kottkamp, 1991). Furthermore, a school rated high in CL would likely have a principal that sets the tone for high performance with known expectations.
Qualitative data was obtained by first asking teachers, “Tell me about the school building leadership.” This question was then followed by more specific questions regarding external demands as the observer deemed necessary in an attempt to gather sufficient data.
Interestingly, the two schools operate very differently in this area. School A has a building principal who previously was employed as a teacher in the building. School B has a building principal who is beginning his second year in the building on a part-time basis. He has dual roles in the district, also serving as the district curriculum coordinator.
In the interviews, teachers from School A identified their building leader to be the
building principal. Teachers described this individual as “innovative,” “approachable,” “open to new ideas,” and a “great leader.” Overall, the principal was described as being respected in the building. Furthermore, this individual was described as a “networker” having “connections
with people and with kids” so she “gets what she wants because she has good relationships built.” She was also described as a “mover and a shaker” relating to change.
With regard to negative aspects, teachers indicated that the building principal deals with many external demands that prevent her from making decisions in some cases. However, this too was framed positively. One teacher stated, “I commend her for how she keeps it together, how she handles it… she always has a positive attitude.” Some teachers did indicate that the principal is very busy and is often unavailable due to district commitments at the district office.
However, some teachers indicated that the principal is prompt at responding to concerns and will
“make time” to address issues as they arise. But others described her as hard to reach and
indicated that things could be “done differently” with regard to the delegation of responsibilities.
For school B, one teacher described the day-to-day building principal as “very weak,”
strict, and “by the book,” but “trying.” However, multiple teachers indicated that they are comfortable going to him and stated that he interacts with the students and teachers. These teachers also described him as “visible,” “supportive,” and as having an “open door policy.”
When asked to describe the building leadership one teacher responded, “I think all the teachers are leaders at times, there is not a dictatorship. Everyone is sort of an equal. I think everyone is pretty much on the same level.” Another responded, “Our school nurse is a big part of the leadership. She is from our community…knows the kids and the background.”
All items on the OHI that determine the CL subscale begin with, “The principal...;”
therefore, the measure clearly identifies the leadership to be evaluated within this subscale.
Participants from school B appeared to assess the building principal on the OHI because those
were the clear directions; however, when asked in an interview, they identified a number of other individuals as actual leaders in addition to, and even as opposed to the building principal.
Both Schools A and B rated CL within the higher than average range based on the comparative data provided. For School A, interviews and observer perceptions would yield higher than average results confirming the categorization provided by the OHI on the CL subscale. Participants described the principal from School A to be innovative, approachable, a great leader and respectful.
For School B, participants produced mixed descriptions of the principal. Some
participants described him as open and helpful while others described him as weak, unavailable, and focused on policy. They indicated that the principal is often out of the building for other responsibilities, but when he is in the building appears to be available. Based on these interview responses and observer perceptions, it appears that a categorization of average may be more accurate for School B than the OHI categorization of higher than average.
Resource Influence (RI).
An assessment of means for Schools A and B yielded a significant effect (t(10) = 2.723, p<.05) with School B reporting higher scores for RI. RI refers to the principal’s ability to affect the action of superiors to the benefit of teacher. Furthermore, schools rated high in RI would provide adequate classroom supplies and extra instructional materials for teachers (Hoy, Tarter
& Kottkamp, 1991). Qualitative data was obtained by asking teachers, “Tell me about supplies and materials.” This question was followed with additional questions and prompts as needed in an effort to obtain thorough information.
An assessment of the OHI scale items for this subscale indicates that two factors are being assessed in this subscale: resources and principal influence over resources. These two factors may be better evaluated by looking at them separately for the schools.
In general, teachers from School B indicated that they had the necessities with regard to resources and materials. They discussed the process of requisitioning for materials and most stated that the money provided them with most of what was needed. Teachers indicated that at the beginning of each year, they created a supply list in which parents were required to provide a number of supplies for students to supplement the needs (minimal supply contribution).
Teachers from School B indicated in their interviews that the school is very old and many of the desks and chalkboards are originals. With regard to supplies, they stated that they “are not lacking anything directly,” are “provided with enough to get us by,” and that they “make it work.” When asked about personally supplementing materials, teachers form School B indicated that they utilize the educators’ $250 tax credit to supplement and spend approximately that amount each year in supplementary materials for the classroom.
On the OHI, items factoring into the RI subscale were responded to as “often occurs” or
“very frequently occurs,” producing higher subscale scores on this aspect of the subscale RI.
Such items included: “Teachers are provided with adequate materials for their classrooms,”
“Teachers receive necessary classroom supplies,” and “Supplementary materials are available for classroom use.” These responses indicated that teachers from School B are satisfied with the materials that they are given and that are available.
When asked about resources, teachers from School A discussed concerns. Overall, teachers indicated that budgets are tight, requisitions provide minimal resources, and that they
rely on parents to provide additional supplies as well as on their own personal monetary supplementations. Specifically, teachers from School A indicated that they spend anywhere from $500.00 to $5000.00 per year personally in their classrooms. Teachers indicated that the requisition money “doesn’t go far,” and covers “only the basics,” so they must prioritize materials needed and that funds get smaller each year. Although resources appear to be a concern, most teachers also indicated that they do have comparatively more than most other schools. To the observer, it appears that School A has a great deal of resources. Most classrooms are full of materials, resources, and activity items. There are plenty of textbooks for the children and the library is a large space full of books. Additionally, computers are in all of the classrooms and loaded with many academic programs. It appears that there may be some discrepancy
between resources and expectations in School A. However, it should be noted that the observer is unable to determine what resources are provided by the teacher personally as supplemental materials.
For School A, items on the OHI contributing to the RI influence subscale score as it relates to resources and materials specifically, were rated lower than that of School B. Most teachers rated the items (e.g. “Teachers are provided with adequate materials for their
classrooms”) as “sometimes occurs.” Receiving the lowest scores was the item addressing the availability of supplemental materials. This finding is interesting, as it appears to the observer that School A has more resources. However, there may be higher expectations for teachers in School A than in School B with regard to supplies, thus producing the discrepancy in data.
For the second aspect of this subscale, influence of the principal over resources, School B teachers indicated most commonly that the principal does not have much influence and indicated
this by low responses to items such as, “The principal gets what he or she asks for from superiors,” and, “The principal is able to influence the actions of his or superiors.” Similarly, teachers of School A also reported minimal influence by most commonly responding by rating the items on this subscale low. As a district, it appears that the superintendent is the governing position with regard to policies, procedures, and resources. Therefore, based on the observer’s perceptions, the responses obtained from teachers of both Schools A and B with regard to the influence of the principal over resources would be accurate. Furthermore, for both Schools A and B, it appears that the overall below average subscale score of RI may be largely affected by the OHI items relating to the second aspect of this subscale, the influence of the principal over resources.
OHI data from both schools A and B indicate that reports for RI are lower than average based on the comparative data, but significantly different, with School B reporting higher scores.
From the observer’s perceptions and interviews, there seems to be a discrepancy between the OHI outcomes and the qualitative data. The first issue is that of two aspects being present within one subscale. The subscale is assessing both materials/resources as well as the principal’s
influence over resources. It is apparent that the differing responses to these two aspects within the same subscale may have caused some discrepancy in the overall subscale score. In addition, it is apparent that Schools A and B have different opinions and expectations with regard to
“adequate classroom supplies.”
Teacher Affiliation (TA).
The standard scores for TA for Schools A and B were different with School B reporting higher scores. Results of a t-test indicated that there was a significant effect for means (t(10)=
2.75, p<.05).
Teacher Affiliation refers to a sense of friendliness and strong affiliation with the school (Hoy, Tarter & Kottkamp, 1991). Furthermore, a school rated high in TA would likely have teachers who feel good about each other, have a sense of accomplishment from their jobs and show enthusiasm. Qualitative data was obtained by first asking teachers, “How do people get along?” This question was followed by more specific questions regarding affiliation and accomplishment as needed.
Teachers from School B reported that they get along well and compare their group to a family. One teacher said, “We all get along. We may have a disagreement, but it never lingers and we all get over it.” Another said, “We get along really well. It’s like a family including the students and parents.” Yet another responded by saying, “We are very family- and community- geared. There are times when we all just sit in the hallway and play games.” This teacher also described the feeling as “homey.” The teachers indicated that a relationship between them exists beyond the classroom; meeting for dinner or other non-school events commonly occurs.
Observer perceptions support these reports. This group of teachers appears to be very united. During district-wide events, they commonly remain as a small group during leisure time or group activities. There appears to be a bond between them and they seem very comfortable together.
Assessing responses on the OHI for this dimension, teachers responded to items such as,
“Teachers in this school like each other,” “Teachers in this school exhibit friendliness to each other,” and “Teachers express pride in their school,” most commonly with “often occurs.” A number of responses were endorsed as “very often occurs” with only a few as “sometimes occurs.” Overall, based on OHI responses, it appears that teachers from School B feel very strongly regarding their level of affiliation and pride for their school.
Teachers from School A reported that, in general, individuals are kind to one another, professional, willing to work together, and working towards common goals. One teacher stated,
“We all have common goals. Everyone is kind to each other for the most part…we act professionally.” However, some teachers did indicate the presence of certain groups of
individuals not working toward the common goal. One teacher said, “Certain groups don’t work well together.” Another said, “There are different dynamics and personalities and a sense of competition between some teachers.” Another interesting response that occurred addressed the overall lack of interaction that happens in the building. One teacher indicated that she is only close with a few individuals and that “there are many (teachers) that I don’t know very well.”
Another said, “You don’t see everyone on a daily basis. I can go all year without seeing some people.”
Assessing responses on the OHI for this dimension, teachers responded to previously noted items most commonly with “often occurs,” while some were endorsed as “sometimes occurs.” Overall, based on OHI responses, it appears that teachers from School A feel that teachers interact well, respect one another, and take pride in their job and accomplishments.