For photocopying of material in this volume, please pay a copying fee through the Copyright Clearance Center, Inc., 222 Rosewood Drive, Danvers, MA 01923, USA. This book, or any part thereof, may not be reproduced in any form or by any means, electronic or mechanical, including photocopying, recording, or any information storage and retrieval system now known or to be invented, without permission by written by the Publisher.
PREFACE
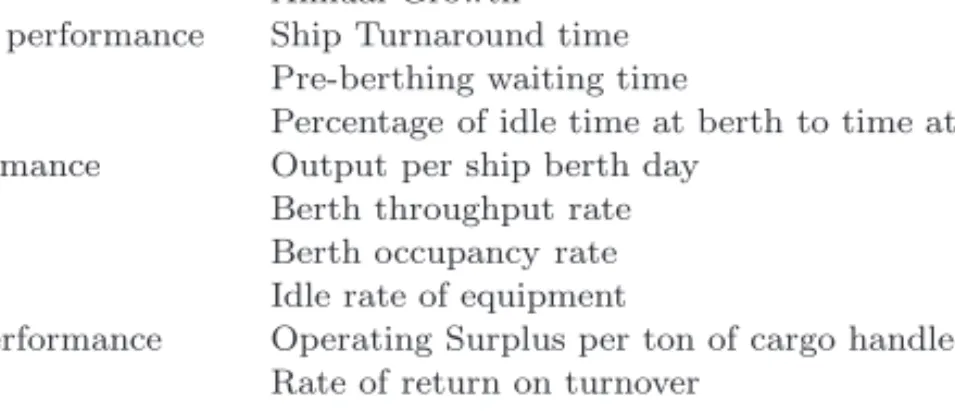
The author proposes the port throughput ratio - the ratio of cargo exchanged to the total time incurred to exchange the cargo - for measuring the output of a port. The performance evaluation strategy is developed from four dimensional criteria, i.e. the financial condition, customer satisfaction, internal processes and self-innovation.
REGIONAL DEVELOPMENTS AND PERFORMANCE ANALYSIS
MARITIME TRADE
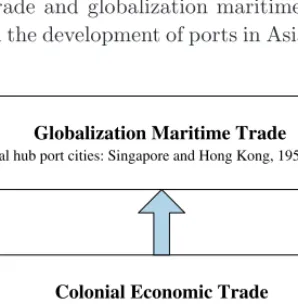
EVOLUTIONS AND PORT CITY DEVELOPMENTS IN ASIA
Introduction
Nevertheless, the development of technological infrastructure in recent decades has greatly changed the landscape of the port industry. Recognizing that the port is the main pillar in the development of a port city, we identify some of the key success factors and challenges facing major ports in Asia.
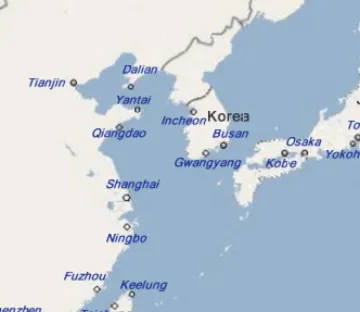
![Fig. 1 Flow of container traffic in 2007 (Millions of TEUs), source from [UNCTAD, 2008].](https://thumb-ap.123doks.com/thumbv2/123dok/10290969.0/22.1263.321.1003.167.658/fig-flow-container-traffic-millions-teus-source-unctad.webp)
Evolution of Asia’s Maritime Trade
In the nineteenth century, these port cities were integrally linked by the East India Company in Asia. Due to its geographical location, transhipments were a major part of Singapore's trade in the nineteenth century.
Asia Port Developments in the 1990s and Beyond
Osaka Port is located in the western part of the city of Osaka. Meanwhile, the Port of Tanjung Perak (also known as the Port of Surabaya City) is located on the northern coast of the island of East Java, opposite Madura.
Factors of Port Competitiveness and Development
The port handles most of Sri Lanka's foreign trade, including manufacturing exports of processed raw materials. Fleming and Hayuth, 1994], [Hayneset al., 1997], [Klink and van den Berg, 1998] and [Helling and Poister, 2000] suggested that the ability of the port to support intermodal services is an important factor in the container vehicles' choice of port of call.

Lessons to be Learnt
In addition to the port and maritime industry, the economy as a whole will also benefit from such economies of scale and collaborative efforts in the process. Another alternative to reduce environmental pollution in the port city is the development of the dry port.
Conclusions
Regional container port competition and cooperation - the case of Hong Kong and South China, Journal of Transport Geography, 10, pp.
RECENT DEVELOPMENT OF MARITIME LOGISTICS
- Development Trends on Global Container Shipping Global economic condition and industry perspectiveGlobal economic condition and industry perspective
- Liner Shipping 1. Container liners1.Container liners
- Ports
- Conclusions
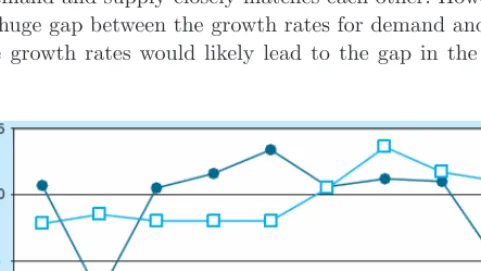
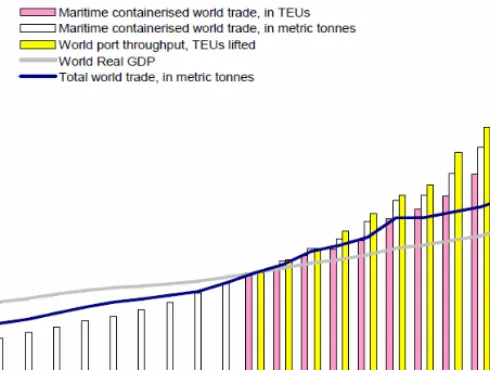
In a survey conducted in September 2009 by AMR Research, the "recovery cycle" was identified as the biggest risk in 2010. This type of terminal operator accounted for 12.2% of the total turnover by global terminal operators in 2008. The percentage of shipping volume in the total volume of containers increased from 18 percent in 1990 to 25 percent in 2005. (8) The figure below illustrates the increase in the percentage of shipping activities in the total volume of the port from 1990 to 2006.
SCENARIO ANALYSIS FOR HONG KONG PORT DEVELOPMENT
ENVIRONMENT
Literature Review
The results suggested that Hong Kong and Pusan benefited from inter-port competition in the region from 1970 to 2001. Sensitivity analysis was conducted to understand the impacts of uncertainties on the exchange rate and market demand. Unfortunately, these models cannot be easily adapted to the relocation decisions of PTEs in the PRD region.
Changing Business Environment for HKP
The further establishment of labour-intensive and energy-intensive PTEs is discouraged in the PRD region (GPRD Business Council 2006). Most of these areas are within a 3-hour drive of the seaports in the PRD region. The move to these areas will maintain connectivity with existing industrial clusters in the PRD region.

A MIP Model
RMCf Raw material cost per unit of production at facility yf CRCf Unit capacity maintenance cost at facility yf. NPATf Net profit margin after tax at facility IDMf Days of inventory accountable to facility. IFCCfm International freight cost per unit from facility to marketm CTAXCf Corporate income tax per unit at facility.
Experimental Design 1. Experimental scenarios1.Experimental scenarios
With oil prices at $150 and $225 per barrel, Guangdong is more cost-effective due to lower transportation costs than the Pan-PRD. For example, both the appreciation of the RMB and the reduction of the VAT discount make locations in China less competitive than lower-cost locations in Asia. If the RMB appreciates another 10% against the baseline scenario, an oil price of $170 per barrel would make Mexico more competitive than lower-cost countries in Asia.
Conclusions and Future Work
This will have practical benefits for Hong Kong's port and economy. Latest developments and strategies of the processing activities of Hong Kong companies in the Pearl River Delta. Cargo Throughput Forecasting for the Port of Hong Kong: Approach to the Error Correction Model, Journal of Urban Planning and Development-ASCE, 130(4), pp.
MODELS FOR PORT COMPETITIVE ANALYSIS
Port Benchmarking Models
At first glance, one possible way to measure the connectivity of a port is simply to count the number of direct connections it has to other ports in the network, ie. the number of inbound and outbound shipping services to/from that port. The model is based on several assumptions, which are presented below. i) The amount of trade demand between countries is known and deterministic. This subsection focuses on the analysis of the impact of some factors on the nine major ports mentioned in subsection 3.1.1.
Conclusion and Discussion
Most of the data used in the paper is collected from CI-online and some other resources. Evaluating the operational efficiency of major ports in the Asia-Pacific region using data wrapping analysis.Applied Economics, 40:. Measuring port efficiency using data envelopment analysis, in: Proceedings of the 9th World Conference on Transport Research, 22-27. July (Seoul, South Korea).
IS PORT THROUGHPUT A PORT OUTPUT?
- Port Production Function
- Port Operating Options
- Port Resource Function
- Container Port Output
- Port Interchange Service Measures 1. Port revenue1.Port revenue
- Conclusion
As stated in Proposition 1, the transshipment of TEU in a port is also the TEU provided by carriers to the port. The economic production function of a port exchange service relates the maximum volume of cargo exchange service provided by the port to the levels of resources used in providing the exchange service and the amount of cargo provided by carriers. Using port throughput as a measure of port production (or dependent variable) in the economic production function of the port exchange service: (1) the economic production function of the exchange service no longer exists and (2) the long-run economic total cost of the port and the short-run current economic variable cost function are not possible to derive.
A FRAMEWORK FOR MODELLING AND
BENCHMARKING MARITIME CLUSTERS: AN APPLICATION
OF PIRAEUS
Conceptual Definition: Cluster Theory and Maritime Clusters
In Principles of Economics, he described the phenomenon as "the concentration of specialized industries in particular localities" (Marshall, 1922). The concept of knowledge spillover and externalities were crucial elements in Marshall's theory, as he elegantly states: "The mysteries of commerce do not become mysteries, but hang in the air, so to speak" (Marshall, 1922). This article addresses the need for a theory that integrates the four factors of Porter's theory with economic values and spatial development; a system that will reveal the effect the micro level has on the macro level – the entire cluster.
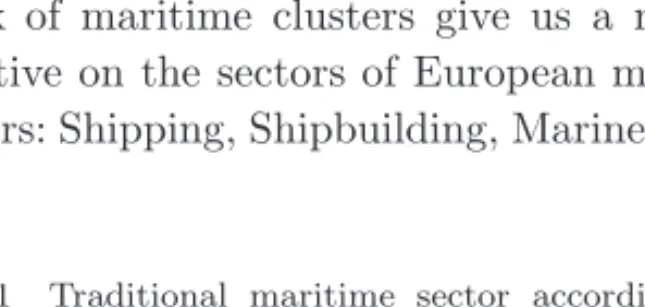
The Concept of Maritime Clusters
The European Maritime Cluster Network is one of the pioneering initiatives related to transnational maritime clustering in Europe. Therefore, the first task was the conceptual definition of the maritime cluster, i.e. the maritime cluster as such can be defined in our research as: 'The result of one or more spatial consolidations, participating — competing companies and institutions within all sectors, sub-sectors and economic activities, directly or indirectly related to the shipping industry, maritime transport and the use of the sea in general'. The purpose of this model is only to represent the core of maritime activity around which satellite services revolve and as a whole make up the universe of maritime activities - the maritime cluster.
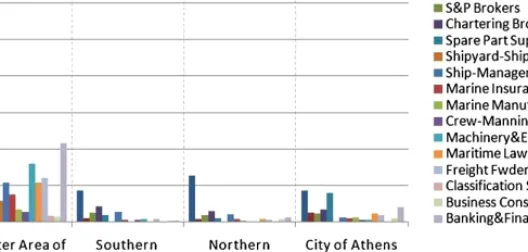
Spatial Paradigm: The Greater Area of Piraeus
The most important competitive advantages of the cluster are described and explained in Box 1 below. The shipping sector, just one segment of the maritime cluster, is a major contributor to the Greek economy. The concentration of the cluster in Attica and Piraeus accounts for 43.3% of the total maritime employment in Attica and 55% of that in the wider Piraeus area.
Methods for Evaluating and Benchmarking Maritime Clusters
The type and number of maritime sectors that exist in the cluster play an important role. They believe that there is a linear relationship between the population of firms in a cluster and the strength of the cluster. Growth Rate: Economic growth is the increase in the amount of goods and services produced by a cluster over time.
Computational Methods for Simulation and Life-Cycle Management of Maritime ClustersManagement of Maritime Clusters
These are essentially some key characteristics of the agents that are attributed by the user to measure the outcome of the simulation. For the purposes of the simulation, the population of firms in each sector is not at full scale; a sample of companies is attributed to each sector. The results of this simulation are then validated against realistic data of the existing structure of the maritime community, in Piraeus.

Conclusions
In fact, a supportive government is one of the most important criteria for cluster competitiveness. The state must develop increased understanding of the cluster and offer increased priority and support. The behavior of the private sector in Greece as we know it today must change significantly.
A PERFORMANCE
EVALUATION STRATEGY TOWARDS DEALERS IN THE
Problems of Dealer Evaluation
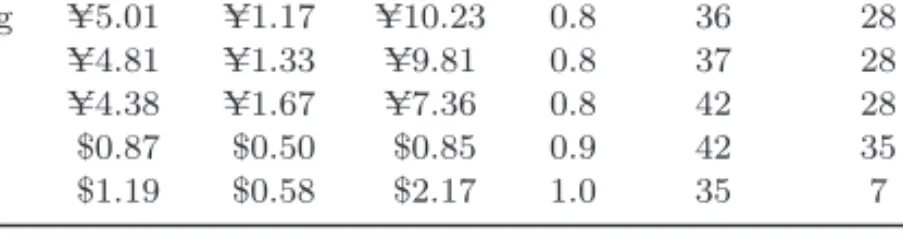
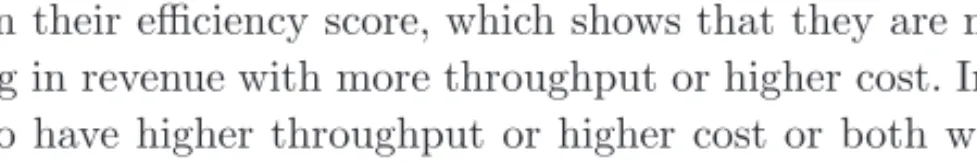
Traders' performance evaluation was traditionally emphasized on financial indices, so these indices tended to be time-lagged and could not dynamically reflect the market information. The internal business processes usually lacked evaluation and could not be objectively assessed on the operation of the supply chain. Intensive focus on new customers rather than existing customers, which can affect the retailers' sustainable sales ability.
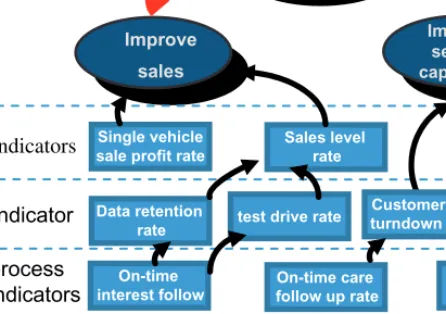
Indicators Definition for Dealers’
Data retention rates and test drives are used to measure dealers. the ability to attract new customers and close a successful sale. Bounce rates and retention rates are used to measure retailers' ability to retain old customers and maintain existing relationships. Relevant indicators include the rate of timely interest monitoring, the rate of timely follow-up care, and the rate of timely handling of complaints. a) On-time interest and follow-up rates are used to improve dealers' ability to proactively sell and service.
Case Study
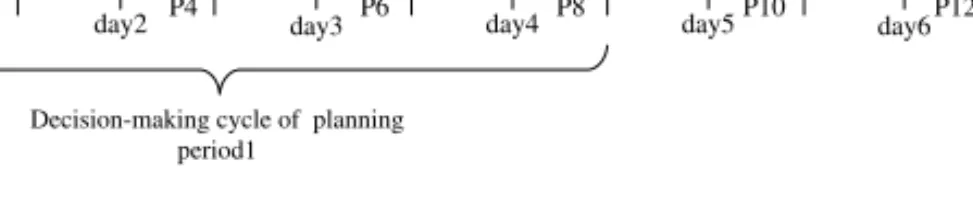
In order to detect the dealers' operational problems promptly and to consider the dealers' business turnover cycle, the evaluation period was set to 1 month, especially December 2008. In this study, a pre-market information integration model for manufacturers' and dealers' business was established. Next, the evaluation indicators for dealers' performance were speculated in terms of four aspects, namely the financial condition, customer satisfaction, process efficiency and self-innovation.
PORTS AND LINERS OPERATIONS
A YARD ALLOCATION STRATEGY FOR EXPORT
AND OPTIMIZATION
Related Work
Current research work has focused on import containers, export containers and a combination of import and export containers. Meanwhile, Yan et al.(2008) combined yard crane scheduling and yard planning for the allocation of export containers. Preston & Kozan (2001) minimized the turnaround time of container ships. 2003) proposed a site allocation model for input and output containers to balance workloads between blocks.
Yard Allocation Modeling for Export Containers 1. Problem description1.Problem description
N2ijtk The total number of 20-foot export containers allocated in the block arriving at the container terminal in period t−k;. – The total number of 20-foot export containers allocated to block it arriving at the container terminal during periodt;. – The total number of 20-foot export containers assigned to block it that arrive at the container terminal in periodt.
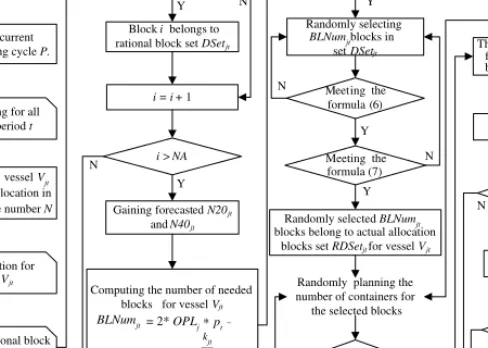
Yard Allocation Algorithm for Export Containers
This rule ensured that the handling time of all ships, whose containers are stored in the same block, does not overlap. This rule ensured that the total number of 40 foot export containers allocated in blockii was the sum of these containers allocated to all blocks in period t. This rule ensured that the available stacks of all blocks were not less than the total export containers of all ships during the period.
![Fig. 3 Evolution of ports in Asia, modified from [Lee et al., 2008].](https://thumb-ap.123doks.com/thumbv2/123dok/10290969.0/31.892.208.656.184.470/fig-evolution-ports-asia-modified-lee-et-al.webp)