C h a p t e r 2
THE “CLEAT” GEOMETRY: A NOVEL RHEOLOGICAL TOOL
2.1 Wall Slip – A Classical Problem with Implications in Biorheology ... 20
2.2 Materials and Methods... 26
2.3 Quantitative Validation ... 29
2.4 Applications in Biorheology ... 37
Bibliography ... 43
A significant portion of the text and figures in this chapter have been published by C. S.
Nickerson and J. A. Kornfield in the Journal of Rheology and are reproduced here with their permission.1
2.1 Wall Slip – A Classical Problem with Implications in Biorheology
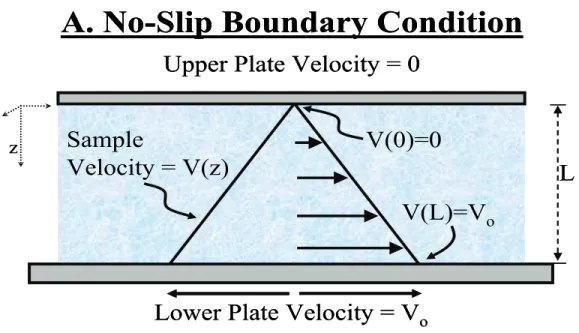
Accurate rheological characterization using rheometric flows depends critically upon the
“no-slip” boundary condition, which essentially requires that the sample adhere to the surfaces of the rheometer. Stated more specifically, the velocity of the sample at the sample boundary must be equal to the velocity of the adjacent tool surface (Figure 1) so that the deformation rate of the sample is known. Unfortunately, a wide range of materials violate this boundary condition. For example, in suspensions and emulsions (e.g., creams, lotions, and pastes) a thin “depletion” layer can form as particles/droplets migrate away from the boundary. The depletion layer forms a planar region with reduced viscosity and so the deformation becomes inhomogeneous. Polymers in solution are entropically driven away from solid boundaries; in this case, depletion layers form even in the absence of flow.
Many biological specimens slip due to the formation of lubricating layers at their surfaces. Elastomers are susceptible to slip even without lubricating fluid layers, sliding at the tool interface if there is insufficient friction.
Lower Plate Velocity = V
oSample
Velocity = V(z)
V(0)=0
V(L)=V
oUpper Plate Velocity = 0
A. No-Slip Boundary Condition
Lower Plate Velocity = V
oSample
Velocity = V(z)
A. No-Slip Boundary Condition
Upper Plate Velocity = 0
V(0)>0 V(L)<V
oUpper Plate Velocity = 0
B. Wall-Slip Boundary Violation
L
z
Lower Plate Velocity = V
oSample
Velocity = V(z)
V(0)=0
V(L)=V
oLower Plate Velocity = V
oSample
Velocity = V(z) V(0)>0 V(L)<V
oUpper Plate Velocity = 0
B. Wall-Slip Boundary Violation
L
z
Figure 1. Schematic representation of the velocity field in a sample experiencing shear deformation between parallel plates when the no- slip boundary condition holds (A) and when it is violated (B).
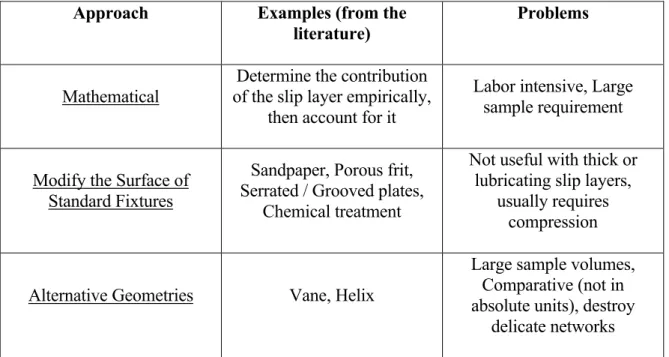
Thus, wall slip is a constant concern for rheologists working in fields ranging from biomaterials and gels to paints and industrial products to foods and personal-care items. A number of useful solutions to the wall-slip problem in its various forms have evolved for specific cases.2-9 We have divided these wall-slip prevention methods into three general approaches: mathematical methods, surface modifications, and alternative geometries (Table 1). Each method has made important contributions to the field, but each has significant limitations as explained below.
Approach Examples (from the
literature) Problems
Mathematical
Determine the contribution of the slip layer empirically,
then account for it
Labor intensive, Large sample requirement
Modify the Surface of Standard Fixtures
Sandpaper, Porous frit, Serrated / Grooved plates,
Chemical treatment
Not useful with thick or lubricating slip layers,
usually requires compression
Alternative Geometries Vane, Helix
Large sample volumes, Comparative (not in absolute units), destroy
delicate networks
Table 1. Existing approaches to the wall slip problem are listed with specific examples. Each approach has significant limitations as shown.
The first approach involves empirically or mathematically estimating the magnitude of the wall slip and accounting for its contribution to rheological measurements, as explained by Yoshimura and Prud'homme10 and Barnes.3 When possible, mathematical methods can be
very useful because they characterize wall-slip rather than simply eliminating it.
However, mathematical methods require repetitive experiments and large sample volumes, which can be prohibitive. Also, these methods are essentially perturbation analyses;
therefore, when slip dominates the material response, they are not applicable.
Another approach is to prevent slip by modifying the surfaces of standard rheological tools.
This is usually accomplished by either roughening the surfaces or by attaching a rough material such as sandpaper or serrated surfaces, although chemical modifications have also been described; examples of this are Mhetar and Archer11, Rosenberg, et al.6, and Walls, et al.9 Surface methods have been successfully applied to systems that form thin slip layers.
Unfortunately, slip can still persist with surface modified tools in many systems, particularly gels and elastomers. Also, to be effective in gels and solids (which includes nearly all biological tissues), most surface-modified tools require compression or significant normal force as described by Jin and Grodzinsky12 and Liu and Bilston13. Typical samples are compressed a minimum of 5 – 10%, which can alter the structure of the material. We observe that small compression (5%) causes the apparent modulus and properties to increase for two biological specimens (cornea and vitreous humor) and that delicate specimens, like the vitreous humor, are irreversibly damaged by compression of 10% or more, giving an artificial decrease in the apparent modulus.
The third approach to the wall slip problem is to use alternative geometries such as the vaned and helical tools recently reviewed by Barnes and Nguyen2 and Cullen, et al.4, which either prevent the formation of slip layers through mixing or measure the properties of the sample in spite of the slip layer. The flow fields in these geometries depend upon the nature
of the fluid; consequently, the measurements are comparative, rather than yielding absolute modulus or viscosity values. Most alternative geometries, particularly vaned and helical tools, are also unsuitable for delicate samples that are altered by loading into a highly non-uniform gap.
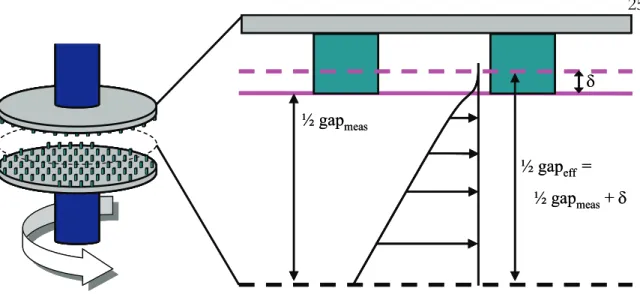
We present a novel “cleat” test geometry that overcomes many of the limitations mentioned above (Figure 2). The geometry is a modified parallel plate tool with a large number of uniform protrusions, or “cleats”, extending from the faces of the plates. A key feature of the new tool is the constant cleat length (Lc, distance from plate face to cleat tip). The significance of uniformity is that the cleat tips create a well-defined plane within the sample that is parallel to the plate face. Motion of fluid between the cleats is restricted and decays to zero a short distance (δ) into the tool. The depth at which fluid motion is stopped establishes the effective sample gap boundary. The position of this effective sample boundary was found to be independent of the material over the wide range of materials examined. The penetration depth δ can be estimated from the geometric parameters of the cleats and verified empirically, as will be discussed below. The only procedural difference between cleat geometry and smooth plate experiments is the use of the effective sample gap (gapeff = gapmeas + 2 • δ) rather than the measured sample gap (gapmeas).
½ gapmeas
½ gapeff=
½ gapmeas+ δ δ
½ gapmeas
½ gapeff=
½ gapmeas+ δ δ
Figure 2. Schematic representation of two cleated fixtures placed opposite each other. Sample motion penetrates only a short distance δ into the cleat array. The actual cleat density is high: approximately 100/cm2.
The effective sample gap is estimated by treating the array of cleats as a porous medium and determining the flow field within it. From measurements of the in-plane, pressure- driven flow through an array of cleats analogous to the tool, the permeability of the cleat geometry was determined using Darcy’s law (k = 8.7 x 10⁻¹⁰ m2). Flow of Newtonian fluids over porous media has been analyzed extensively, starting with the work of Beavers and Joseph14 and Neale and Nader,15 who showed that the resulting motion of fluid within the porous medium is attenuated over a short distance that is related to the permeability k (δ ∝ k1/2) and is independent of the viscosity of the fluid. In highly porous media such as the cleat geometry, Neale and Nader15 predict an exponential velocity decay profile such that the fluid velocity in the porous region will be reduced to < 1% of the boundary velocity when δ ~ 5 • k1/2 (~ 150 μm in the present cleat geometry). Since the attenuation depth is
insensitive to fluid properties, the value of δ for Newtonian fluids provides a good approximation for viscoelastic materials as well.
The present study demonstrates the accuracy and utility of the cleat geometry. We show that this unique geometry for slip prevention accommodates small sample volumes and allows direct measurement of shear modulus using a gentle loading procedure and negligible normal force. Results obtained with the cleated tools are compared with those obtained using smooth and roughened parallel plate geometries. First, for fluids that do not exhibit slip, the results confirm that quantitative measurements can be obtained using a single value of the gap correction δ. The empirical value for δ based on these fluids is compared with k1/2 to evaluate the applicability of the porous medium analogy. Next we show that the tool performs well when applied to two fluids that exhibit moderate slip, and we validate the results independently using roughened plates. Finally, the power of the new geometry is illustrated by obtaining modulus measurements for porcine cornea and vitreous humor, two biological tissues that are difficult or impossible to handle successfully with prior tools. More comprehensive rheological characterization of cornea and vitreous tissue will be presented in conjunction with chemical analysis in subsequent chapters.
2.2 Methods and Materials
Four different tools were used to measure the shear moduli and viscosities of a variety of materials, from low viscosity Newtonian oils to slippery biological tissues. The primary reference tool was a smooth 25 mm titanium parallel plate test geometry. A rough tool was made by attaching fine emery cloth to the surface of a 25 mm aluminum parallel plate
geometry. Two of the cleated tools were likewise 25 mm in diameter. Cleats were machined into an aluminum disk, leaving protrusions with a square cross section 0.45 mm x 0.45 mm, evenly spaced 1.35 mm apart (center to center). Two Lc values were used: 0.6 mm and 1.3 mm. A second set of smooth, rough, and cleated tools with 0.6 mm cleats and 8 mm diameters were used for measurements on cornea. In addition, a vaned fixture and porous plates were used when roughened plates failed (on vitreous humor), but they were unsatisfactory. The 25 mm tools were mounted on an ARES-RFS fluids rheometer, while the 8 mm tools were mounted on an AR2000 rheometer (both from T.A. Instruments, Inc., New Castle, DE) with sample gaps ranging from 2.25 mm to 0.3 mm. The in-plane permeability of the cleated tools was measured by Porous Materials, Inc. (Ithaca, NY).
Four of the test fluids were selected specifically because they are not prone to slip: a series of three silicone oils, (η = 10, 1.0, and 0.1 Pa·s respectively) and GE Silicones SE-30 polydimethylsiloxane (PDMS) putty (Waterford, NY). The 10 Pa·s fluid was methyl silicone oil purchased from Nye Lubricants, Inc. (New Bedford, MA); the 1.0 and 0.1 Pa·s oils were silicone viscosity standards from Brookfield Engineering Laboratories, Inc.
(Middleboro, MA). In experiments on these fluids the upper tool was cleated and the lower surface was smooth. Using a smooth lower plate allowed us to validate the cleats at large sample gaps with low viscosity fluids. Each fluid was tested at least three times per sample gap at 22° C and multiple shear rates (1 – 80 s-1) or frequencies (10-1 – 102 rad/s); the PDMS putty was tested in the linear viscoelastic regime (γ = 0.2%).
To demonstrate the utility of the cleated geometry for samples that slip, two food products and two biological tissues were characterized using smooth, rough, and cleated tools (both
upper and lower fixtures). The foods used were Kroger brand “Real Mayonnaise”
(Kroger Co., Cincinnati, OH), an oil in water emulsion, and Winn-Dixie brand “Creamy Peanut Butter” (Winn-Dixie Stores, Inc., Jacksonville, FL), a suspension, both of which exhibit slip on smooth tools. Samples were tested at least three times at 5° C and multiple shear rates (10-2 – 10 s-1). The biological tissues were fresh porcine eyes (< 36 hours post mortem, stored at 5° C in physiological saline prior to arrival) were acquired through Sierra for Medical Science (Santa Fe Springs, CA). All pigs were 3 – 6 month old Chester Whites, weighing 50 – 100 kg and in good health at the time of slaughter. Cornea is a slip- prone biological elastomer with a complex network structure, as will be discussed in subsequent chapters. The vitreous humor is an example of a delicate hydrogel that exhibits slip even on rough tools. Eyes from 3 – 6 month old swine were enucleated immediately after the animals were sacrificed and shipped at ~ 5˚ C in physiological saline. Fresh eyes were gently dissected between 24 and 36 hours post mortem (no cornea or vitreous degradation is seen within ~ 48 hours when the eye is maintained in Dulbecco’s phosphate buffered saline at 5° C), and the vitreous was removed with minimal disruption, leaving the cornea for parallel analysis. From the intact vitreous, a disc-like section approximately 25 mm in diameter was cut with the axis of the disc coinciding with the anterior-to-posterior axis of the eye (typically 1.5 – 2.5 g). 8 mm discs were cut from the central cornea (n ≥ 4 for each tool). To mitigate the effects of drying, a vapor trap was used in all experiments.
Vitreous time-dependent shear modulus measurements were made at 20° C with zero normal force on the samples at a fixed strain and frequency (γ = 3%, ω = 10 rad/s), while variable stress, fixed frequency cornea (5° C) measurements were made at σ = 1 – 30 Pa, ω
= 1 rad/s. More extensive rheological analysis of these materials will be presented in subsequent chapters.
2.3 Quantitative Validation
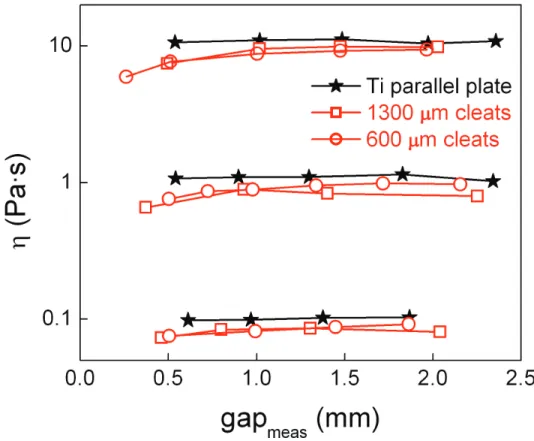
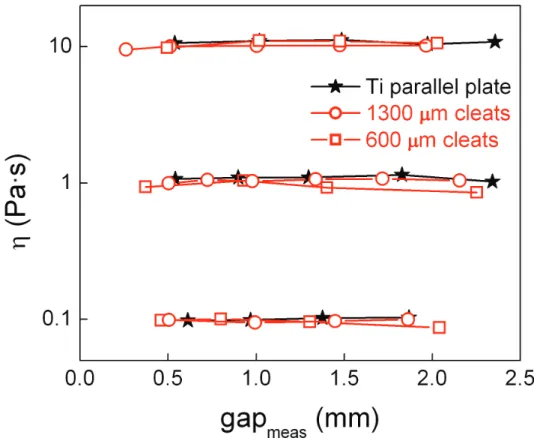
Newtonian Oils: The viscosities of three silicone oils were measured with the smooth parallel plate geometry and with one of the parallel plates replaced by a cleated tool. Two different cleat lengths (600 μm and 1300 μm) were compared. At least four different sample gap values were tested for each tool configuration. For smooth tools, the measured viscosity is independent of gap (Figure 3). The viscosity obtained with cleated tools is insensitive to gap thickness when gapmeas ≥ 1 mm, indicating δ << 1 mm. The results are also insensitive to cleat length (cf. Lc = 0.6 and 1.3 mm), which indicates δ < 600 μm, in accord with the porous-medium prediction of δ ~ 150 μm.
Figure 3. The viscosity of three Newtonian oils was measured at multiple gaps with two cleated tools and compared with measurements made with a smooth titanium plate. At small gaps cleat geometry values diverge from smooth plate values.
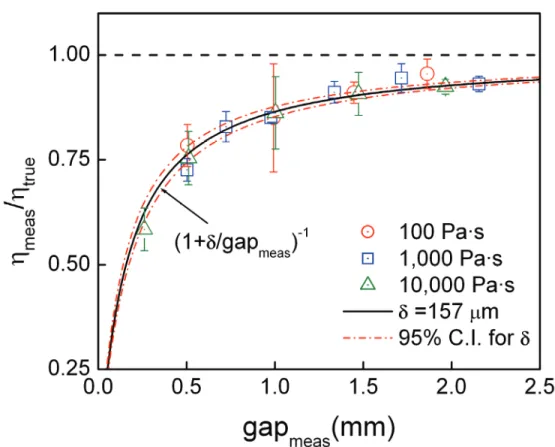
Experimentally-determined correction values also compare favorably with predictions.
Based on the porous-medium analogy, the gap-dependent disparity between viscosity measurements from smooth (ηtrue) and cleated tools (ηmeas) is predicted to be:
(
δ)
η η
= +
meas meas
true
meas gap gap
Note that δ would be replaced by 2 • δ if both faces were cleated rather than just the upper tool. This expression accords well with the experimental results as a function of gap
(Figure 4). A single value of δ holds for all three Newtonian oils. Non-linear least squares fitting of
true measη
η to 1 −1
⎟⎠
⎜ ⎞
⎝⎛ + gapmeas
δ yields an empirical value of δ = 157 μm
(95% CI = 141 – 173 μm), in remarkably good agreement with the predicted value above.
Application of the 157 μm correction factor to the Newtonian oil data (Figure 3) demonstrates the accuracy of δ Figure 5.
Figure 4. Viscosity measured using the cleat geometry divided by true viscosity, measured by the smooth plates. The solid curve shows the predicted gap dependence (1+ δ / gapmeas)-1 with a value of δ = 157 μm. Dashed curves bound the 95% confidence interval (141 μm < δ < 173 μm).
Figure 5. The cleat geometry viscosity data from Figure 3 plotted after gap correction with δ = 150 μm. Accurate measurements are obtained at all gaps and viscosities when the gap is accounted for correctly.
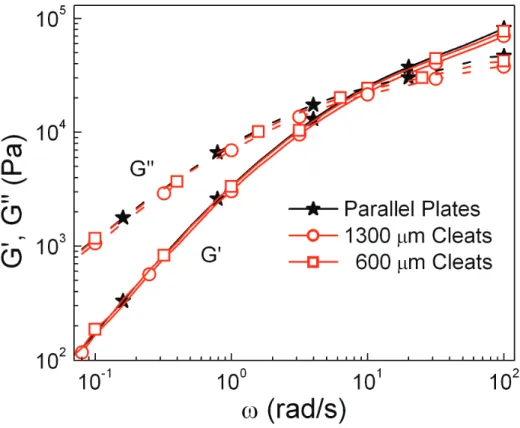
PDMS Putty: The uncorrected storage and loss moduli of PDMS putty (ηo > 104 Pa • s) measured with the two cleated tools were consistently lower than those measured using the smooth parallel plates; however, the 157 μm correction factor brings the cleat measurements within 1% of the parallel plate results (Figure 6). G′ and G′′ measurements were accurate over the three decades of frequency examined, and the gap dependence matched that of the Newtonian oils. Thus, δ appears to be independent of material
properties for a wide range of soft materials and fluids, including a complex fluid, as anticipated from the porous medium analogy.
Figure 6. Gap corrected shear moduli of PDMS putty measured with the cleat geometry are within 1% of values obtained using a titanium parallel plate over three decades of frequency and modulus (γ = 0.2%, gapmeas = 2 mm).
The experimental results for Newtonian oils support our hypothesis that the cleats create an effective no-slip boundary that is close to the plane of the cleat tips. Furthermore, the observation that the ratio of the apparent viscosity observed using cleated tools, ηmeas, to actual viscosity, ηtrue, is independent of the viscosity of the fluid accords with a model that
treats the array of cleats as a porous medium. The attenuation distance δ = 157 μm inferred from the ratio of
true measη
η is similar to 5 • k1/2 determined independently. The
experimental observation that the correction factor determined for a series of Newtonian fluids also applies for a viscoelastic fluid (an entangled polymer melt, Figure 6) over a frequency range that spans from near terminal behavior (G′ < G′′) to elastic behavior (G′ >
G′′) suggests that the attenuation depth continues to be governed by the geometry of the cleat array even for some non-Newtonian fluids.
The gap dependence of ηmeas is reminiscent of slip phenomena; however, the fluid independence of the value, combined with the improbability of slip with the samples chosen, demonstrate that δ represents a true sample gap boundary—not a slip length. The cleat geometry creates a secondary boundary at a distance δ below the cleat tips where the no-slip condition effectively holds. The dependence
1
1
−
⎟⎠
⎜ ⎞
⎝⎛ +
=
meas true
meas δ gap
η η
corresponds to the “apparent gap” effect noted by Sanchez-Reyes and Archer.8 We have shown that an empirical δ can be inferred that appears to be accurate for the samples investigated and is consistent with the observed dependence of ηmeas on gapmeas down to the smallest gap tested (gapmeas ≈ 2 • δ).
Optimization of the cleat parameters (height, width, length, and spacing) involves a trade off between minimizing the attenuation length and minimizing the disruption of the sample.
Therefore, one can decrease δ by reducing k through an increase in the area of the cleated surfaces per unit area of the tool. However, increasing the cross-section of each cleat or the
cleat surface density hinders penetration into samples such as gels, elastomers, and biological tissue. The specific parameters of the cleat array we describe have the advantage that only 11% of the nominal surface area (area relevant to penetration) of the disk is occupied by the cleats themselves. This arrangement of well-spaced “pins” readily penetrates diverse complex fluids and certain soft solids. As stated previously, the permeability k of the cleat arrangement determines δ, which subsequently dictates the minimum value of Lc. Based on the findings of Sanchez-Reyes and Archer, the optimal length scale of the surface features will decrease as the modulus range of interest increases.8 They observed that with increasing polymer concentration, i.e., decreasing size of entangled blobs, the optimal sizes of surface features decreases.
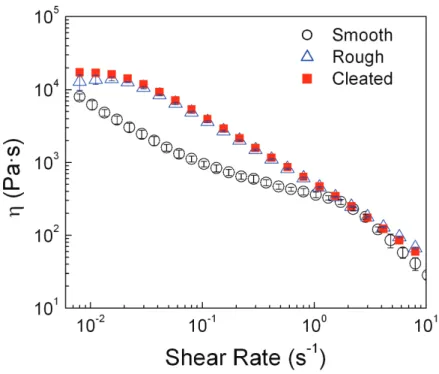
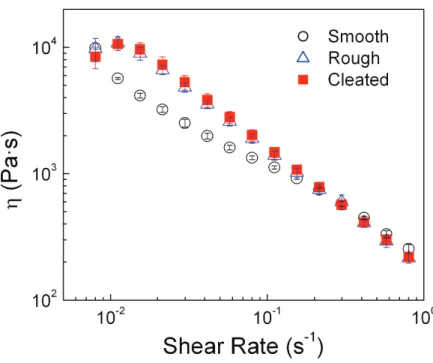
Peanut Butter and Mayonnaise: To validate that the cleat geometry is also accurate in moderately slip-prone systems, we compare results obtained for a model suspension and a model emulsion to results obtained using published methods. The viscosity of peanut butter (Figure 7) and mayonnaise (Figure 8) were measured using smooth, rough, and cleated tools at gapmeas = 2 mm. Prior literature, including work by Citerne, et al.16 and Franco, et al.17, shows that roughened plates are adequate to suppress slip for both of these complex fluids. Peanut butter, a typical suspension, and mayonnaise, an oil-in-water emulsion, both exhibit slip at low shear rates on smooth plates, giving apparent values of η considerably smaller than values measured with rough plates. The measured viscosity of both samples was essentially the same with cleated or roughened plates. Apparently, the characteristic feature sizes of both tools were larger than the thin depletion layers that cause slip. On a practical note, it was observed that, relative to emery cloth and porous glass, the cleated
tools were far easier to clean and more robust against physical damage, solvents, and high temperatures.
Figure 7. The corrected viscosity of peanut butter measured with cleated and rough plates. Smooth plates show slip at low shear rates (gapmeas = 2 mm).
Figure 8. The corrected viscosity of mayonnaise measured with cleated and rough plates. Smooth plates show slip at low shear rates (gapmeas = 2 mm).
2.4 Applications in Biorheology
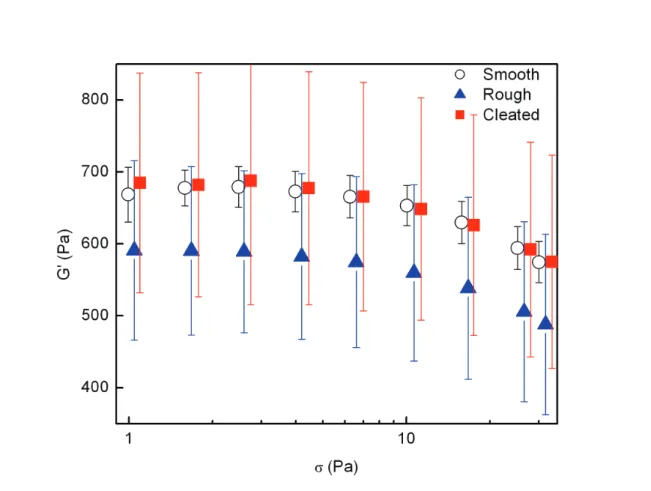
Cornea: Results obtained from cornea specimens demonstrate the utility of the cleat geometry for soft elastomeric materials. Corneal tissue is a valuable example in this regard because it can be characterized on smooth tools for comparison with results obtained in cleated tools. Immediately after dissection, corneal tissue is slippery and remains so even after the epithelial cell layer is removed. Fortunately, if the surfaces are briefly put in contact with an absorbent material, the surface is no longer slippery. There is negligible weight change (< 3%) in the process, so the viscoelastic properties of the tissue closely approximate the tissue in vivo. Thus, we regard results from the smooth tools as an accurate reference against which other tool surfaces can be compared. Gap-corrected shear modulus
measurements from the cleat geometry agree quantitatively with measurements obtained with smooth tools (Figure 9). The standard deviation (for n = 4) is, unfortunately, much greater on cleated tools than on smooth tools. This suggests a direction for future research:
evaluation of the effect of cleat size relative to tool size. For example, on an 8 mm tool there are only 35 – 40 cleats, so that from one sample loading to the next, details of loading and azimuthal orientation of tools could lead to significant variations.
Figure 9. Gap corrected shear modulus of fresh porcine cornea at fixed frequency (w = 1 rad/s) and 5° C using smooth, roughened, and cleated tools. Tools were lowered until ~ 0.1 N of normal force was detected, then the sample was allowed to relax completely and tested (n = 4).
Values obtained with roughened tools are systematically too low (Figure 9). This comparison is made using the same normal force in all three cases, with a normal force small enough that the tissue is not damaged. Cornea samples were loaded by slowly lowering the upper fixture until the normal force was ~ 0.1 N. The normal force decayed to zero within seconds. Small amplitude oscillatory shear was used to observe relaxation of the sample to a steady state (~ 15 minutes was sufficient) and then measurements were made. This loading technique was sufficient to generate good contact between the smooth tool and the cornea and to allow adequate penetration by the cleats. However, in accord with prior literature, such low normal force is insufficient to allow the irregular surface features of the roughened tool to fully “grip” the sample. This demonstrates a significant advantage of the cleats over roughened tools – adequate measurements can be made using negligible normal force.
Vitreous Humor: Results obtained from the vitreous humor of the eye demonstrate the utility of the cleat geometry for more difficult samples. Previous efforts to measure the mechanical properties of the vitreous, including work by Bettelheim and Wang,18 Lee, et al.,19 Pfeiffer,20 Tokita, et al.,21 and Zimmerman,22 have yielded unsatisfactory and sometimes conflicting results. The shear moduli of this delicate tissue were also impossible to measure using previously published geometries in our laboratory (Figure 10). Smooth plates slipped drastically, and roughened plates were insufficient because slip was not consistently prevented (as denoted by the large standard deviation). While some vitreous samples appeared to be measured accurately on the rough fixtures, other loadings appeared to fail (slip) from the first data point, yielding results similar to those obtained with the
smooth tools. The normal force required to obtain measurements with roughened tools artificially raised the apparent modulus in the initial data points. Over the course of a typical experiment, the apparent modulus decreased with the normal force as fluid was squeezed out of the tissue. In conjunction with fluid loss, a thick lubricating layer formed within five minutes, making it impossible to eliminate slip using roughened plates. In previous efforts to measure the modulus of the vitreous, the use of porous plates failed for the same reasons as roughened plates. The vane geometry was unsuitable because it destroyed the gel network and sample volume is limited to the size of a single eye.
Figure 10. The corrected shear modulus of freshly-enucleated vitreous humor measured with the cleat geometry is far more consistent than rough plates and clearly more accurate than smooth plates (g = 3%, w = 10 rad/s, n = 9).
Using the cleat geometry, these obstacles appear to have been overcome and consistent shear moduli were measured. The modulus values measured with the cleat geometry are slightly greater than those obtained with roughened tools, but the most obvious improvement is the reduction in standard deviation (Figure 10). Comparing results obtained using the cleat geometry with literature values obtained using other methods suggests that the shear moduli of the vitreous are significantly higher than reported in the works mentioned above. The cleat geometry has also allowed us to quantify time-dependent modulus changes that were previously reported only as qualitative observations.
Results from the vitreous humor demonstrate some advantages of the cleat geometry.
Highly-charged hyaluronic acid (HA), which draws water into the vitreous in vivo, seeps out of the vitreous when it is removed from the eye. The HA solution that blooms to the surface is a very efficient lubricant, similar to the synovial fluid that lubricates the joints.
This HA solution causes the wall slip observed even on very rough surfaces such as sandpaper and porous plates. Note that the successful modeling of cleats as porous media does not imply that porous surfaces work as well as cleats: they do not. The advantage of using cleats over standard porous materials such as fritted disks is that the cleats protrude orthogonally from the tool face and engage the sample.
There is an important, transient decrease in modulus that occurs spontaneously after the vitreous is removed from the eye, captured in measurements using the cleat geometry. It is not possible to characterize this transient behavior using roughened plates due to the need to apply a substantial normal force; the strong effects of compression mask the natural decay. Thus, the cleat geometry is uniquely capable of measuring the time-dependent
changes in this sample, which is too slippery and fragile to be measured accurately using previously published methods. Because prior mechanical investigations of the vitreous are unsatisfactory, we have no way to independently verify the accuracy of our modulus values. The sample dictates the gap and is destroyed by compression; therefore, the usual procedure to test for slip (varying sample geometry) cannot be applied. The values we report represent a lower bound: potential sources of error in the cleat geometry (wall slip, insufficient surface contact, or increased flow between the cleats) would reduce the apparent modulus. We observed that near the tools heterogeneities in the tissue moved with the tool surface; therefore, we believe that the above errors are small.
The modulus values here pertain to the central vitreous, the bulk of the tissue. The work of Lee, et al. suggests that different moduli would characterize the tissue near the anterior pole (stiffer).19 Regional variations in tissue properties will be discussed in conjunction with more complete rheological and structural analyses presented in subsequent chapters.
BIBLIOGRAPHY
1. Nickerson CS, Kornfield JA. A "cleat" geometry for suppressing wall slip.
Journal of Rheology. 2005;49.
2. Barnes HA, Nguyen QD. Rotating vane rheometry - a review. Journal of Non- Newtonian Fluid Mechanics. Mar 15 2001;98(1):1-14.
3. Barnes HA. A Review of the Slip (Wall Depletion) of Polymer-Solutions, Emulsions and Particle Suspensions in Viscometers - Its Cause, Character, and Cure. Journal of Non-Newtonian Fluid Mechanics. Mar 1995;56(3):221-251.
4. Cullen PJ, O'Donnell CP, Houska M. Rotational rheometry using complex geometries - A review. Journal of Texture Studies. Apr 2003;34(1):1-20.
5. Klein B, Laskowski JS, Partridge SJ. A New Viscometer for Rheological Measurements on Settling Suspensions. Journal of Rheology. Sep-Oct 1995;39(5):827-840.
6. Rosenberg M, Wang Z, Chuang SL, Shoemaker CF. Viscoelastic Property Changes in Cheddar Cheese During Ripening. J. Food Sci. MAY-JUN 1995 1995;60(3):640-644.
7. Russel JL. Studies of thixotropic gelation. Part II. The coagulation of clay suspensions. Proc. Roy. Soc. London, Series A. 1936;154:550-560.
8. Sanchez-Reyes J, Archer LA. Interfacial slip violations in polymer solutions:
Role of microscale surface roughness. Langmuir. Apr 15 2003;19(8):3304-3312.
9. Walls HJ, Caines SB, Sanchez AM, Khan SA. Yield stress and wall slip phenomena in colloidal silica gels. Journal of Rheology. Jul-Aug 2003;47(4):847- 868.
10. Yoshimura A, Prud'homme RK. Wall Slip Corrections for Couette and Parallel Disk Viscometers. Journal of Rheology. JAN 1988 1988;32(1):53-67.
11. Mhetar V, Archer LA. Slip in entangled polymer melts. 2. Effect of surface treatment. Macromolecules. Dec 1 1998;31(24):8617-8622.
12. Jin MS, Grodzinsky AJ. Effect of electrostatic interactions between
glycosaminoglycans on the shear stiffness of cartilage: A molecular model and experiments. Macromolecules. Nov 6 2001;34(23):8330-8339.
13. Liu Z, Bilston L. On the viscoelastic character of liver tissue: experiments and modelling of the linear behaviour. Biorheology. 2000;37(3):191-201.
14. Beavers GS, Joseph DD. Boundary Conditions At A Naturally Permeable Wall. Journal Of Fluid Mechanics. 1967;30:197-207.
15. Neale G, Nader W. Practical Significance of Brinkman's Extension of Darcy's Law: Coupled Parallel Flows within a channel and a Bounding Porous
Medium. Can. J. Chem. Eng. August 1974 1974;52:475-478.
16. Citerne GP, Carreau PJ, Moan M. Rheological properties of peanut butter.
Rheol. Acta. JAN 2001 2001;40(1):86-96.
17. Franco JM, Gallegos C, Barnes HA. On slip effects in steady-state flow measurements of oil-in- water food emulsions. Journal of Food Engineering. Apr 1998;36(1):89-102.
18. Bettelheim FA, Wang TJY. Dynamic Viscoelastic Properties of Bovine Vitreous. Experimental Eye Research. 1976;23(4):435-441.
19. Lee B, Litt M, Buchsbaum G. Rheology of the vitreous body: Part 2.
Viscoelasticity of bovine and porcine vitreous. Biorheology. Jul-Aug 1994;31(4):327-338.
20. Pfeiffer HH. Zur analyse der fliess-elastizitaet durch spinnversuche am corpus vitreus. Biorheology. 1963;1:111-117.
21. Tokita M, Fujiya Y, Hikichi K. Dynamic viscoelasticity of bovine vitreous body. Biorheology. 1984;21(6):751-756.
22. Zimmerman RL. In Vivo Measurements of the Viscoelasticity of the Human Vitreous-Humor. Biophysical Journal. 1980;29(3):539-544.