Indiana University Center for Health Policy School of Public and Environmental Affairs Indiana University-Purdue University Indianapolis 334 N. Professor and Director, Center for Health Policy School of Public and Environmental Affairs Indiana University–Purdue University Indianapolis.
I NTRODUCTION
D ATA H IGHLIGHTS
ALCOHOL
Binge Drinking
Heavy Drinking
Youth Consumption — Underage Drinking
Alcohol Abuse and Dependence
Morbidity and Mortality
Motor Vehicle Crashes
Legal Consequences
TOBACCO
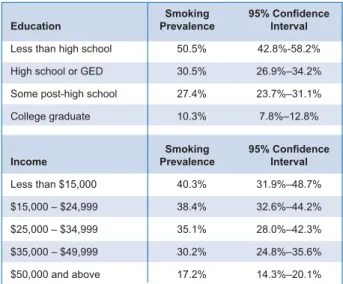
Smoking prevalence among adults (18 years and older) in Indiana (26.0%) was the sixth highest in the nation and significantly greater than the US.
Youth Consumption
The age-adjusted annual tobacco-attributable death rate (per 100,000 population) was higher among Hoosiers (308.9) than the rest of the country (263.3) (Centers for Disease Control and Prevention, n.d.).
MARIJUANA
Marijuana Abuse and Dependence
COCAINE
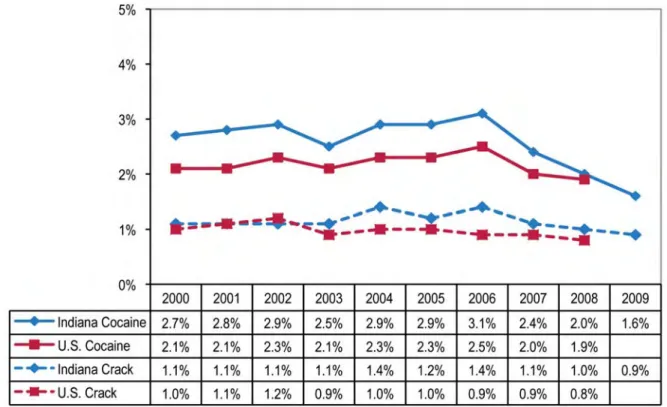
Data from 2000 to 2008 showed that rates of current cocaine and crack use among high school students in Indiana and the state appeared to be similar. However, the significance of the results could not be determined (Indiana Prevention Resource Center, 2009; Intercollegiate Policy and Social Research Consortium, University of Michigan, n.d.).
Cocaine Abuse and Dependence
Past-year cocaine use among 12- to 17-year-olds was statistically similar in Indiana and the United States (IN: . 1.41%; US: 1.57%) (Substance Abuse and Mental Health Services Administration, Office of Applied Studies, n.d. ). However, the significance of the results could not be determined (Indiana Prevention Resource Center, 2009; Inter-university Consortium for Political and Social Research, University of Michigan, n.d.). and 0.38 per 1,000 population respectively) (National Archive of Criminal Justice Data, Inter-university Consortium for Political and Social Research, University of Michigan, n.d.).
HEROIN
However, statistical significance could not be determined (Indiana Prevention Resource Center, 2009; Intercollegiate Consortium for Political and Social Research, University of Michigan, n.d.).
Heroin Abuse and Dependence
METHAMPHETAMINE
Youth Consumption Patterns
Methamphetamine Abuse and Dependence
PRESCRIPTION DRUG ABUSE
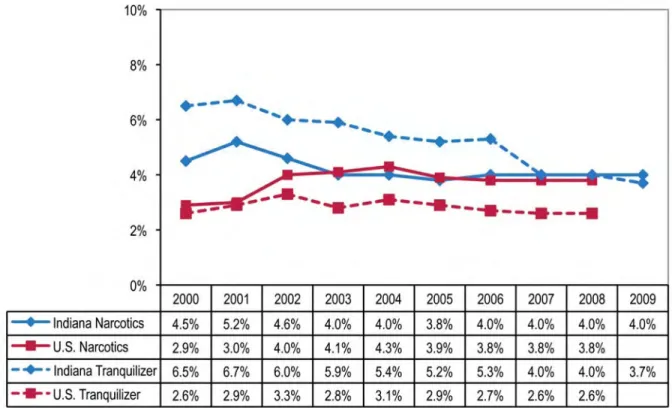
Indiana data on current drug use show that among 12th grade students, 4.0% reported drug use, 3.7% reported use of tranquilizers, and 3.1% reported use of Ritalin®/Adderall® (see Figure 1.4). Nonmedical use of these substances remained stable or decreased among Indiana students from 2008 to 2009 (Indiana Prevention Resource Center, 2009).
Prescription Drug Abuse and Dependence
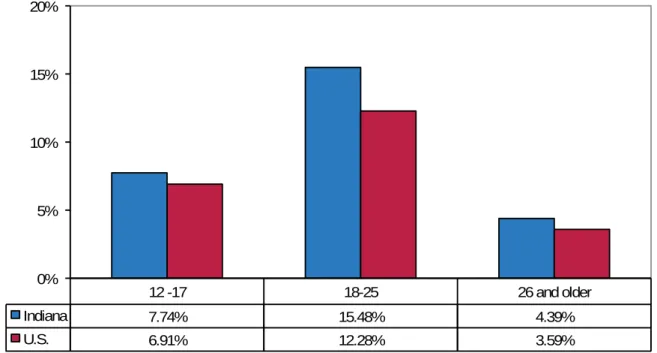
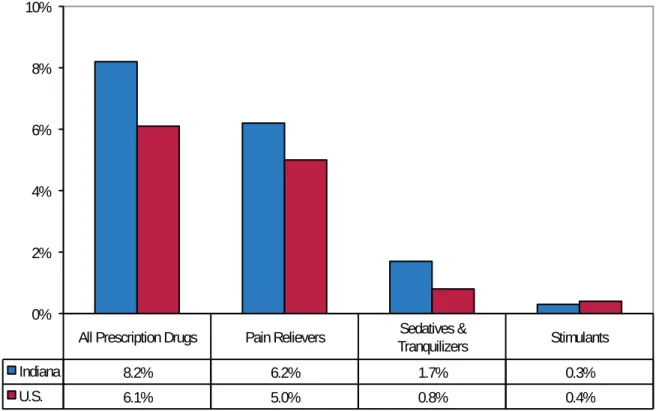
Indiana's prevalence in that age category, 15.48%, was significantly higher than the nation's 12.28% (Substance Abuse and Mental Health Services Administration, n.d.). Compared to the nation, Indiana's rates were significantly higher for overall dependence on prescription drugs, pain relievers, and sedatives, but dependence on stimulants was similar.
POLYSUBSTANCE ABUSE
Rates of prescription drug dependence increased significantly in Indiana between 2000 and 2007, remaining stable only for stimulants (Substance Abuse and Mental Health Data Archive, 2008). In 2007, Indiana law enforcement made more than 2,700 arrests for possession and nearly 700 arrests for sale/manufacture of “other drugs.”
This report describes drug use and patterns of drug consequences for Indiana residents in general and specifically for adults (residents 18 and older) and youth (residents under 18). Statistical significance is a mathematical concept used to determine whether differences between groups are real or due to chance.
DATA SOURCES
We statistically compared the overall patterns of Indiana adults and youth with patterns of consumption and consequences found across the United States. Specific patterns of drug use and consequences that placed Indiana statistically significantly higher than the United States were used as markers for areas that could potentially benefit from intervention.
Alcohol-Related Disease Impact (ARDI) Database
Based on discussions with the State Epidemiology and Outcomes Workgroup (SEOW) and the Advisory Council for the Strategic Prevention Framework State Incentive Grant (SPF SIG), we reviewed patterns of consumption and consequences for the following drugs: alcohol, tobacco, marijuana, cocaine, heroin, methamphetamine, and prescription drugs . Where possible, we made statistical comparisons across gender, race, and age groups for both drug use behaviors and drug use outcomes.
Alcohol, Tobacco, and Other Drug Use by Indiana Children and Adolescents (ATOD)
M ETHODS
For national studies that do not have publicly available datasets, we performed statistical analyzes using online analysis software and/or analysis tables provided by the agencies that performed the data collection. The ATOD study results can be compared with results from the Monitoring the Future study (see page 19) conducted by the National Institute on Drug Abuse.
Behavioral Risk Factor Surveillance System (BRFSS) Survey
With these two datasets, comparisons between Indiana and the nation can only be made for students in 8th, 10th, and 12th grades. While the ATOD provides local and regional consumption information on a wide range of substances, the results should be interpreted with caution as the ATOD survey uses a non-random convenience sample1 of Indiana college students.
Fatality Analysis Reporting System (FARS) and Automated Reporting Information
Hospital Discharge Data
Indiana Household Survey on Substance Abuse
The SRC conducted the survey by telephone, using a random landline number sample supplemented by a mobile phone sample. The survey undertook sampling of all 20 communities funded by the SPF SIG to provide accurate estimates in these districts.
Monitoring the Future (MTF) Survey
These measures are intended to help SPF SIG-funded communities set performance goals and evaluate program results. However, due to an inadequate response among youth aged 12 to 17, reliable estimates only exist for adults aged 18 and over.
National Clandestine Laboratory Seizure System (NCLSS)
National Survey on Drug Use and Health (NSDUH)
National Vital Statistics System (NVSS) and Indiana Mortality Data
National Youth Tobacco Survey (NYTS) and Indiana Youth Tobacco Survey (IYTS)
Smoking-Attributable Mortality, Morbidity, and Economic Costs (SAMMEC)
Treatment Episode Data Set (TEDS)
Uniform Crime Reporting Program (UCR)
Youth Risk Behavior Surveillance System (YRBSS)
Student respondents in the YRBSS are asked to describe whether they have engaged in numerous behaviors that may pose a danger to their health, including the use of alcohol, tobacco and other drugs. Data for the YRBSS is available every other year (odd years), with a one-year lag between the end of data collection and the publication of results.
CONSIDERATIONS
CDC's statistical software allows comparisons between Indiana and the entire United States for gender, race/ethnicity, and grade level. Although YRBSS data for some states are available from 1991, Indiana did not begin participating in data collection until 2003.
SEOW DATA SOURCES LIST
Behavioral Risk Factor Surveillance System (BRFSS) Survey
Geographic level: National and state; sub-state data is available using small-area estimation techniques. Availability: National and state data tables are available from the NSDUH website at http://nsduhweb.rti.org/.
National Vital Statistics System (NVSS) and Indiana Mortality Data
Strengths/weaknesses: In periods when smoking prevalence is declining, the attributable fraction (AF) method tends to underestimate the number of deaths caused by smoking. Conversely, when smoking prevalence is increasing, the AF formula may overestimate the number of deaths.
Treatment Episodes Data Set (TEDS)
Although the sample population includes more than 1.2 million people, it is not representative of the US. Productivity loss estimates are also underestimated because they do not include the value of work missed due to smoking-related illnesses, other smoking-related absenteeism, excess work breaks. , or the effects of secondhand smoke.
Uniform Crime Reporting (UCR) Program
County-Level Detailed Arrest and Offense Data
ONSUMPTION P ATTERNS AND C ONSEQUENCES
ALCOHOL CONSUMPTION General Consumption Patterns
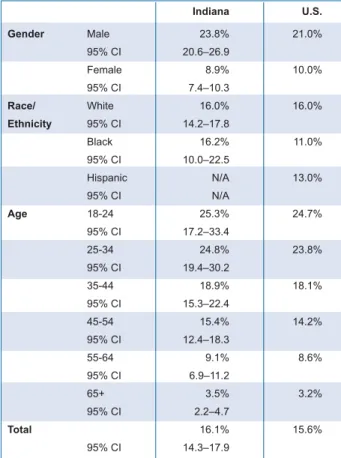
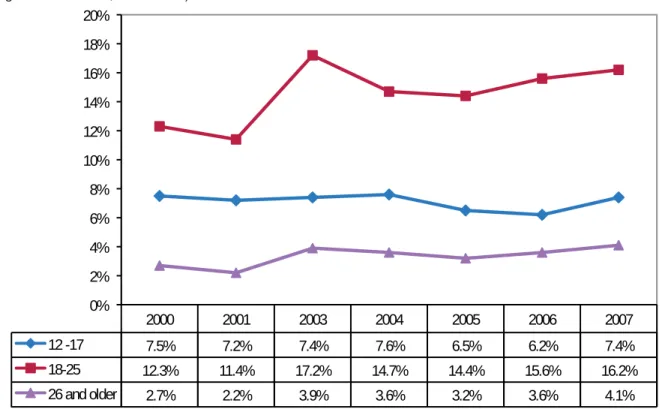
The NSDUH defines binge drinking as consumption of five or more alcoholic drinks on the same occasion (ie at the same time or within a few hours of each other) on at least one day in the past month. Perception of risk appeared to be inversely related to actual rates of binge drinking among adults: 18- to 25-year-olds who showed the highest prevalence of binge drinking showed the lowest rate of risk perception CI.
Adult Alcohol Consumption Patterns
The BRFSS defines binge drinking as "men who drink five or more drinks on one occasion and women who drink four or more drinks on one occasion". The overall prevalence rate for adult heavy drinking based on this definition was similar. Residents who engaged in binge drinking in the past 30 days (Behavioral Risk Factor Surveillance System, 2008).
Youth Alcohol Consumption Patterns
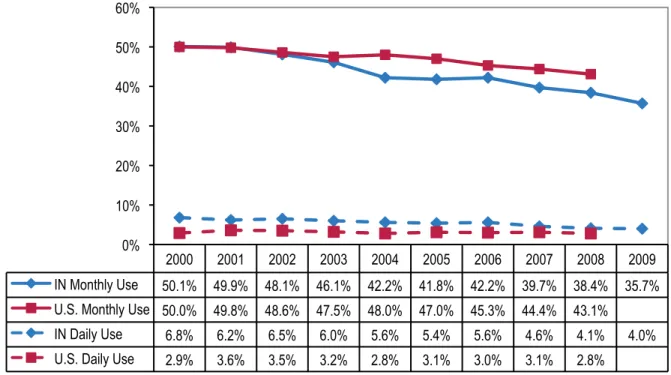
For trend information on monthly and daily alcohol use among high school seniors, see Figure 3.5, and for 2008 data on Indiana and US 8th, 10th, and 12th graders reporting lifetime, annual, monthly, and daily alcohol use (alcohol, tobacco, and other research on child and adolescent drug use in Indiana and Monitoring the Future, 2008).
CONSEQUENCES
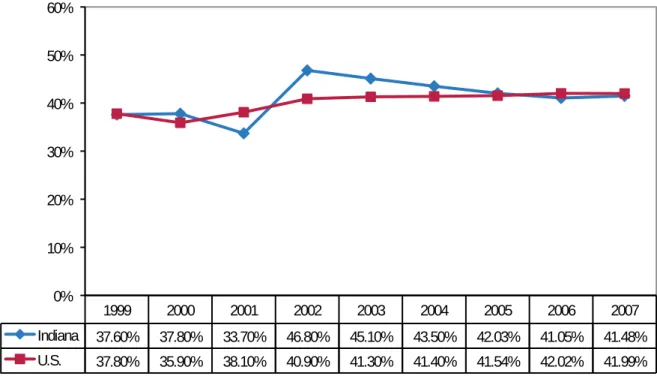
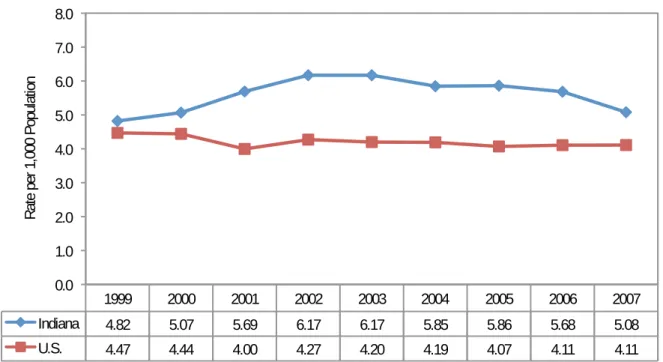
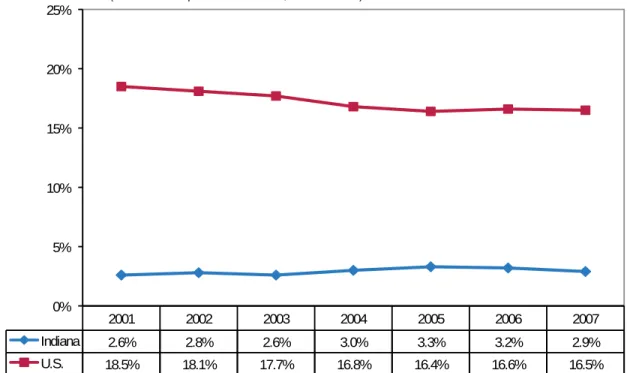
Alcohol plays an important role in substance abuse treatment admissions, based on findings from the Treatment Episode Data Set (TEDS). These differences between Indiana and the rest of the United States in alcohol abuse and dependence among the treatment population have persisted for at least the past eight years (2000 to 2007) (Substance Abuse and Mental Health Data Archive, 2008).
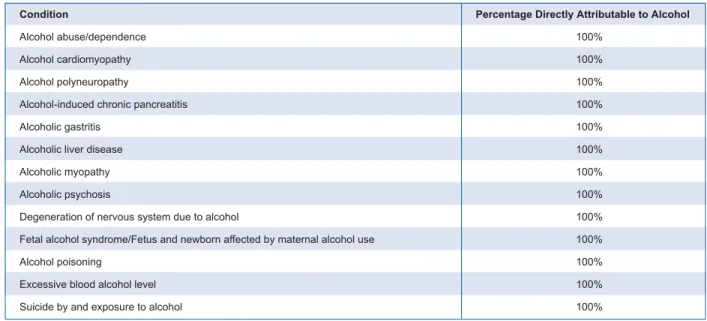
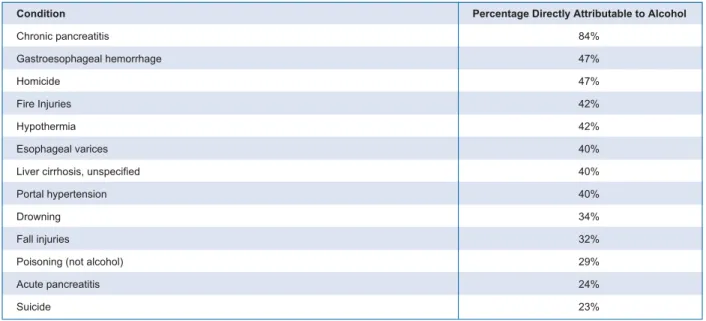
Alcohol-Related Morbidity and Mortality
Using the ARDI's alcohol-attributable proportion of 23%, this means that almost 1,184 suicide deaths were due to alcohol. Using ARDI's alcohol-attributable proportion of 47% means that 1,222 homicide deaths were due to alcohol.
Alcohol-Related Motor Vehicle Accidents
Data from the Automated Reporting Information Exchange System (ARIES), part of the Indiana State Police Motor Vehicle Crash Records System, showed a decrease in alcohol-related crashes from 13,911 in 2003 to 9,411 in 2008. For a detailed list of alcohol-related crashes and fatalities in Indiana by county for 2008, see Appendix 3D, pages 44-46).
Alcohol-Related Crimes
Kilde: National Archive of Criminal Justice Data, Inter-university Consortium for Political and Social Research, University of Michigan, n.d. Kilde: National Archive of Criminal Justice Data, Inter-university Consortium for Political and Social Research, University of Michigan, n.d.
APPENDIX 3A
APPENDIX 3B
APPENDIX 3C
APPENDIX 3D
APPENDIX 3E
Rate per 1,000 Enrolled Students
Number of Deaths
Number of Alcohol-Related Deaths in Indiana by County (Indiana Mortality Data, 2000–2006)
DUI Arrest Rates in Indiana by County (Uniform Crime Reporting Program, 2007)
Rate per 1,000 Population
Public Intoxication Arrest Rates in Indiana by County (Uniform Crime Reporting Program, 2007)
Liquor Law Violation Arrest Rates in Indiana by County (Uniform Crime Reporting Program, 2007)
TOBACCO CONSUMPTION General Consumption Patterns
In Indiana, 3.6 million residents, or a portion of the population age 12 and older, consider smoking one or more packs of cigarettes per day to be a high risk; the rate within the country is significantly higher (73.86%) (Substance Abuse and Mental Health Services Administration, Office of Applied Studies, n.d.).
Adult Consumption Patterns
S. 8th Grade
S. 10th Grade
S. 12th Grade
CONSEQUENCES Health Consequences
Factors associated with youth tobacco use include low socioeconomic status; use and approval of tobacco use. Tobacco use in adolescence is associated with many other health risk behaviors, including higher risk sexual behaviors and use of alcohol or other drugs (Centers for Disease Control and Prevention, 2009b).
Economic Consequences
Children are particularly affected by secondhand smoke, which increases their chance of developing significant lung diseases, particularly asthma and bronchitis (US Department of Health and Human Services, 2000). It is responsible for approximately 3,000 lung cancer deaths among nonsmoking adults each year (US Department of Health and Human Services, 2000).
APPENDIX 4A - Part 1
APPENDIX 4A - Part 2
APPENDIX 4A - Part 3
APPENDIX 4B
APPENDIX 4C
APPENDIX 4D
MARIJUANA CONSUMPTION
General Consumption Patterns
Source: Substance Abuse and Mental Health Data Archive, 2008 Table 5.1 Patterns of Marijuana Use among Indiana. As shown in Figure 5.6, self-reported marijuana use by individuals entering substance abuse treatment declines steadily with age.
CONSEQUENCES OF MARIJUANA USE Health-Related Consequences
1We defined marijuana dependence as “individuals in substance abuse treatment who listed marijuana as their primary substance at admission.”
Marijuana Dependence
Criminal Consequences
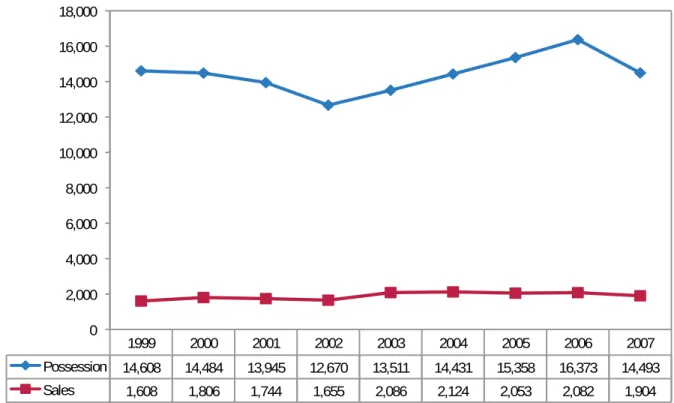
While geographic/regional arrest patterns are not immediately apparent, these data show that in most counties arrest rates for possession exceed those for trafficking. In Indiana, reporting coverage by county and local law enforcement jurisdictions is sometimes incomplete, and therefore, some of this data is based on estimates.
Social Consequences
APPENDIX 5A
APPENDIX 5B
APPENDIX 5C
Marijuana Possession Arrest Rates in Indiana by County (Uniform Crime Reporting Program, 2007)
Marijuana Sale/Manufacture Arrest Rates in Indiana by County (Uniform Crime Reporting Program, 2007)
COCAINE CONSUMPTION
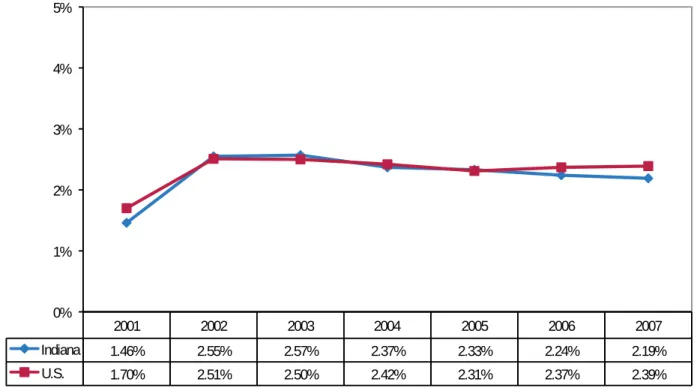
The rate differences between Indiana and the United States were not statistically significant (see table 6.2). However, rates for lifetime and current cocaine use between Indiana and the United States were statistically the same, as were rates among individual grades (9 to 12) (see Table 6.2).
Cocaine Dependence
Long-term effects of cocaine use include dependence, irritability, mood disorders, restlessness, paranoia, and auditory hallucinations (National Institute on Drug Abuse, 2004). The medical consequences of cocaine abuse are mainly cardiovascular problems (such as arrhythmias and heart attacks), breathing difficulties (such as chest pain and respiratory failure), neurological effects (such as strokes, seizures and headaches) and gastrointestinal complaints. complications (such as abdominal pain and nausea).
Legal and Criminal Consequences
APPENDIX 6A
APPENDIX 6B - PART 1
APPENDIX 6B - PART 2
APPENDIX 6C
Indiana Cocaine/Opiate Possession Arrest Rates, by County (Uniform Crime Reporting Program, 2007)
Rate per 1,000
Indiana Cocaine/Opiate Sales Arrest Rates, by County (Uniform Crime Reporting Program, 2007)
HEROIN CONSUMPTION
12th grade students report lifetime heroin use (alcohol, tobacco and other drug use by Indiana children and adolescents survey and Monitoring the Future survey. 12th grade students report monthly heroin use (alcohol, tobacco and other drug use by Indiana children and adolescents survey and Monitoring the Future survey.
Heroin Dependence
HIV/AIDS
Hepatitis
Self-Injury
APPENDIX 7A
APPENDIX 7B
C ONSUMPTION P ATTERNS AND C ONSEQUENCES
METHAMPHETAMINE CONSUMPTION
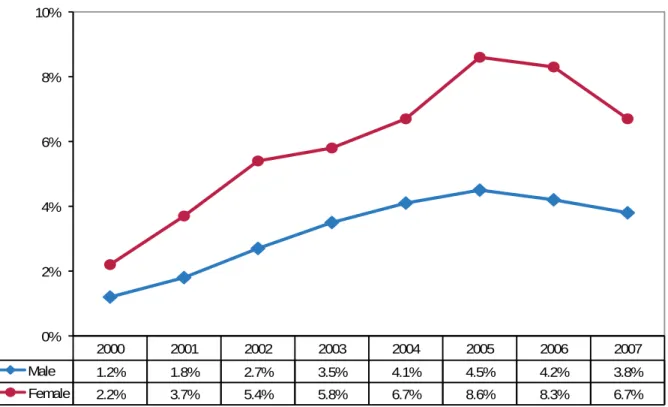
A statistically significant gender effect was observed for meth use among individuals entering substance abuse treatment in Indiana: at all data points, the percentage of clients reporting meth use at admission was greater than the percentage of male clients (P < 0.001) (see Figure 8.2). In Indiana, rates of methamphetamine use (lifetime, annual, and monthly) remained unchanged from 2008 to 2009 (see Figure 8.7 for trends in lifetime, annual, and monthly meth use among high school seniors in Indiana).
Health-Related Consequences
Meth Dependence
By far, the highest number of laboratory seizures and resulting arrests occurred in 2004, with 1,115 laboratories seized and 885 arrests made by the ISP. Substances defined as "synthetic" include a number of drugs other than methamphetamine, such as Demerol and methadone (National Criminal Justice Data Archive, Intercollegiate Consortium for Political and Social Research, University of Michigan, n.d.).
APPENDIX 8A
APPENDIX 8B
APPENDIX 8C
Number of Clandestine Methamphetamine Labs Seized by the Indiana State Police in Indiana, by County, (Indiana Lab Statistics, 2008)
Lab Seizures
Arrest Rates for Synthetic Drug Possession, per 1,000 Population, by County (Uniform Crime Reporting Program, 2007)
Arrest Rates for Synthetic Drug Sale/Manufacture, per 1,000 Population, by County (Uniform Crime Reporting Program, 2007)
P RESCRIPTION D RUG A BUSE IN I NDIANA
The National Epidemiology and Outcomes Workgroup (2008) survey collected information on nonmedical prescription drug use among Hoosiers age 18 and older. However, lifetime, past year, and past month use of these drugs among 9th grade youth decreased (Indiana Prevention Resource Center, 2009).
PRESCRIPTION DRUG ABUSE CONSEQUENCES
Another data source for assessing nonmedical prescription drug use is the Treatment Episode Data Set (TEDS). Young Hoosiers (under 18) in treatment reported significantly less use of psychotherapeutics than adults 18 and older.
Prescription Drug Dependence 7
Nonmedical Prescription Drug Addiction Treatment Episodes Reported at Treatment Admission by Drug Category (Episodes of Treatment Dataset, 2007). Prescription Drug Dependence Treatment Episodes Reported at Treatment Admission by Drug Category (Treatment Episode Data Set.
APPENDIX 9A
APPENDIX 9B - PART 1
APPENDIX 9B - PART 2
APPENDIX 9B - PART 3
APPENDIX 9C
Per Capita Dosage Units (18 months)
Arrest Rates, per 1,000 Population, for Possession of “Other Drugs” (Barbiturates and Benzedrine) in Indiana, by County (Uniform Crime Reporting Program, 2007)
P OLYSUBSTANCE A BUSE IN I NDIANA : C ONSUMPTION P ATTERNSCONSUMPTION PATTERNS
Treatment episodes with polysubstance abuse (use of at least two substances) Reported at treatment admission (Treatment episode data set. Treatment episodes with polysubstance abuse (Use of at least three substances) Reported at treatment admission (Treatment episode data set).
Demographic Characteristics of Polysubstance Users
Age —Significant differences by age group were observed in all years examined for treatment episodes in Indiana with indicated polysubstance abuse ( P <.001). Polysubstance abuse increased from 2000 to 2007 for all age groups (P < 0.05) with one exception: use of three or more substances remained stable among the treated population aged 55 years and older (see Figures 10.7 and 10.8 ).
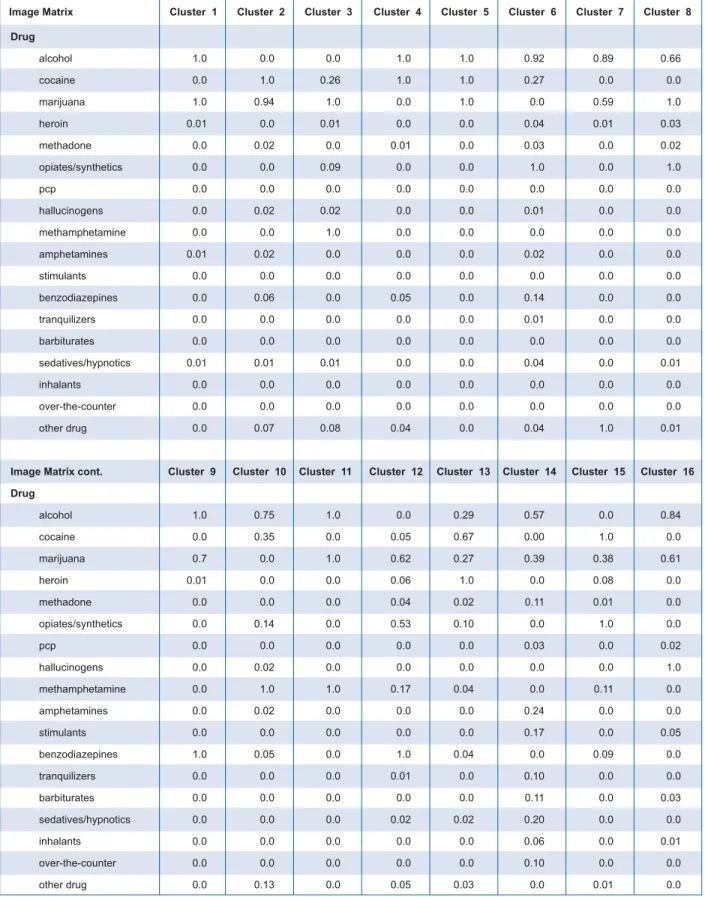
Polysubstance Abuse Clusters in Indiana
The oldest users of multiple substances, over 50, were most strongly represented in group 13 (heroin/cocaine). The binary use of "1" and "0" provides a clearer picture of the drugs most commonly used in each group.
APPENDIX 10A
APPENDIX 10B
To measure the severity of substance abuse at the community level, we identified proxy indicators1 for the use of individual drug categories, including alcohol, cocaine, methamphetamine, marijuana, and prescription drugs. We also identified common indicators associated with alcohol and illicit drug use, such as drug-related arrests, property crimes, and youth runaways.
Alcohol Indicators
C OMMUNITIES WITH S IGNIFICANT S UBSTANCE
We then ranked the provinces based on the selected indicators, using a highest need/highest contributor model: provinces were given a priority score based on their need. For each indicator, counties received three points if they were in the top 10 percent (90th percentile), two points if they were in the top 25 percent (75th percentile), one point if they were in the top 50 percent (50th percentile). percentile), and zero points if they fall below the 50th percentile.
A BUSE C HALLENGES
The selection of substance abuse indicators was limited to datasets with state-level data, such as the Uniform Crime Reporting (UCR) Program (National Archive of Criminal Justice Data, Inter-university Consortium for Political and Social Research, University of Michigan, n.d.) and the Indiana Automated Reporting Information Exchange System (ARIES) (Indiana State Police, 2009). Source: Indiana State Police, 2009; National Archive of Criminal Justice Data, Inter-University Consortium for Political and Social Research, University of Michigan, n.d.
Cocaine and Methamphetamine Indicators
Other Drug Indicators
Overall Use Indicators