Part II
Planning and
Control
A
ccountants love to plan, so plan on this part cover- ing methods for creating a budget and getting bud- gets to fit together. I also lead you through a pleasant discussion on overhead costs and why they’re often mis- used or ignored in cost analysis. You say you want to learn about inventory and how that may generate your largest costs? Well, you’re in the right place . . . er, part.Chapter 6
What’s the Plan, Stan?
Budgeting for a Better Bottom Line
In This Chapter
▶ Seeing the master budget and its component parts
▶ Appreciating the importance of budgeting
▶ Planning production, sales, and cash
▶ Working costs into the budget process
▶ Assigning responsibility, using a budget as a guide
Y
ou need accurate information to make smart decisions about your busi- ness. A well-planned budget may be most important piece of informa- tion you use.Budgeting is a proactive process. It’s the thinking person’s accounting. You anticipate future outcomes and can maximize them. You anticipate problems and may be able to minimize or eliminate them. That’s a lot better than oper- ating in ignorance and reacting to events as they come up.
In this chapter, you look at budgets, consider how to anticipate costs, and work through some essential budget documents.
Brushing Up on Budgeting Basics
As you know, a budget is a financial plan that includes both financial and non- financial information. Its most obvious features are a projection of revenue (how much you anticipate selling) and expenses (how much you anticipate spending). The budget can also contain non-financial information, such as how many employees you think you need.
A budget is a forecasting document, but businesses use it as a financial control tool, as well. A financial control is a tool to monitor activities in your business. One control is to review spending and ensure that you don’t exceed your budgeted spending. Often, a company (or a division or department within it) isn’t allowed to spend more than has been budgeted.
Budgets cover a specific period of time, most commonly a year. And a budget looks into the future. Although you use historical information to put together your budget, the activities you plan happen in the future.
When you budget, you’re in good company. Businesses and governments, both large and small, create budgets. So do millions of people.
Seeing the master budget and its component parts
A master budget is a summary of your financial plan and your operating plan.
The master budget gives you a “big picture” and sets your course of action for an upcoming period. It’s critically important.
✓ The financial plan (financial statements, really) is what you share with outside parties who need your budgeted information. The bank where you have a loan may want to see your financial budget. In some cases, a government regulatory agency may want to review your budget. If you manufacture food, the Food and Drug Administration (FDA) is the federal agency that regulates food. The FDA might want to review your budget. Financial information comes from three financial statements:
budgeted balance sheet, budgeted income statement, and budgeted statement of cash flows.
✓ The operating plan (also known as the operating budget) is used inter- nally. Imagine sitting in a meeting with your managers. Your managers need to understand how much they can spend this year and how they are allowed to spend it. Managers also need to understand how much money the company is forecasting as a profit. The projected profit affects the manager’s sales plans. These details are contained in the operating plan. You hand out the operating plan to each manager, and the managers implement the plan.
The master budget is a comprehensive picture of your plans for the future and how the plans will be accomplished.
Operating plans can contain non-financial information. Decisions about pro- duction, hiring, and selling effort are components of operating plans.
85
Chapter 6: What’s the Plan, Stan? Budgeting for a Better Bottom Line
Why budgeting is important
To put it simply, when you put together a budget, you determine how you plan to use your resources. Assets are resources; cash is the most famous asset. Other property, like vehicles, for example, are assets, too. The reason you spend cash for materials and labor is to earn money for your business.
The reason you buy a truck for use in your business? Same thing: to earn money for your business.
In theory, you could sell all your assets. Of course, then you wouldn’t have a business, but that’s what happens when you dissolve a business — the assets are used to pay off the company’s liabilities. A liability represents a
“claim” on your assets. A claim means that someone has a potential right to your assets if you don’t pay him or what you owe. A bank loan is a company liability. So are your utility bill and other bills you need to pay. If you don’t pay your bills, the companies you owe could file lawsuits. A court might force you to pay. That’s what is meant by a claim on assets.
A budget helps you forecast how much of your assets you use and how much revenue (sales) the asset generate. If you use your assets (resources) wisely, you increase your profit.
Assets such as trucks depreciate. They’re worth a little less every day as you use them up. The more you drive your company trucks, the more costs you recognize. Note that you can budget for operating costs and depreciation, such as what you’ll see with a truck.
Take landscapers as an example. Landscapers are a smart bunch. They drive the wheels off their trucks until maintenance costs become too great. They milk all the revenue they can out of an asset before disposing of it. It’s simple:
A load of steer manure doesn’t care whether it’s being driven to the jobsite in a brand-new dually with crew cab or a 15-year-old junker. You have choices about using resources. If you choose to use resources to make product A (and generate revenue), you’re giving up the opportunity to use those same resources to produce product B (which would have generated revenue, too).
This is called opportunity cost. You make the decision to produce either prod- uct A or B in your budget.
Opportunity cost is the decision to go one way instead or the other. It’s mainly about deciding how to allocate resources. Opportunity cost con- fronts you when you look at your product line (what you plan to sell), your expenses, your vehicles, and so forth. It even operates when you choose which restaurant to go to on Saturday night. Maybe the pricey place is close by and the cheaper place is a long way away, so what do you do? Either option gives you something and costs something.
Your budget also helps you figure out product mix. How much of each prod- uct or service will you sell? Take a look at Chapter 3 to see how to use sales mix to reach a target level of income.
Cash flow is the cash inflows and outflows your business generates. When you produce a product or perform a service, you spend cash (cash outflow).
When you’re paid for a sale, you get cash (cash inflow). You plan sales in your budget. As a result, you plan cash inflow and outflows, too. The key cash flow question is this: Does my budget include enough cash inflows to pay the outflows?
If an accountant recognizes revenue based on cash inflows, he or she is using the using cash basis accounting. Cash basis accounting recognizes expenses when you have a cash outflow. Most companies use the accrual method of accounting, which is different. Both of these methods are defined in the
“Budgeting with Cash Accounting or Accrual Accounting” section, later in this chapter.
Planning strategically
Businesses generally plan for the long term. Occasionally, you get existential and ask, “What’s it all about?” Your strategic plan has the answer.
A strategic plan is your business’s road map to the future. The plan reminds you, your employees, and third parties what you do, how you do it, the cus- tomers you do it for, and maybe even how you will do it in a superior way.
“It” means making jet fighter aircraft, selling chocolates in a mall, or whatever the business does.
The plan summarizes where the business is, where it wants to go, and how it’s going to get there. In theory, everything you do day to day contributes to advancing the goals in the strategic plan. Everything you do can affect costs, profits, and company growth.
Your budget, of course, is an important part of strategic planning. The bud- geting process forces you to think, make decisions, and come up with reason- able forecasts. You can’t sidestep potential negatives, either. That would be like a farmer pretending that a drought doesn’t exist.
In the world of startup businesses and bank loans, you generally hear the question “Do you have a business plan?” A business plan is very much the same thing as a strategic plan. You probably won’t get venture capital (VC) money or a loan without a plan that assures the investor or lender of your credit-worthiness.
87
Chapter 6: What’s the Plan, Stan? Budgeting for a Better Bottom Line
VC firms buy equity (ownership) in companies that are just starting out. The companies that VC firms invest in typically don’t have a track record of sales and profits. VC firms take large risks, because the investment in a startup firm may be lost if the company fails. If the new business succeeds, the VC firm can earn a large rate of return on the investment. You may have heard the term “Go big or go home.” That describes what a VC firm does.
Strategic planning begins in a practical way but quickly requires you to be a visionary. A good example is the late Steve Jobs, considered to be a great business visionary of the 20th and 21st centuries. Jobs was able to imagine the types of technology products customers wanted long before other people could. Apple created lots of innovative products based on Jobs’s vision.
Strategic planning methods exist in abundance and seem to be a thriving cot- tage industry. They contain more letters than ten cans of alphabet soup, and include SWOT, PEST, STEER, EPISTEL, ATM, and RCA. Be cautious, and use common sense before embracing a planning methodology. Strategic Planning For Dummies, by Erica Olsen (published by John Wiley & Sons) is a great resource for this topic.
Planning How to Plan: Factors That Impact Your Budgeting Process
Planning is time consuming, but it pays off. There’s no single difficult part, so the biggest challenges are to bring the right information to the game and use your head. Good information comes from your experience, what you know about timing, the facts and figures your staff gives, and what you judge about sales projections.
Experience counts
Business owners without much experience in an industry often plan poorly, in part because they don’t have much personal history to go on. Also, some people have trouble accepting the reality of their business prospects. For example, they really want the business to grow 30 percent but can’t accept the fact that 10 percent is more realistic.
I worked with three brothers who were opening a pizza-parlor franchise. The franchise was successful in other parts of the county. The brothers were opening a store in a new area of town. All good. None of the brothers had any
restaurant industry experience. Two of the brothers sold business envelopes, and the third was a professional golfer. Not so good.
The four of us did an analysis and determined that the profit margin was only 5 percent. That profit margin was so small that a seemingly insignificant change from the budget (budget versus actual) could result in a loss.
The brothers went forward with the business in spite of the small profit margin. They wanted to start their own business very badly, so they were willing to take the risk that it wouldn’t succeed financially. After a few years, the brothers closed the business. The pizza parlor never generated enough profit to pay the owners a reasonable salary.
The pizza-restaurant owners planned poorly. They didn’t have any industry experience. If they had, they might have realized that the profit level they were projecting was not realistic. If they had agreed that the projected profit was too low, they might have passed on opening the restaurant.
Timing is everything
Different business decisions have different timelines. Those timelines depend, in part, on the dollar amount of the decision you’re making.
Understanding your timeline will help you make intelligent decisions about spending.
For example, if you decide to use a different supplier for your materials, you could start buying materials from that company immediately. No problem.
On the other hand, completing a move into a newly constructed building might take a year or more. You need to consider timelines for your more expensive business decisions. If you’re building a new office, determine how long the construction will take. Based on the timeline, you can plan your pay- ments for the building and how you’ll generate cash to make the payments.
Explain your timeline in your business plan. If you’re providing financial statements (discussed later in this chapter) for one year, you may need to explain payments for a building (asset) that isn’t yet completed. It’s perfectly reasonable to expect a business to pay for major assets over a long period.
Just make sure that it’s explained to your investors or lenders. You may have a one-year operating budget, along with a capital expenditure budget for three to five years. The capital expenditure budget is the big-things-I’ll-buy-and-pay- for-long-term budget. This budget helps you and others visualize your long- term plans and spending.
89
Chapter 6: What’s the Plan, Stan? Budgeting for a Better Bottom Line
People get you headed in the right direction
The budgeting process isn’t just about numbers; it also involves people.
Part of planning your business involves talking to people — lots of people! A budget is something that a group of people typically reviews and eventually comes to an agreement on. Involve people and get their opinions, or there won’t be agreement on the budgeted results. If the company’s managers don’t generally agree on where you’re headed in your budget, you may need to revise.
Talk to your staff. If you’re concerned about wasting material in the manufac- turing process, talk to people on the factory floor. Maybe you’ll find out that poor quality is the reason some material is wasted during production. Maybe some denim you use to make jeans tears too easily and has to be thrown out.
The problem isn’t the employees; it’s poor-quality material from a supplier.
You may never find that out unless you spend some time on the factory floor.
Talk with the sales staff to plan sales for the year. Good salespeople know their clients. They may know about a client’s purchasing plans for next year.
They may even know a client’s budget to buy your product! Also, a good salesperson might know the financial condition of the customer. If the cus- tomer’s business is growing, he or she might buy more from you. If the busi- ness is in financial trouble, that might mean decreased sales.
Have a conversation with the accountant during planning. She knows how cash flow turned out last year. You can look at the data on how quickly you collected cash for sales. Also, your attorney will remind you of any legal issues that might generate expenses during the year. There may be costs for legal services or costs to settle litigation. Those costs require cash, and you need to include them in your plan.
When your budget is in good shape, you can present it to your staff and explain where the company is headed. They’ll feel more confident knowing the company’s direction and prospects.
Sales projections pay off
Sales projections help answer the question of how you earn a reasonable level of profit. Of course, the answer is complicated if there are competitors selling the same product or service, because it suggests you might have to lower prices to stay competitive. If you want to cut prices to attract business, you need to plan your costs so your profit level remains reasonable. Another possibility is to improve the design of your products and not change prices. If you do that, you add the cost of design to product costs. But increased sales without cutting prices may offset the cost of design.
Good planning is useful, and poor planning leads to projections (of profit, sales, and company growth) that aren’t useful. If you use unrealistic plans, you use assets in ways that won’t maximize your profits. Simply put, you end up spending time and money on the wrong activities.
Say you’re a homebuilder with a 50 percent growth in sales last year. This year’s budget assumes a 30 percent sales growth. You don’t take a lot of time to analyze that assumption; you just figure that because last year was great, and expected orders for the beginning of this year look promising, why not 30 percent? That’s no method of projecting sales growth.
Part of the answer is market research. It’s a marketing concept but may be useful here. Assume that you’re selling running shoes in the United States.
The first step is to determine the size of the market, and you find that 10 mil- lion people buy running shoes each year. On average, they spend $80 for a pair. Fortunately, you’ve priced your shoes at $78, so you’re right around the average.
Next, you estimate that your firm can capture 10 percent of the U.S. running- shoe market. That means a total sales volume of 10 percent of a 10 million- unit market, or 1 million units sold in a year. At $78 a pair, you project your sales to be $78 million. Finally, you consider whether the market is growing or shrinking. If the running-shoe market is growing at 10 percent per year, you could reasonably increase your sales projection by 10 percent each year, also. Of course, market growth is impacted by the economy overall and the specific industry (sporting goods, in this case). Competitors may also impact your growth. All of these issues would need to be projected before coming up with a reasonable sales forecast.
Company goals, employee compensation
Ideally, your employees can connect your budget goals to their proposed salary increases and bonuses. I once sat in a sales meeting with a company president and his sales staff. The salespeople were paid a bonus based on their individual sales, regardless of overall company results. The president was paid a bonus based on company profits. It was early November, and the president was trying to determine if enough sales would come in before year end so the company could reach its profit goal (which would be good for the president).
Keep in mind that the additional business would need to meet an accountant’s defini-
tion of a legitimate sale. If you’d like to know more, check out the book Financial Accounting For Dummies, by Maire Loughran (published by John Wiley & Sons).
I knew that none of the salespeople were close to meeting the sales level for bonuses. They had no motivation to bring in sales before the end of the year (which would be bad for them).
They wanted to close sales and get credit in the following year, when they counted toward their next year’s bonus. Needless to say, the salespeople stayed quiet. The president didn’t connect the company’s profit goals with the salespeople’s compensation.
91
Chapter 6: What’s the Plan, Stan? Budgeting for a Better Bottom Line
The sales growth rate drives decisions about spending, employee hiring, and cash planning. If you’re selling 30 percent more, you can plan to increase your spending and hire employees to manufacture 30 percent more of your product. You also probably can expect a 30 percent increase in cash inflow as a result of growth, too.
But wait! If a more careful review indicates 10 percent growth, your 30 per- cent projection creates some problems for you. You increased your spending and hiring assuming the 30 percent level, but the sales and cash inflows will only come in at 10 percent. Put simply, you’re planning on spending 20 per- cent too much. Whether you’re building homes or selling running shoes, the numbers still apply.
The Nuts and Bolts (and Washers) of Budgeting
Budgeting takes time. In fact, a well-designed budget can take a lot of time to create. The good news is that the process gets easier over time.
Begin by deciding what company entities require a budget. Also decide how detailed your budgeted data should be. The budget can be for the whole com- pany, or maybe each of five company divisions should have its own budget.
Maybe you want to produce budgets for each of three departments within each of the five divisions. The process takes time and involves people, so the benefit of having the budget must outweigh the cost of putting it together.
In budgeting, you begin with some assumptions. The assumptions are called standard costs and are the specific planned levels of cost and activity. For example, you might assume a standard labor rate (cost) of $20 per hour for a sewing-machine operator. You might assume a standard material rate of $75 per square foot for marble for kitchen countertops.
When you create your budget (based on reasonable assumptions) and start the year’s business, you have actual costs and levels of activity to review.
A difference between an actual cost and standard cost is a variance (see Chapter 7). A variance is a scorecard that tells you how close your budget assumptions were to actual results. Fortunately, you can make modifications to your budget to deal with variances.
Understanding the budgeting financials
Your budget becomes a set of pro forma financial statements. Pro formas are what-if statements, filled with budgeted, planned, and forecasted items.
Unless you have a crystal ball, your budget is always a collection of educated best guesses about the future.
To keep things simple, there are three basic financial statements for budget- ing: the balance sheet, the income statement, and the statement of cash flow (mentioned earlier in this chapter). Another aspect is an explanation of your source of funds.
Source of funds
Your budget determines if you have enough funds to run your business.
Hopefully, you get all the money you need from selling products or services, but that’s not always the case.
The financial plan (also loosely called the business plan) explains the source of funds to run the business. You can raise money by borrowing cash (debt) or by offering investors ownership in the business (equity) in exchange for cash.
If you borrow, you repay a creditor the original amount borrowed (principal) and interest on the loan, usually on a written schedule. The interest cost and principal repayment must be included in the budget.
You can also raise funds by selling ownership in your business, offering investors equity. Equity investors are rewarded in two ways: stock apprecia- tion and dividends.
The most common way to sell ownership is to sell common stock. Investors expect you to explain (through your budget) how you plan to generate a profit for the year. If the company is profitable, the value of their ownership in your business increases. They could eventually sell their ownership inter- est to someone else for a profit.
You also need to think about whether or not to pay dividends. Dividends are a share of the profits earned by the company paid to equity investors. Of course, without any company earnings, you can’t pay dividends.
Using the balance sheet
The balance sheet lists the company’s assets, liabilities, and equity (essentially the difference between assets and liabilities) as of a certain date. Think of the actual balance sheet as a snapshot in time; think of the budgeted balance sheet as a pretty good estimate of the actual financial statement.
Liabilities are claims on your assets. A liability means that you owe someone money. Liabilities include items such as unpaid utility bills and payroll costs you have not yet paid. Future interest and principal payments on a loan are also liabilities. When you pay a liability, you use an asset (cash, in most cases) to make payments.
93
Chapter 6: What’s the Plan, Stan? Budgeting for a Better Bottom Line
This gets you to the basic formula for the balance sheet:
Assets – Liabilities = Equity
I describe it this way: Assume you own a little shop. You sell all your assets — your inventory, furniture, and your building. You use the cash you receive to pay off all your liabilities — utility bills, payroll, and bank loan. Whatever cash is left after you pay off your liabilities is your equity. Equity is the true value of your business. Equity is the residual — after you use your assets to pay off all liabilities. So now you can see the logic behind the balance sheet formula: Assets less liabilities equals equity.
Working with the income statement
The income statement shows revenue, expenses, and net income (profit). For most business owners, the income statement is the most important report.
The income statement shows if a business was profitable over a period of time (such as a month, quarter, or year), whereas the balance sheet shows assets, liabilities, and equity as of a specific date. The nice thing about modern accounting software is that it’s pretty easy to instantly display and print an income statement. Think of the budgeted income statement as a pretty good projection of your company’s sales, expenses, and profit.
The income statement formula is incredibly simple:
Revenue – Expenses = Net Income
Analyzing the statement of cash flows
The statement of cash flows analyzes your sources of cash (cash inflows) and your uses of cash (cash outflows) over a period of time. Cash flows are grouped into three categories: operating, financing, and investing activities.
When an accountant puts together a cash flow statement, she reviews every transaction that affected cash. A very simple model is what’s in your check- book. If inflows are good, you probably have enough cash to operate. If the checkbook shows that you’re overdrawn, outflows have exceeded inflows, and you’ve got trouble.
The goal is to assign every cash transaction to one of three categories, although most of your cash activity is in the operating activities section.
I always suggest that people find financing and investing activities first because there are usually fewer transactions. The remaining transactions are operating activities.
The three cash flow categories are
✓ Operating activities occur when you run your business each day. You buy material, pay for labor, ship goods, pay interest on loans, and col- lect cash from customers.
✓ Financing activities occur when you raise money for your business, and when you pay lenders or investors. You receive cash when you sell equity, and you receive cash when you borrow. You pay cash when you pay dividends, and you pay cash when you pay down a loan (pay back some of the principal).
✓ Investing activities occur when you buy or sell assets. If you write a check for a new vehicle or receive cash when you sell equipment, those are investing activities.
The statement of cash flows lists the beginning cash balance; all the cash activity for the period, grouped into three categories; and the ending cash balance:
Ending cash balance = (net cash flow of operating activities) + (net cash flow of financing activities) + (net cash flow of investing activities) A simpler formula is
Ending cash balance = (beginning cash balance) + (cash inflows for the period) – (cash outflows for the period)
The ending cash balance in the statement of cash flows equals the cash bal- ance in the balance sheet (well, it’s supposed to, anyway). For example, if the statement of cash flows is for March, the ending cash balance should equal the balance sheet cash balance for the last day of March.
When you create your budget, it should include all three financial statements (balance sheet, income statement, and statement of cash flows).
Reviewing revenue and production budgets
Revenue and production budgets, put simply, forecast how many units you plan to produce and how many units you plan to sell. For more info, check out the flow of manufacturing costs in Chapter 4.
Say you’re budgeting to manufacture garage doors. You need to forecast how many sales you expect. Then you consider how many garage doors you already have in inventory and plan how many you need to manufacture to meet the sales forecast. Ta da! When you know the number of doors you need to make, you can budget for material and labor costs.
Direct costs are pretty straightforward, and you can use an activity level to assign indirect costs. See Chapter 5 for more on assigning indirect costs.
Revenue, production, inventory, direct materials, direct labor, indirect costs (overhead), and cost of goods sold all are budgeted items.
95
Chapter 6: What’s the Plan, Stan? Budgeting for a Better Bottom Line
Applying the revenue formula
Say you forecast selling 200 garage doors in March. Consider how many garage doors you need to manufacture. Assuming a sales price of $300 per door, here’s your revenue budget:
Revenue budget = 200 units × $300 Revenue budget = $60,000
Using the inventory formula
And now for the famous inventory formula:
Ending inventory = beginning inventory + production - sales
Your production will change based on how many garage doors you already have in inventory. So if you already have 75 completed garage doors in begin- ning inventory, it’s clear that you won’t need to manufacture all of the 200 units you plan to sell.
But wait! Do you want any garage doors in ending inventory? If you think you’ll have orders during the first few days of the next month, you probably do. So maybe you decide on an ending inventory of 50 garage doors.
Take the inventory formula and calculate the garage door production you need. Assume x is production in units, and solve for x:
Ending inventory = beginning inventory + production - sales 50 = 75 + x - 200
x = 175
This simple algebra problem shows that production should be 175 units.
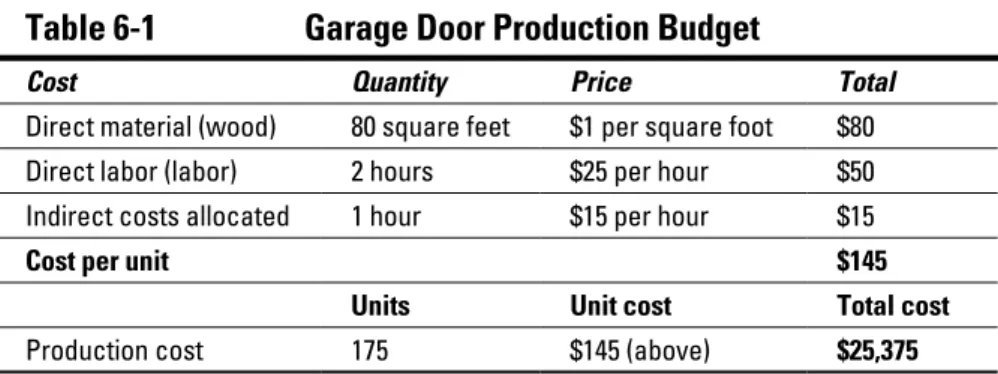
Table 6-1 shows a production budget.
Table 6-1 Garage Door Production Budget
Cost Quantity Price Total
Direct material (wood) 80 square feet $1 per square foot $80
Direct labor (labor) 2 hours $25 per hour $50
Indirect costs allocated 1 hour $15 per hour $15
Cost per unit $145
Units Unit cost Total cost
Production cost 175 $145 (above) $25,375
The production budget includes direct materials, direct labor, and indirect costs (overhead). In this example, the indirect cost is allocated based on machine hours. Add the costs to get a unit cost. Then multiply units to be produced by the cost per unit. That amount is the total cost of production of $25,375.
Assessing cost of goods sold
The goods you produce for customers end up in one of two places: You either sell them (cost of goods sold), or they’re still on the shelf (finished goods inventory). Beginning inventory and production don’t matter. For more info on cost of goods sold, see Chapter 4.
What costs should be attached to the goods you sell? How much did they cost to produce? (If you’re a retailer, how much did they cost to get?) To continue with the garage door manufacturing example, assume that the first goods you sell are from beginning inventory. Because all 75 units of begin- ning inventory are sold, use a formula to determine how many units of the March production are sold:
March production sold = total sales - beginning inventory March production sold = 200 - 75
March production sold = 125
Assume also that the cost per unit of beginning inventory is $143. That cost is different from the March production cost of $145. (Why the change? Because it seems like the costs of materials and labor to make a garage door go up all the time.) Table 6-2 displays the cost of goods sold budget.
Table 6-2 Garage Door Cost of Goods Sold Budget
Units Cost Per Unit Total Cost
Beginning inventory 75 $143 $10,725
March production sold
125 $145 $18,125
Total 200 $28,850
The total cost of goods sold is higher ($28,850) than total production cost in Table 6-1 ($25,375). That makes sense, because Table 6-1 deals only with producing 175 units. You sold 200 units, but 75 units were from inventory.
Because of adjustments for beginning and desired ending inventory, you don’t always need to produce in a month the number of units you sell in a month.
97
Chapter 6: What’s the Plan, Stan? Budgeting for a Better Bottom Line
One more calculation. (There’s always one more calculation.) Now calculate your ending inventory budget:
Ending inventory budget = units × per unit cost Ending inventory budget = 50 × $145
Ending inventory budget = $7,250
You’ve planned revenue, production, and inventory. Great! Now you need to figure out how to pay for it all. If you don’t have a budget for an adequate cash amount to operate, you can’t do business.
Budgeting with Cash Accounting or Accrual Accounting
Accounting was easier in the days of the cave dwellers. Og said to Gog, “I give you three spear points. You give me that deer.” After that, accounting got more complex, and every civilization has kept business records in one form or another.
The credit for modern accounting goes to Italian mathematician Luca Pacioli, a Franciscan friar who hung out with Leonardo da Vinci. Pacioli developed double-entry accounting, which every business (except street merchants, and maybe some of those, too) uses.
There’s a choice for small business: You can use cash basis accounting or accrual basis accounting. Both methods can be used for budgeting, but accrual is better and is used by all large organizations.
Cash basis accounting: Using your checkbook to budget
Cash basis accounting posts revenue and expenses to the financial statements based solely on cash transactions. Nothing happens until you take cash in or send it out. It’s a simple way of doing things — no accounts receivable and no accounts payable.
By contrast, accrual basis accounting states that expenses are matched with revenue, regardless of when cash moves in or out of the checkbook. The accrual basis is a better method to account for cash, because revenue and expenses are matched more precisely. See the section “I accrue, you accrue, we all accrue with accrual accounting.”
On a very basic level, your cash budget is a reflection of your checkbook.
It’s the sum of the deposits you make (revenue) and the checks you write (costs). The budgeting result of cash basis accounting is a cash budget.
Such a budget assumes that all your customers pay for sales in cash during the month of sale, and it assumes that you pay all costs during the month that the goods are sold. This is very unlikely for most businesses.
It’s more likely that you write a check in February for materials for a product you sell in April. Similarly, you might pay an employee in December for work to make a product that’s sold in January.
Assume you own a gift shop that sells greeting cards, flowers, and gifts. Your beginning cash balance for the month is $100,000. Table 6-3 displays a cash budget for a gift shop.
Table 6-3 Gift Shop Cash Budget — Month of March
Amount
Beginning cash balance $100,000
Add customer payments for sales $50,000 Less:
Inventory purchases $20,000
Payroll costs $10,000
Utilities costs $1,000
Lease cost $3,000
Ending cash balance $116,000
This cash budget has a $16,000 increase in cash during the month ($116,000 -
$100,000). You had $50,000 in sales. If you hadn’t collected any cash from customers during March, your cash balance would decrease by $34,000, the total of all the cash outflows. If that happened, you’d start the next month with $34,000 less cash. You need to consider if your April cash budget (next month) would work with a lower beginning balance in cash. You don’t want to start in the red.
If you don’t think you’ll have enough cash for a period, you can consider how to get it.
The cash budget is similar to the statement of cash flows. Table 6-4 shows an example statement of cash flows for the gift shop.
99
Chapter 6: What’s the Plan, Stan? Budgeting for a Better Bottom Line
Table 6-4 Gift Shop Budgeted Statement of Cash Flows
Amount
Beginning cash balance $100,000
Cash flow from operations $16,000
Cash flow from financing $0
Cash flow from investing $0
Ending cash balance $116,000
Note that the beginning and ending cash balances in Table 6-4 agree with the cash budget ($100,000 at the beginning and $116,000 and the end). The cash flow calculation from operations is
Net cash inflow from operations = customer payments - cash outflows Net cash inflow from operations = $50,000 - $34,000
Net cash inflow from operations = $16,000
All the cash flows for the gift shop are related to day-to-day operations. None of the cash activity is related to financing or investing.
I accrue, you accrue, we all accrue with accrual accounting
An effective budget applies the matching principle. The principle says you should match the timing of the expenses of creating and delivering your product or service with the timing of getting revenue from the sale. This is accrual basis accounting (as opposed to cash basis accounting).
Accrual accounting ensures that revenue is better matched with the expenses incurred to generate revenue. In simple terms, with accrual accounting you realize or recognize expenses when you incur them, not when you pay them.
You realize revenue when you generate it, not when the customer pays.
When you create an invoice, the accounts receivable (A/R) system generates a receivable, even though the customer may not pay for, say, 30 days. When the payment comes in, the receivable goes flat, meaning it’s been satisfied by the payment. Accrual accounting is considered to provide a more accurate reflection of business activity than cash accounting. By the way, the system still allows for straight cash sales — where you sell now and the customer pays now.
The same is true of purchases you make. When you buy now and pay later, you create a payable. When the bill comes and you pay it, the payable goes flat. Of course, the system allows you to make straight cash purchases — where you buy and pay your vendor now.
Say you manage a catering business. The food, preparation cost, and delivery expenses related to the Jones family reunion should be matched with the revenue from Jones family. Ideally, you want the expense and the revenue to be posted in the same time period. You wouldn’t want the Jones expenses posted in March and the Jones revenue posted when they paid (say, in April).
That’s not the best reflection of your business activity.
The downside of accrual accounting is that your income statement revenue and expenses rarely match your cash inflows and outflows. You can be rich in receivables and darned poor in cash. All companies still prepare a cash flow statement even if they are using accrual accounting.
Budgeting to Produce the Income Statement and Balance Sheet
A final step is to create a budgeted balance sheet and budgeted income statement. Your balance sheet and income statement, whether budgeted or actual, are the two great financials. They are the bottom line, showing how you’re doing.
The well-balanced balance sheet
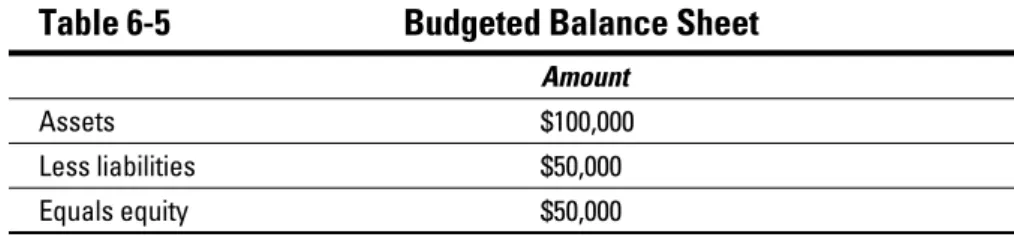
Your balance sheet is a fine indicator of business health. Table 6-5 shows a pretty darned healthy balance sheet.
Table 6-5 Budgeted Balance Sheet
Amount
Assets $100,000
Less liabilities $50,000
Equals equity $50,000
101
Chapter 6: What’s the Plan, Stan? Budgeting for a Better Bottom Line
As you review your balance sheet budget, keep in mind the goal is to main- tain enough assets to run your business, which includes production (if you make things), buying inventory (if you’re a retailer), or employing people (for manufacturing, retailing, or service businesses).
The balance sheet should include assets needed for selling and distributing your products. Managing your business generates liabilities, too (accounts payable, long-term debt, and so forth). That’s okay, as long as you have a plan to pay them.
If revenue doesn’t supply you enough of the best asset — cash — you need a plan to raise capital. Capital represents an investment in your business. If a business owner invests $20,000 into his business, the $20,000 is considered capital for the business. That means you likely are either issuing debt or sell- ing equity.
The incredible income statement
Most business owners are most interested in the income statement. The owner will typically plan this budget document first.
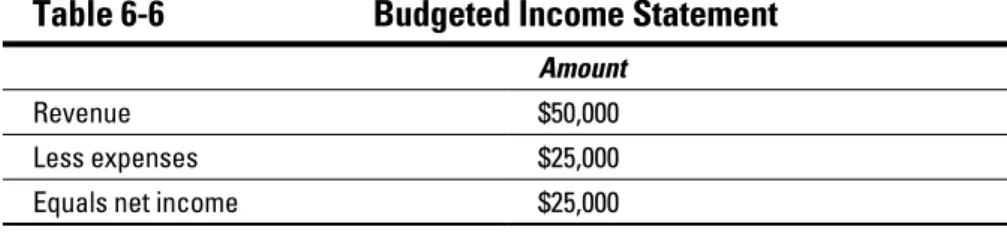
Table 6-6 shows a nice income statement.
Table 6-6 Budgeted Income Statement
Amount
Revenue $50,000
Less expenses $25,000
Equals net income $25,000
Here’s the thought process: You figure out how much revenue the company can generate. Then you subtract likely expenses from the revenue, and the result is your net income. After that, think about how cash will “move” (the cash flow statement) and where your company will get sufficient assets to operate (the balance sheet).
As you move forward in managing your business, don’t be surprised if cash flow becomes the most important budget item for you. Without enough cash flow, not much can happen.
Chapter 7
Constant Change: Variance Analysis
In This Chapter
▶ Comparing static and flexible budgets
▶ Recognizing variances and why they’re important
▶ Using variance analysis to improve financial performance
▶ Analyzing price variances to make decisions about spending
▶ Reviewing efficiency variances to improve productivity
I
n Chapter 6, you review how to set standard (budgeted) prices and rates in the planning process. You budget at the beginning of the year and then review your actual results at year-end. Don’t be surprised when your actual results are different from your standards. That difference is called a variance.When you budget, you necessarily make assumptions about total costs and levels of activity (also known as standard costs). Standard costs are based on projected prices and your planned levels of usage. If you manufacture blue jeans, you’ll determine the hourly rate you need to pay workers. You’ll also estimate the total number of hours they will work during the year. No one (not even giant corporations) has a crystal ball, so reality (actual cost) is guaranteed to vary from assumptions (standard cost).
Variance analysis amounts to a series of techniques used to spot changes that can happen on both the revenue side and the expense side. These changes can occur for practically any reason. For example, if a disaster affects sales, revenue goes down. If the cost of materials spikes unexpectedly, expenses go up.
Business is risky. You often see unfavorable variances, results that are poorer than you wanted. But sometimes results are better than expected, and you see favorable variances.
In this chapter, I introduce several types of variances methods. I go over the concept of management by exception. This concept raises red flags that call attention to business problems, including variances. I identify variances using a flexible budget. When a variance is found, I show how to determine if the variance is favorable or unfavorable.
When you can identify a variance and understand why it occurred, you can make changes in your business to improve your productivity and your profit.
The end result for you is a new, better set of assumptions, which operate until you do another variance analysis.
Variance Analysis and Budgeting
A flexible (flex) budget adjusts for changes in activity. A static budget assumes that the sale price, volume of sales, and all costs are fixed. The static budget does not change with any level of activity (like production or sales). In most situations a flexible budget is more useful than a static budget. That’s because your actual production and sales levels will likely be different from your budget.
Using management by exception to recognize large variances
Management by exception is a variance analysis method that identifies the largest variances between actual results and standard plans. The largest vari- ances need fixing; they are a priority for you.
Say your company makes leather coats that use a plastic zipper. As you review your actual and standard costs for the month, you notice that the actual price you paid for zippers is 20 percent higher than your planned price. None of your other variances for cost or revenue is greater than 1 to 2 percent. Something’s going on! The variance doesn’t tell you what happened, but it prompts you to investigate.
Management by exception is the red-flag method of variance analysis, and that 20 percent variance in the zipper price is a big red flag. It’s a large dif- ference that you need to investigate. It’s not only statistically significant, but also, if your product is tightly costed (a small margin in the price for profit), the price increase is eating into your margins.
105
Chapter 7: Constant Change: Variance Analysis
The increase may have happened because of a product shortage, meaning that your usual supplier couldn’t meet your needs, and you had to go to another supplier and pay a lot more. Find out why the exception happened so you can make changes to prevent such a variance in the future.
Possible changes might be
✓ Find a different zipper that won’t be subject to a product shortage.
✓ Find a different supplier who has a bigger inventory of the zipper you need.
✓ Find a cheaper zipper.
✓ Consider whether your business strategy is effective or not. Assume your leather coat’s budgeted cost is $75. If your actual cost is getting higher, maybe the $75 cost per coat isn’t a realistic budget amount.
Seeing the problem in using a static budget
A static budget (also referred to as a master budget) is a summary of operating and financial plans. After the budget is created, it doesn’t change with the level of activity (sales, production) in your business.
A static budget is the starting point for determining a reasonable profit for your business. But a static budget assumes one level of output that never changes. This can create problems that are fixed by using flexible budgeting.
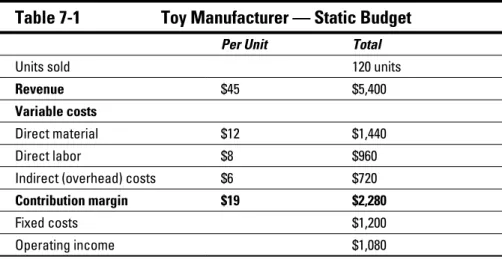
Table 7-1 shows a static budget for a toy manufacturer.
Table 7-1 Toy Manufacturer — Static Budget
Per Unit Total
Units sold 120 units
Revenue $45 $5,400
Variable costs
Direct material $12 $1,440
Direct labor $8 $960
Indirect (overhead) costs $6 $720
Contribution margin $19 $2,280
Fixed costs $1,200
Operating income $1,080
Your static budget assumes only one level of production: 120 units. But direct material, labor, and indirect (overhead) costs are variable costs. They change as production changes. (Actually, you should keep in mind that indi- rect costs can be fixed or variable.) If you produce more or less than 120 units, you will have a variance that is caused just by volume (production). In fact, there are three major types of variances you might come across:
✓ Volume variance: You produce more or less than planned. That may mean that you use more or less material than budgeted. You may also use more or less labor than planned.
✓ Price or rate variance: The price you pay for materials, or that rate you pay for labor costs, is different than what you budgeted.
✓ Sales variance: You sell more or less than planned.
Note an important difference: Volume variances are all about usage. Price or rate variances relate to the price you pay — regardless of how much you use.
Operating with operating income
Operating income is your profit from the day-to-day activities of running the business. A growing operating income is a measurement of a successful busi- ness. In Table 7-1, you subtract fixed costs from contribution margin to get operating income.
If you make toys, your operating income is derived from just toy produc- tion and sales. Other types of income are not considered operating income.
If your company happened to sell a building for gain, that gain wouldn’t be part of operating income. The gain on sale of the building is a line in the non- operating income section of the income statement.
Table 7-2 lists the actual results for toy manufacturing.
Table 7-2 Toy Manufacturer — Actual Results
Per Unit Total
Units sold 100 units
Revenue $50 $5,000
Variable costs
Direct material $10 $1,000
Direct labor $8 $800
Indirect (overhead) costs $5 $500
Contribution margin $27 $2,700
Fixed costs $1,000
Operating income $1,700
107
Chapter 7: Constant Change: Variance Analysis
There are some differences between Tables 7-1 and 7-2. The actual units sold were less than budgeted (100 versus 120 units). The actual sale price per unit was higher than planned ($50 versus $45). There were also some differences in costs per unit that generated a higher actual operating income ($1,700 versus $1,080 budgeted).
You can breathe a little easier. It appears that your new Malibu Margi Beach House and Fun Set is selling pretty well and costs a little less than you expected to produce.
Table 7-3 is a static budget variance breakdown for the toy company. It shows what happens when real-life results differ from planned results.
Table 7-3 Toy Manufacturer — Static Budget Variance
Actual Results Variance Static Budget
Units sold 100 units (20 units) 120 units
Revenue $5,000 ($400) $5,400
Variable costs
Direct material $1,000 ($440) $1,440
Direct labor $800 ($160) $960
Indirect (over- head) costs
$500 ($220) $720
Contribution margin
$2,700 $420 $2,280
Fixed costs $1,000 ($200) $1,200
Operating income $1,700 $620 $1,080
Talk about management by exception! There’s a giant variance in actual versus budgeted operating income. That’s a nice surprise, but be careful.
Surprises can go both ways.
Understanding favorable and unfavorable variances
Variances can be favorable or unfavorable. If you understand the differences, you can take action and improve your business.
Keep in mind that Table 7-3 displays static variances. These are variances between actual results and the static budget, and they suggest that a static budget has some limitations.
A favorable variance increases your operating income over the planned amount. A favorable variance occurs when actual spending is less than bud- geted. That’s a good thing. Also, a favorable variance occurs when you sell more units than planned (budgeted). That’s a good thing, too.
The flip side is an unfavorable variance decreases your operating income over the planned amount. When actual spending is higher than budgeted, the variance is unfavorable. Also, when actual sales are less than budgeted, the variance is unfavorable.
You always put the actual results on the left. To compute a variance, subtract the actual results (left) from the budgeted amounts (right). For example, here’s how you compute the Table 7-3 revenue variance:
Revenue variance = actual revenue – static budget revenue Revenue variance = $5,000 – $5,400
Revenue variance = -$400
Because this is a revenue variance, a negative number is unfavorable. You sold less than budgeted. If actual revenue were higher than budgeted, you’d get a positive number (more revenue than planned). For revenue or sales variances, a positive number is a favorable variance.
Yes, but now you’re asking, “What about a cost variance?” It’s the same process. Take the actual costs (on the left) and subtract the budgeted cost (right):
Direct material cost variance = actual material – budgeted material Direct material cost variance = $1,000 – $1,440
Direct material cost variance = -$440
Because this is a cost variance, a negative number is good; you spent less than planned. A negative variance is a favorable variance that increases your operating income over the plan.
You treat contribution margin and operating income in the same way as rev- enue: More actual activity is better (favorable). The positive variances for contribution margin and operating income in Table 7-3 are favorable.
109
Chapter 7: Constant Change: Variance Analysis
Opting for a flexible budget
A flexible budget adjusts or changes for different levels of activity (sales, pro- duction volume, and so forth). To me, this is more realistic.
It’s very unlikely that your budgeted sales volume will match the actual results exactly. Whereas you create a static budget at the beginning of a period, you put together a flexible budget at the end of the period, when actual sales volume results are known.
Put another way, the flexible budget is what your static budget would look like if you had a crystal ball and knew the actual level of sales in advance.
So now, to create your flexible budget, you take all the budgeted per-unit amounts from the static budget in Table 7-3 and multiply them by actual sales volume (100 units) rather than static budget sales volume (120 units).
Handling fixed cost in a flexible budget
Fixed costs hold true within a range of production. If you go above that range, you need to revise fixed costs as you need more capacity, and that’s likely to cost more. Understanding relevant range is critical if you want to plan investments in assets.
For example, if you use a machine that produces up to 15,000 units of prod- uct a month, the fixed costs for that machine are constant — as long as you don’t need to produce more than 15,000 units. If your production goes higher, you need to buy another machine.
Working a machine to capacity is a little like redlining the engine when you’re driving your car. Your car can run at 7,000 rpm for only so long. In time, it will break down because it’s not designed for that sustained level of use. The same is true for machines, tools, and equipment you use in your business.
You’re probably familiar with the relevant ranges for the equipment your company uses. And you very likely know that overworked machine tools wear out, and welding rigs must be “rested” to prevent failure. Computer printers specify monthly duty cycles in their sales literature.
For a flexible budget, use the static budget amount of fixed costs. If you go above your relevant range, you’ll need to rethink the fixed cost amount.
Consider if you need to invest in more fixed costs to maintain your higher level of production.
In Table 7-3, that is $1,200. To justify using the static budget amount, con- sider that actual production (100 units) was obviously within the relevant range for the static budget (120 units).
Reviewing the components of a flexible budget
The next two tables show two variances that you use for flexible budget anal- ysis. Table 7-4 shows flexible budget revenue and costs.
Table 7-4 Toy Manufacturer — Revenue and Cost Variance
Actual Results Variance Flexible Budget
Units sold 100 units None 100 units
Revenue $5,000 $500 $4,500
Variable costs
Direct material $1,000 ($200) $1,200
Direct labor $800 none $800
Indirect (over- head) costs
$500 ($100) $600
Contribution margin
$2,700 $800 $1,900
Fixed costs $1,000 ($200) $1,200
Operating income $1,700 $1,000 $700
The actual results column is the same as Table 7-3. The flexible budget column uses all of the per-unit revenue and cost amounts from Table 7-1 and multiplies each item by 100 units, the actual sales in units.
The variance column in the middle of Table 7-4 provides the flexible budget variances. For example, the flexible budget variance for revenue is $500.
Because that’s a positive number for revenue, it’s a favorable variance.
Contribution margin and operating income are also favorable variances because their variance amounts are positive.
The direct material variance is ($200). Because the number is negative for a cost variance, it’s favorable. The actual cost of $1,000 was less than the flex- ible budget cost of $1,200. The overhead cost and fixed cost variances are favorable variances. The variance for operating income is $1,000 favorable.
Now compare the differences between the flexible budget and your original static budget. This is called the sales volume variance. Remember that all of the per-unit revenue and cost amounts were the same between static and flexible budget. The only difference causing the variance is sales volume.
Table 7-5 shows a sales volume variance.
111
Chapter 7: Constant Change: Variance Analysis
Table 7-5 Toy Manufacturer — Sales Volume Variance
Flexible Budget Variance Static Budget
Units sold 100 units (20 units) 120 units
Revenue $4,500 ($900) $5,400
Variable costs
Direct material $1,200 ($240) $1,440
Direct labor $800 ($160) $960
Overhead costs $600 ($120) $720
Contribution margin
$1,900 ($380) $2,280
Fixed costs $1,200 none $1,200
Operating income $700 ($380) $1,080
If actual sales volume is less than planned, you have an unfavorable variance.
Also note that revenue, contribution margin, and operating income amounts are all less than planned. As a result, each of these items has an unfavorable variance also. The sales volume variance in total, the variance for operating income, is $380 unfavorable. You see the impact of selling less than
you planned.
The formula for static budget variance is
Static budget variance = flexible budget variance + sales volume variance Static budget variance = $1,000 + ($380)
Static budget variance = $620
Keep in mind that the numbers are taken from the operating income variance at the bottom of each table. A $620 static budget variance is a favorable vari- ance because it relates to income.
Investigating budget variances
Just like it says on the first page of this chapter, when you understand why you have a variance, you can make changes in your business to improve your productivity and your profit.
There are some likely reasons for variances, so after finding variances, you need to put on your thinking cap and figure out the causes.
Seeing the cause of a flexible budget variance
To understand why you have a flexible budget variance, keep in mind that both actual and flexible budgets use actual units sold. This means that the variance can’t be due to a difference in units sold; the variance must be due to something else. There are two likely causes:
✓ Price per unit: The $50 actual price per unit is higher than the $45 flex- ible budget price per unit. The static budget prices and costs are used for the flexible budget. So what happened? Maybe you decided to raise your actual price, based on customer demand or competitor pricing.
You were able to sell the same number of units (100 units) at a higher sales price! As a result, the revenue variance is a $500 favorable variance.
✓ Costs per unit: Note the $10 actual direct material cost per unit is lower than the static budget material cost of $12. The actual overhead is also lower than budgeted overhead cost ($5 versus $6). The material vari- ance ($200) and overhead variance ($100) are both negative. For cost variances, a negative number is a favorable variance.
Considering reasons for a sales volume variance
Analyzing sales volume variances is easier than analyzing flexible budget variances because the differences in the flexible budget and static budget are due only to the difference in sales. You use this analysis to see the impact of sales on other areas of your business.
In the toy manufacturing examples, the flexible budget was prepared with 100 units sold (actual sales). The static budget assumed 120 units sold.
The per-unit revenue and costs are the same for both actual and flexible bud- gets. Here are the primary reasons why actual sales may be lower than the static budget:
✓ Product demand: Overall product demand has declined. All sellers of the product (including you) see their sales go down.
✓ Competition: Increased competition has reduced your sales volume.
Some customers now feel that your price is too high when compared with your competitors’.
✓ Quality: Clients are buying less because of a concern about product quality.
✓ Unrealistic budget: The per-unit budget numbers from the static budget don’t reflect actual costs and accurate product prices.
113
Chapter 7: Constant Change: Variance Analysis
The same previously listed factors can explain higher actual sales as well.
For example, less competition, higher demand, or reduced competition can increase your sales.
Demand and competition are broader concerns. They relate to the outside world, such as events that are happening outside of your company. As a result, you have less control over demand and competition.
Quality and budgeting are areas that you can change more easily. You can improve the quality of your product or service. You can also do more research and improve the accuracy of your budgeting process.
Analyzing in Material Price and Efficiency Variances
This section separates material variance analysis from labor variances analy- sis. You find that your material variances are caused by differences in price (how much you pay) and by differences in usage (how much you use in production).
There is a similar pattern with labor variances. A labor price (rate) variance occurs when your actual price paid per labor hour is different from your plan. A labor efficiency variance occurs when you use more or fewer labor hours than planned.
If your analysis is more specific, you make better decisions. Those decisions help you reduce your costs or even eliminate them.
A price variance is the difference between actual and budgeted price for something you purchase. Here’s the formula for price variance:
Price variance = (Actual price – budgeted price) × (actual quantity) An efficiency variance is the difference between actual and budgeted quantities you purchased for a specific price. Here’s the formula for efficiency variance:
Efficiency variance = (Actual quantity – budgeted quantity) × (standard price or rate)
A standard is a planned amount per unit. Note that there are two terms in the efficiency formula: standard price and rate. This is a distinction you need to remember for cost accounting. Standard price refers to material variances. You pay a certain price for materials. Standard rate refers to labor variances. When you pay an hourly rate, you’re working with labor variances.
To summarize the distinction between the two variances, you either paid more or less than planned (price variance) or used more or less than planned (efficiency variance).
Applying price variances to direct materials
An obvious way to reduce your costs is to analyze the prices you pay for materials. Say you operate a bicycle factory, and you use aluminum to manufacture bike frames. During planning, you come up with a standard or budgeted price of $5 per pound for aluminum. When you review your actual costs, you find that the real price paid was $5.75 per pound. Assume you purchased 10,000 pounds of aluminum. Table 7-6 shows your material price variance for the year.
Table 7-6 Material Price Variance — Aluminum for Bikes
Actual Quantity × Actual Price Actual Quantity × Budgeted Price
10,000 lbs. 10,000 lbs.
Multiply by $5.75 Multiply by $5.00
Equals $57,500 (A) Equals $50,000 (B)
Material price variance (A) – (B) $7,500
The material price variance is $7,500 unfavorable because your actual costs ($57,500) were more than the actual quantity at budgeted price ($50,000).
The only difference in this variance is the price paid for aluminum.
Applying efficiency variances to direct materials
Another way to improve your business performance is to be more efficient —
“to work smart,” as the business cliché goes.
Looking at budgeted input quantity
During planning, you also determined a budgeted input quantity allowed for actual output of 12,000 pounds of aluminum for bike production. (Wow! That’s the longest title for a concept in this whole book.) This term multiplies the number of units you plan to produce by some amount of material per unit.
This is the calculation for amount of aluminum for the bikes:
115
Chapter 7: Constant Change: Variance Analysis
Budgeted input quantity= budgeted units produced × lbs. used in a unit Budgeted input quantity= 2,000 × 6
Budgeted input quantity= 12,000
To produce 2,000 bikes, you plan to use 6 pounds of aluminum per bike, or a total of 12,000 pounds. Assume that for the same 2,000 bikes produced, you used only 5 pounds of aluminum per bike (because you were so efficient, of course). This means that you only used 10,000 pounds of aluminum. Your material cost would be lower, which would increase your operating profit.
Table 7-7 shows your material efficiency variance for the year.
Table 7-7 Material Efficiency Variance — Aluminum for Bikes
Actual Quantity × Budgeted Price Budgeted Quantity × Budgeted Price
10,000 lbs. 12,000 lbs.
Multiply by $5.00 Multiply by $5.00
Equals $50,000 (A) Equals $60,000 (B)
Material efficiency variance (A) – (B) ($10,000)
A negative variance for a cost is favorable, so the material efficiency variance is favorable.
Look back at the price and efficiency variances in the last two tables. Here’s the flexible budget variance calculation for direct materials:
Flexible budget variance = price variance + efficiency variance Flexible budget variance = $7,500 + -$10,000
Flexible budget variance = -$2,500
You have a $7,500 unfavorable price variance and a $10,000 favorable effi- ciency variance. Because this is a cost variance, a negative number indicates less actual spending than planned, and that’s a good thing.
Laying out reasons for price and efficiency variances
The real reason you go through all of this analysis is to identify areas where you can improve. By “improve,” you want to reduce costs, increase demand, or raise prices to generate a higher profit.
Here are some reasons you might find a material price or efficiency variance:
✓ Material purchasing decisions: You’re able to negotiate a lower price per unit. You may find a new supplier with a larger supply of material.
To reduce their inventory, that supplier may be willing to sell at a lower price. These decisions may create a favorable material variance. On the other hand, a shortage of the material in the marketplace may mean that you pay more for materials. The additional spending may create an unfa- vorable variance.
✓ Personnel and hiring decisions: Due to a slow economy, you’re able to hire workers with the skill set you need, but for a lower hourly rate.
Also, you may have a staff that’s so productive they get work completed faster than you planned. Finally, you’re able to plan production so that workers don’t wait during setup time. Less setup time means more hours producing the product. Of course, higher wages, less productivity, and poor decisions may create an unfavorable variance.
Implementing price variances for direct labor
Use your price variance knowledge to improve operations. You manage a lamp manufacturer (you’re done with leather coats, toys, and bicycles).
You hire employees to run machinery and also perform more delicate tasks by hand.
During planning, you come up with a standard rate (the hourly pay rate) of
$25 per hour. Your actual labor rate is $22 an hour. During the year, you use 20,000 hours of labor to produce lamps. Table 7-8 shows your labor price variance for the year.
Table 7-8 Labor Price Variance — Labor Hours for Lamps
Actual Quantity × Actual Price Actual Quantity × Budgeted Price
20,000 hours 20,000 hours
Multiply by $22 Multiply by $25
Equals $440,000 (A) Equals $500,000 (B)
Labor price variance (A) – (B) ($60,000)
A negative variance for a cost is favorable, so the labor price variance is favorable. The actual labor price (hourly rate) was $22, versus $25 budgeted.
The actual quantity of hours is the same in both calculations.
117
Chapter 7: Constant Change: Variance Analysis
Sizing up efficiency variances for direct labor
You can easily get a sense of whether your staff is efficient. Calculate bud- geted input quantity allowed for actual output. Assume that you plan to use 7 hours of labor per lamp, and you actually produce 3,000 lamps. This is the labor hours needed to produce lamps:
Budgeted input quantity = budgeted units × hours per unit Budgeted input quantity = 3,000 × 7
Budgeted input quantity = 21,000
To produce 3,000 lamps using 7 hours of labor per lamp, you expend 21,000 hours of labor (see Table 7-9).
Table 7-9 Labor Efficiency Variance — Labor Hours for Lamps
Actual Quantity × Budgeted Price Budgeted Quantity × Budgeted Price
20,000 hours 21,000 hours
Multiply by $25 Multiply by $25
Equals $500,000 (A) Equals $525,000 (B)
Labor efficiency variance (A) – (B) ($25,000)
You end up with a favorable flexible budget variance of $25,000 for direct labor (hours):
Flexible budget variance = price variance + efficiency variance Flexible budget variance = -$