BOOK OF PROCEEDING
INTERNATIONAL CONFERENCE
ON GREEN TECHNOLOGY AND DESIGN
Bandung, 4 – 5 December 2019
Bale Dayang Sumbi
Institut Teknologi Nasional Bandung West Java - Indonesia
INTERNATIONAL CONFERENCE ON GREEN TECHNOLOGY AND DESIGN
GENERAL CHAIR : Dr. Nurtati Soewarno, Ir., MT.
CO-CHAIR : Maya R. Musadi, Ir., MT., Ph.D SECRETARY : Lisa Kristiana, ST., MT., Ph.D.
FINANCE CHAIR
• Dian Duhita, ST., MT.
EXHIBITS COMMITTEE
• Dr. Didin Agustian Permadi, ST., M.Eng
• Dr. Soni Darmawan, ST., MT.
PROGRAMME CHAIRS
• Vibianti Dwi Pratiwi, ST., MT.
• Arsyad Ramadhan Darlis, ST., MT.
LOCAL ARRANGEMENT COMMITTEE
• Lita Lidyawati, ST., MT.
PUBLICATIONS CHAIRS
• Agung Prabowo Sulistiawan, ST., MT.
• Ardhiana Muhsin Machdi, ST.,MT.
WEB MASTER
• Agus Wardana, S.Sos.
• Bhakti Herdianto REVIEWERS:
• Dr. Ir. Imam Aschuri, MT. (Indonesia)
• Dr. Ir. Dewi Kania Sari, MT. (Indonesia)
• Dr. Ir. Kusmaningrum, MT. (Indonesia)
• Dr. Dani Rusirawan, ST., MT. (Indonesia)
• Emma Akmalah, ST., MT., Ph.D. (Indonesia)
• Dr. Ir. Etih Hartati, MT. (Indonesia)
• Tarsisius Kristyadi, ST., MT., Ph.D. (Indonesia)
• Prof. Meilinda Nurbanasari, ST., MT., Ph.D. (Indonesia)
• Dr. Jamaludin, S.Sn., M.Sn. (Indonesia)
• Dr. Ir. Nurtati Soewarno, MT. (Indonesia)
• Dr. Waluyo, ST., MT. (Indonesia)
• Dr. Ir. Maya Ramadianti, MT. (Indonesia)
• Taufan Hidjaz, Drs., M.Sn. (Indonesia)
• Dr. Ing. M. Alexin Putra (Indonesia)
• Dr. Andri Masri, M.Sn. (Indonesia)
• Iwan Juwana, ST., M.EM., Ph.D. (Indonesia)
ORGANIZING COMMITTEE
EDITORIAL BOARD:
• Jeark A. Principe Ph.D (Filipine)
• Dr. Ekbordin Winijkul (Thailand)
• Tanakorm Sritarapipat, Ph.D. (Thailand)
• Lisa Kristiana, ST., MT., Ph.D. (Indonesia)
• Arsyad Ramadhan Darlis, ST., MT. (Indonesia)
• Vibianti Dwi Pratiwi, ST., MT (Indonesia)
• Agus Wardana, S.Sos (Indonesia)
• Agus Rianto Amd. (Indonesia)
ISBN:
First Print: December 2019 Publisher:
Penerbit Itenas Address:
Jl. P.K.H. Mustapha No. 23, Bandung 40124 Telp: +62 22 7272215, Fax: +62 22 7202892 Email: [email protected]
2019© All rights reserved
It is prohibited to quote and reproduce the contents of this book in any form and manner without permission from the publisher
Day Time Description Wednesday,
December 4
th2019
08.00 – 08.30 Registration
08.30 – 09.00 Welcome speech: ICGTD Chair, Rector of Itenas and Opening
09.00 – 09.45 Plenary Session: “Assessment of Solar PV Power Potential over Asia Pacific Region with Remote Sensing and GIS”
Jeark A. Principe, Ph.D (Philipine)
09.45 – 10.30 Plenary Session: "Emissions and Mitigation Scenarios for Residential Combustion of Solid Fuels in Developing Countries"
Dr. Ekbordin Winijkul (Thailand) 10.30 – 10.45 Coffee Break
10.45 – 11.30 Plenary Session: “Water Resource Management Framework For West Java Province, Indonesia”
Iwan Juwana Ph.D (Indonesia) 11.30 – 12.30 Ishoma Break
12.30 – 16.45 Parallel Sessions – as attached 16.45 – 19.00 Closing
RUNDOWN ICGTD
No. Name Institution Paper Topic Presentation Time Place
1 Niken Syafitri Institut Teknologi Nasional
Bandung Green
Automation 13.00
GSG Bale Dayang Sumbi Lt 1 (A) 2 Febrian Hadiatna Institut Teknologi Nasional
Bandung Green
Automation 13.15 3 Florentinus budi
setiawan Soegijapranata catholic
university Green
Automation 13.30 4 Waluyo Institut Teknologi Nasional
Bandung Green
Automation 13.45 5 Priyo Agus
Setiawan Politeknik Perkapalan
Negeri Surabaya Green Energy 14.00 6 Lita Lidyawati Institut Teknologi Nasional
Bandung Green Energy 14.15
7 Bagus Rizky
Pratama Budiajih Institute Technologi
Sepuluh Nopember Green Energy 14.30 8 Vibianti Dwi
Pratiwi Institut Teknologi Nasional
Bandung Green Energy 14.45
9 Rachmad Ramadhan Yogaswara
Universitas Pembangunan
Nasional (UPN) "Veteran" Green Energy 15.00 10 Lisa Kristiana Institut Teknologi Nasional
Bandung Green IT 15.15
11 Achmad Hizazi Universitas Jambi Green IT 15.30 12 Dewi Rosmala Institut Teknologi Nasional
Bandung Green IT 15.45
13 Diki Ismail
Permana Institut Teknologi Nasional
Bandung Green Energy 16.00
14 Yusup Miftahuddin Institut Teknologi Nasional Bandung Green IT 16.15 15 Yudi Widiawan Institut Teknologi Nasional
Bandung Green IT 16.30
16 Rifqi Finaldy Institut Teknologi Nasional
Bandung Green IT 16.45
17 Hafidz Dayu Aditya Institut Teknologi Nasional Bandung Green IT 17.15 18 Agus Hermanto Institut Teknologi Nasional
Bandung Green Energy 17.30
19 Meilinda
Nurbanasari Institut Teknologi Nasional
Bandung Green Energy 17.45
20 Alfan Ekajati Latief Institut Teknologi Nasional Bandung Green Energy 18.00 21 Lakshmanan
Gurusamy Universiti Malaysia
Sarawak (UNIMAS) Green IT 18.15
PRESENTATION SCHEDULE
No. Name Institution Paper Topic Presentation Time Place
22 Abu Arif Jalaluddin Universiti Malaysia Sarawak (UNIMAS) Green IT 18.30 23 Yanuar Z. Arief Universiti Malaysia
Sarawak (UNIMAS) Green IT 18.45
24 Nur Laela Latifah Institut Teknologi Nasional
Bandung Green
Building 13.00
GSG Bale Dayang Sumbi Lt 2 B 25 Riny Yolandha
Parapat
Technische Universität Berlin (TU-Berlin), Berlin, Germany
Green
Transportation 13.15 26 Erwin Yuniar
Rahadian Institut Teknologi Nasional
Bandung Green
Building 13.30 27 Ardhiana Muhsin
Machdi Institut Teknologi Nasional
Bandung Green
Building 13.45 28 Tiara Anantika Institut Teknologi Nasional
Bandung Green
Building 14.00 29 Wahyudi Institut Teknologi Nasional
Bandung Green
Building 14.15 30 Dwi Prasetyanto Institut Teknologi Nasional
Bandung Green
Transportation 14.30 31 Fred Soritua
Rudiyanto
Manurung Institut Teknologi Bandung Green Transportation 14.45 32 Tarsisius Kristyadi Institut Teknologi Nasional
Bandung Green
Transportation 15.00 33 Tarsisius Kristyadi Institut Teknologi Nasional
Bandung Green
Transportation 15.15 34 Reza Phalevi Institut Teknologi Nasional
Bandung Green
Building 15.30 35 Hendro Prasetiyo Institut Teknologi Nasional
Bandung Green
Building 15.45 36 Ratna Agustina Institut Teknologi Nasional
Bandung Green
Transportation 16.00
37 Jatmiko Wahyudi Regional Development
Planning Agency Suistanability
Environment 13.00
GSG Bale Dayang Sumbi Lt 1 (B)
38 Desti Santi Pratiwi Institut Teknologi Nasional
Bandung Suistanability
Environment 13.15 39 Nguyen Thi Kim
Oanh Asian Institute of
Technology (AIT) Suistanability
Environment 13.30 40 Agung Pramudya
Wijaya Institut Teknologi Nasional
Bandung Suistanability
Environment 13.45 41 Edi Wahyu Wibowo Politeknik LP3I Jakarta Suistanability
Environment 14.00
No. Name Institution Paper Topic Presentation Time Place
42 Taufan Hidjaz Institut Teknologi Nasional
Bandung Suistanability
Environment 14.15 43 Elvira Rizqita
Utami Institut Teknologi Nasional
Bandung Suistanability
Environment 14.30 44 Farah Fauzia
Raihana Institut Teknologi Nasional
Bandung Suistanability
Environment 14.45 45 Byna Kameswara Institut Teknologi Nasional
Bandung Suistanability
Environment 15.00 46 Ajeng Alya
Hidrijanti Institut Teknologi Nasional
Bandung Suistanability
Environment 15.15 47 Fenty Wastika Sari Institut Teknologi Nasional Bandung Suistanability
Environment 15.30 48 Yudi Adi Pratama Institut Teknologi Nasional
Bandung Suistanability
Environment 15.45 49 Jono Suhartono Institut Teknologi Nasional
Bandung Suistanability
Environment 16.00 50 Iredo Bettie Puspita Institut Teknologi Nasional Bandung Suistanability
Environment 16.15 51 Ronny Kurniawan Institut Teknologi Nasional
Bandung Suistanability
Environment 16.30 52 Yulianti Pratama Institut Teknologi Nasional
Bandung Suistanability
Environment 16.45 53 Maya Ramadianti
Musadi Institut Teknologi Nasional
Bandung Suistanability
Environment 17.00 54 Maya Ramadianti
Musadi Institut Teknologi Nasional
Bandung Suistanability
Environment 17.00 55 Soni Darmawan Institut Teknologi Nasional
Bandung Suistanability
Environment 17.15 56 Soni Darmawan Institut Teknologi Nasional
Bandung Suistanability
Environment 17.30 57 Rika Hernawati Institut Teknologi Nasional
Bandung Suistanability
Environment 17.45 58 Ida Wati Institut Teknologi Nasional
Bandung Suistanability
Environment 18.00 59 Caecilia Sri
Wahyuning Institut Teknologi Nasional
Bandung Suistanability
Environment 18.15 60 Fifi Herni Mustofa Institut Teknologi Nasional
Bandung Suistanability
Environment 18.30 61 Enni Lindia
Mayona Institut Teknologi Nasional
Bandung Suistanability
Environment 18.45
62 Maharani Dian Permanasari, M.
Ds., PhD.
Institut Teknologi Nasional
Bandung Green Design 13.00 GSG Bale
Dayang
No. Name Institution Paper Topic Presentation Time Place
63 Ibrahim Hermawan Institut Teknologi Nasional Bandung Green Design 13.15 Sumbi Lt 2 A
64 Maugina Rizki
Havier Institut Teknologi Nasional
Bandung Green Design 13.30
65 Dwi Novirani Institut Teknologi Nasional
Bandung Green Design 13.45
66 Mohamad Arif
Waskito Institut Teknologi Nasional
Bandung Green Design 14.00
67 Edi Setiadi Putra Institut Teknologi Nasional
Bandung Green Design 14.15
68 Sulistyo Setiawan Institut Teknologi Nasional
Bandung Green Design 14.30
69 Edwin Widia Institut Teknologi Nasional
Bandung Green Design 14.45
70 Agung Pramudya
Wijaya Institut Teknologi Nasional
Bandung Green Design 15.00
71 Gita Permata
Liansari Institut Teknologi Nasional
Bandung Green Design 15.15
72 M. Djalu Djatmiko Institut Teknologi Nasional
Bandung Green Design 15.30
73 Detty Fitriany Institut Teknologi Nasional
Bandung Green Design 15.45
74 Andri Masri Institut Teknologi Nasional
Bandung Green Design 16.00
75 Aditya Januarsa Institut Teknologi Nasional
Bandung Green Design 16.15
76 Bambang Arief
Ruby, Institut Teknologi Nasional
Bandung Green Design 16.30
Welcome to the 1st International Conference on Green Technology and Design. This conference takes place in Bandung, 4th December 2019 and become our first international conference in green technology and design.
It is our responsibility to contribute in the national development and sustainability, the Institut Teknologi Nasional (Itenas) Bandung through its Lembaga Penelitian dan Pengabdian kepada Masyarakat (LP2M) conducts this conference and draws upon the expertise of wide range of knowledge.
The ICGTD 2019 conference aims to promote research in the field of Green Energy, Green Building Green Automation, Green Transportation, Sustainability Environment, Green IT and Green Design, and to facilitate the exchange of new ideas in these fields among academicians, engineers, junior and senior researchers, scientists and practitioners. It also includes the plenary, keynote and invited speakers.
On behalf of Organizing Committee, it is a great pleasure to welcome you in Itenas Bandung and look forward to meeting you at ICGTD2019.
Warm regards,
Chair
Dr. Ir. Nurtati Soewarno M.T.
FOREWARD
ORGANIZING COMMITTEE ... i
RUNDOWN ICGTD ... iii
PRESENTATION SCHEDULE ... iv
FOREWARD ... ix
TABLE OF CONTENT ... x
Green Automation
1. Multimode Ultrasound Cleaner Design for Green Extraction Food Processing [Florentinus Budi Setiawan, Probo Y. Nugrahedi] ... 12. Development of Digital Simulation of Intelligent Electronic Devices Operating Platform for Digital Substation: An Overview [Lakshmanan Gurusamy, Yanuar Z. Arief, Mohd Hafiez Izzwan Saad] ... 5
3. IoT Thingspeak for Miniature Smart Grid Monitoring System [Waluyo, Charly Maulana Khafi, Febrian Hadiatna, Andre Widura] ... 11
Green Energy
4. Performance Analysis of comparison the conventional and Myring blade for n = 1 on the Savonius Current Turbine By Using CFD Approach [Priyo Agus Setiawan, Nopem Ariwiyono, Rini Indarti] ... . 165. Video Communication System Using LASER [Lita Lidyawati, Lucia Jambola, Arsyad Ramadhan Darlis] ... .... 20
Green IT
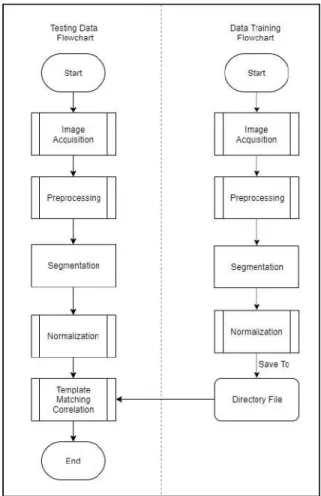
6. Lexicon-Based Sentiment Analysis For Analyzing Situational Variables [Dewi Rosmala, Hafidz Dayu Aditya] ... 247. Implementation of Template Matching Correlation Method in the Conversion System of Ancient Greek Letter Image into Modern Latin Letters [Rifqi Finaldy, Jasman Pardede, Irma Amelia] ... 29
Green Transportation
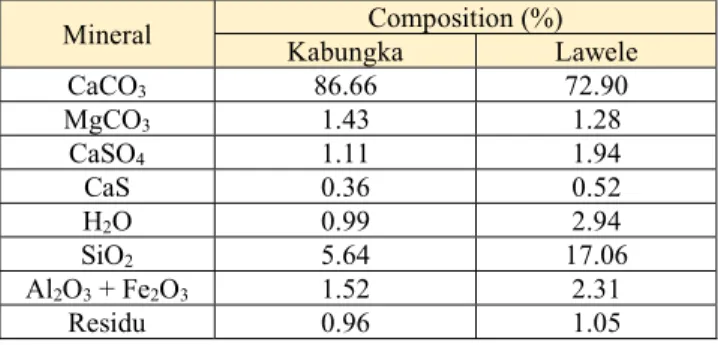
8. Production of Nano Asphalt Emulsion from Asbuton with Microemulsion Method [Riny Yolandha Parapat, Imam Aschuri, Reinhard Schomäcker] ... 39TABLE OF CONTENT
9. Prioritization of Road Accident Factors in Indonesia Using Combination of Delphi Method and Analytical Hierarchy Process
[Dwi Prasetyanto, Andrean Maulana] ... 45 10. Rural Vehicle for Agricultural Community Function in information Society Era [Fred Soritua Rudiyanto Manurung, Agus Sachari, Setiawan Sabana] ... 50 11. Analysis of Stress Against Airflow on Electric Car Bodies
[Tarsisius Kristiyadi,Alfian Eric Oktavianto, Fery Hidayat] ... 55
Suistanability Environment
12. Health Examinaton Facility Design Mobile For Elderly
[Hendro Prassetiyo, Arditya Ash Shidiq, Arie Desrianty, Lauditta Irianti] ... 64 13. Numerical Model on 3D Finite Element Method on Slope Stability with Tyre Wall
System in Road Slopes Reinforcement, West Papua
[Indra Noer Hamdhan, Desti Santi Pratiwi, Acep Reno Juniandri] ... 69 14. Regional simulation of surface ozone over Southeast Asia
[Nguyen Thi Kim Oanh, Didin Agustian Permadi] ... 75 15. Cymbalum Musical Instrument Design by Using Wasted Cans as Main Material
[Agung Pramudya Wijaya] ... 78 16. Mapping the Potential of Green Economic Development Jakarta City Based on
Green GRDP
[Edi Wahyu Wibowo] ... 81 17. The Symbolic Meaning of Mosque Architecture and Interior as Adaptation to the
Residential Environment, in the Social, Economic and Cultural Contexts in Lombok
[Taufan Hidjaz, Nurtati Soewarno, Detty Fitriany] ... 86 18. Study Program Levels of Community Participation in Waste Management of
Waste Bank Programs in Tani Mulya and Langensari Villages Bandung Barat District
[Adi Yudi Pratama, Iwan Juana] ... 102 19. A Study of Using Membranes Carbon Nanotubes Integrating with Ozone for
Reducing Natural Organic Matter (NOM) Jatiluhur Dam
[Jono Suhartono, Arnia Shintha, Imat Nur Alim] ... 108 20. Study of Several Natural Adsorbents Performance in Ethanol Purification
through Distillation Process - Continuous Dehydration
[Ronny Kurniawan, Yulianty Pratama, F.N. Hidayah, D. Asriyanti, Salafudin] ... 114 21. Tubular Celulotic biofilm production in double Chamber Reactor
[Yulianty Pratama, Amira Zakia Lutfi, Salafudin] ... 120
22. Investigation of PM10 Based On Landsat 8 Over Urban Area And Correlated With Ground Measurement
[Rika Hernawati, Soni Darnawan] ... 124 23. Human Error Contributions to Potential Incident in Laboratories at Institut
Teknologi Nasional
[Caecilia Sri Wahyuning] ... 128 24. Mathematical Modeling of Green Capacitated P-Centre Problem using Mixed
Integer Linear Programming
[Fifi Herni MUSTOFA, Yoanita Y. Mukti, Arief Irfan Syah Tjaja] ... 132 25. Accuracy Analysis of Aerial Photography Using PhotoModeler UAS and Agisoft
PhotoScan
[Soni Darnawan, Rino Erviana, Anggun Tridawati] ... 136 26. Estimation of Mangrove Biomass Parameters Using Aerial Photography
[Soni Darnawan, B. Heriyanto Aditya Gunawan, Anggun Tridawati] ... 139
Green Design
27. Eco-Design Packaging for Sustainable Farming Products
[Maharani Dian Permanasari] ... 144 28. Application of Design and Development of Pine Waste (Cone) Pine for
Construction Materials Interior Building and Furniture
[Ibrahim Hermawan] ... 146 29. Utilization Of Corkwood Fabric In The Making Of “Corkseat” With Surface
Mimicry Concept
[Maugina Rizki Havier] ... 153 30. Initial Design of Cisumdawu Toll Rest Area
[Dwi Novirani, Arief Irfansyah Tjaja, Dida Firdaus] ... 156 31. Parchment Skin: Alternative Materials for Manufacturing Environmentally
Friendly Products
[Mohamad Arif Waskito] ... 160 32. The Souvenir of Bebegig Sukamantri for Tourism Development in West Java
[Edi Setiadi Putra] ... 166 33. The Learning Medium Design of Creative Literacy for 4-6 Years Old Kids Based
on Used Oil Bottle Exploration
[Sulistyo Setiawan] ... 171 34. Optimizing learning facility on Interior Design Basic level Education
[Edwin Widia] ... 175 35. Design of Train Passenger Seat Economic Class using House of Ergonomic (HoE)
[Gita Permata Liansari, Arie Desrianty, M. Irfan Nurmawan] ... 182 36. Developing Web Based Employee Saving and Loan Cooperative’s Sistem
Information
[Achmad Hizazi, Salman Jumaili] ... 187 37. K-Means Algorithm for Monitoring The Existence Of Student In Class
[Yusup Miftahuddin, Irma Amelia Dewi, Asril Arbani Hamka] ... 195
Multimode Ultrasound Cleaner Design for Green Extraction Food Processing
Florentinus Budi Setiawan Electrical Engineering Soegijapranata Catholic University
Semarang, Indonesia [email protected]
Probo Y. Nugrahedi Food Technology
Soegijapranata Catholic University Semarang, Indonesia
[email protected] Abstract—Many alternative methods which are often
referred to as green methods have several advantages when compared to conventional methods. Some of these advantages are the use of fewer solvents, shorter extraction times, and their application can be carried out at lower temperatures.
These advantages will produce bioactive compounds in large quantities without destroying biological activities. In addition, alternative methods are also better at isolating the desired compound and reducing the formation of unwanted by products and reactions. Some of the advantages of the green method are the use of fewer solvents, shorter extraction times, and their application can be carried out at lower temperatures.
These advantages will produce bioactive compounds in large quantities without destroying biological activities. The advantage of the ultrasonic extraction is the use of low temperatures. Also as to maintain perishable compounds with high temperatures and prevent overall structural damage. The equipment designed consists of several parts, each of which is designed according to needs. The parts are signal-generator, system settings and modes, power booster, ultrasonic transducer and tank. The setting system functions to adjust the frequency, power gain and pre-set modes. Installed modes consist of ON-OFF mode, Alternate Frequency mode, Alternate Power and a combination of frequency and power.
Sonic electronic control system that is designed consists of a signal generator with a variable frequency. The signal generator output is fed to an amplifier whose gain is variable, so there is a combination of frequency and amplitude that can be adjusted. After the frequency and amplitude are set, it is then fed to a power amplifier that will drive the transducer with a fixed frequency and amplitude, with enough power. The controller functions to regulate the voltage, frequency and stability of the system. The installed mode that was previously set is saved in the control system. The sonication system is designed to have an ultrasonic frequency range from 20 kHz to 100 kHZ with pre-set and self-regulated modes based on previous experiments.
Keywords—ultrasonic, seaweed, frequency, multimode, cleaning
I. INTRODUCTION
Products with various contents of bioactive compounds are experiencing an increase in the number of enthusiasts because of its potential in improving health. One such product is seaweed, which in addition to consumption, can also be used as a functional product because of its bioactive compound content [1]. Seaweed has been used as a source of food since 3000 BC. In addition, seaweed can also be used as medicine [2]. Now, seaweed has become part of daily food, especially in countries in East Asia. Seaweed environmental
conditions are classified as extreme so that seaweed has a self-protection mechanism in the form of secondary metabolite production that has the ability of bioactivity [3].
Some of these bioactivity abilities are anti-aging, antioxidant, antimicrobial, anti-poliferative, anti-inflammatory, antidiabetic, and neuroprotective activity [4]. Seaweed antioxidant sources come from the polyphenol content, especially phlorotannin. Phlorotannin is the largest polyphenol group in brown seaweed formed from several phloroglucinol units[5].Bioactive compounds in seaweed can be extracted with conventional methods and with new alternative methods. Conventional methods include extraction using Soxhlet, solid-liquid extraction, and liquid- liquid extraction. The disadvantages of conventional methods are the use of too many and often toxic solvents and long extraction times [6].
Meanwhile, alternative methods which are often referred to as green methods have several advantages when compared to conventional methods. Some of these advantages are the use of fewer solvents, shorter extraction times, and their application can be carried out at lower temperatures. These advantages will produce bioactive compounds in large quantities without destroying biological activities. In addition, alternative methods are also better at isolating the desired compound and reducing the formation of unwanted byproducts and reactions [7].
Aim of this research is design a sonication system that suitable for several kind of food, especially for seaweed. The equipment have to set with different frequency, amplitude dan presentable mode.
II. ULTRASOUND EXTRACTION
A. Green Extraction Method
An extraction method can be called a green method if it fulfills some of the principles below [8]. These principles are not rules but innovative examples that can be followed.
1. Innovation using alternative resources from plants 2. Use alternative water-based or agro-solvents 3. Reduce energy consumption with innovative
technology
4. Reduce waste production
5. Reduce operating units and use safe and controlled processes
6. Leads to extracts that are not denatured and biodegradable and without contaminants
Some of the advantages of the green method are the use of fewer solvents (usually able to achieve a ratio of materials and solvents of 1: 100 for conventional methods) [9], shorter extraction times, and their application can be carried out at lower temperatures . These advantages will produce bioactive compounds in large quantities without destroying biological activities. In addition, alternative methods are also better at isolating the desired compound and reducing the formation of unwanted byproducts and reactions [10].
B. Ultrasound Assisted Extraction
UAE is an extraction method that is assisted by the use of ultrasonic waves. Ultrasonic waves are waves with frequencies above the human hearing capacity that is between 20 kHz to 100 kHz [11]. Unlike electromagnetic waves, ultrasonic waves are mechanical waves that can penetrate solid, gas and liquid media. When passing through the liquid media, the waves will cause negative pressure in the liquid. Then if the pressure exceeds the tensile strength (tensile strength) of the liquid, bubble formation will occur.
Cavitation or bursting of bubbles can occur when bubbles are in high ultrasonic fields [12]. As a result of cavitation is the rupture of particles so that it helps the release of bioactives from the biological matrix. This increases the efficiency of extraction due to an increase in mass transfer by an internal diffusion mechanism [13].
Ultrasonic devices that can be used for extraction are divided into 2 types namely ultrasonic water bath (indirect sonification) and ultrasonic probes (direct sonification). The difference between the two is the operating conditions and how ultrasonic waves affect the sample. For ultrasonic water baths, they usually operate at a frequency of 40-50 kHz and at a power of 50-500 W and the sample is submerged in an ultrasonic bath. Whereas ultrasonic probes usually operate at a frequency of 20 kHz only and the sample is not submerged, but the probe is submerged in the sample.
The advantage of the UAE is the use of low temperatures so as to maintain perishable compounds with high temperatures and prevent overall structural damage). In addition, the UAE can use a variety of solvents that are only needed in small amounts so that they are environmentally friendly. When compared with conventional methods, the time required for extraction with ultrasonic is less and the yield produced is more so that the extraction runs efficiently . Then the costs needed for the tools tend to be smaller than other alternative methods.
C. UAE Application
The large ultrasonic cleaner is a wonderful industrial ultrasonic parts cleaner tank. It has very wide applications both in commercial and industrial parts cleaning and degreasing. Especially for massive cleaning work the production lines in factories. In general, there are specific applications as follows. Commercial Large Ultrasonic Parts Cleaner including musical instruments and lab equipment such as laboratory instruments and glassware cleaning. And medical instruments cleaning in hospitals. And it is a wonderful large ultrasonic parts cleaner for golf clubs. In Electronic and Optical Industry, producing the PCB circuit board, PC motherboard and optical parts cleaning. In Auto Parts Cleaner for automotive Maintenance, Ultrasonic is
using for parts cleaner of carburetors, engine parts, fuel injectors, filters and diesel injectors. Ultrasonic also applied on Gun Parts Cleaner for weapons production. It is good for cleaning various gun parts, such as pistol parts, rifle parts, and bullets cleaning. Hardware Industrial Cleaning and Parts Degreasing use ultrasonic for precision bearing parts, sealing parts, machine tool accessories cleaning, etc.
Application of UAE use for extraction of bioactive compounds from seaweed showed that it is usually used mainly for the extraction of polyphenolic compounds. The samples used were seaweed consisting of several species including Hormosira banksii, Ascophyllum nodosum, Laminaria hyperborea, Ecklonia cava, Sargassum muticum, Codium tomentosum, Osmundea pinnatiefa, and Laurencia obtuse.
From some of the literature obtained, it can be seen that the ultrasonic frequencies that are often used are in the range of 20-50 KHz. While the variation of the power used ranges from 150 to 750 watts. Extraction of polyphenol compounds from brown seaweed Hormosira banksii was reported by Dang et al., (2017). The parameter conditions observed were frequency of 50 kHz, power of 150-250 W, use of 70%
ethanol by 50 mL, temperature of 30-50 ° C and extraction time for 20-60 minutes. From these various parameter conditions, the optimum yield of polyphenols of 23.12 ± 1.01 mg / g db was obtained using a power of 150 W, a temperature of 30 ° C and an extraction time of 60 minutes.
Kadam et al., (2014) reported the extraction of various bioactive compounds such as polyphenols, phosocytes, and uronic acid in brown seaweed species Ascophyllum nodosum. The parameter conditions used were a frequency of 20 kHz, a power of 750 W, the use of a distilled water and HCl 0.03 M of 40 ml and an extraction time of 25 minutes.
In the literature, there is no mention of the temperature used.
Under these parameter conditions, the optimum yield of polyphenols, phosocytes, and uronic acids was 139.73 mg GAE / g db; 86.63 mg / g db; 117.44 mg / g db. The solvent used to produce the optimum yield is 0.03 M HCl.
Two species of brown seaweed, Ascophyllum nodosum and Laminaria hyperborea, were observed by Kadam et al.
(2015) to determine which species produced the largest yield of polypnol and laminarin. The parameter conditions used are the same for both species, namely frequency of 20 kHz, power of 750 W, use of solvents in the form of 200 mL aquades and 0.03 M HCl and extraction time for 15 minutes.
In that study, there was no mention of the extraction temperature used.
Of the two species observed, the optimum yield of polyphenols and laminarin was found in Laminaria hyperborea of 0.365 ± 0.039 mg / PGE db and 6.240 ± 0.008% db. The results were obtained using 0.03 M HCl as a solvent. Whereas with the same parameter conditions, the optimum yield of polyphenols and laminarin in Ascophyllum nodosum species was 0.156 ± 0.014 mg / PGE db and 5.822
± 0.343% db.
III. METHOD
The equipment designed consists of several parts, each of which is designed according to needs. The parts are:
Signal generator
System settings and modes
Power booster
Ultrasonic Transducer
Tank
The function of each system can be described as follows.
The signal generator is designed to generate sinusoidal signals with frequencies that vary from below 20 kHz to 100 kHz. Frequency is generated by sinusoids which are near pure with constant amplitude. The frequency is regulated by the system settings provided to the operator and comes from automatic mode with a predetermined pattern.
The setting system functions to adjust the frequency, power gain and pre-set modes. Installed modes consist of ON-OFF mode, Alternate Frequency mode, Alternate Power and a combination of frequency and power. The power amplifier functions to produce a signal with a larger current for the ultrasonic transducer. Large power is needed to produce ultrasonic vibrations that will produce the expected amount of bubbles. Ultrasonic transducer functions to produce vibrations with frequencies that are in accordance with predetermined settings. The resulting vibration must be able to vibrate like a container, so as to produce enough bubbles. The reservoir is made of stainless steel which is able to vibrate with ultrasonic frequencies. The thickness of the material is designed so that the power transmitted through the transducer can vibrate the body wall.
Fig. 1. Sonication System
Yakut et.al se power unit to produces an amplitude- modulated signal across the transducers, where envelope of the modulated signal has 100 Hz, but the carrier frequency is 28 KHz. The maximum voltage observed across the transducers on their experiment is about 600Vpp. Dynamic range of voltage value changes between 500V and 600V during cleaning operation [14].
Fig. 2. Amplitude Modulation Sonication System
Sonic electronic control system that is designed consists of a signal generator with a variable frequency. The signal generator output is fed to an amplifier whose gain is variable, so there is a combination of frequency and amplitude that can be adjusted. After the frequency and amplitude are set, it is then fed to a power amplifier that will drive the transducer with a fixed frequency and amplitude, with enough power.
The controller functions to regulate the voltage, frequency and stability of the system. The installed mode that was previously set is saved in the control system.
Fig. 3. Electronic Control System
The automatic mode provided can be set or the existing mode. The following are examples of the modes installed in the system. ON-OFF mode will produce a signal with a frequency of 28 kHz which will be active periodically every one millisecond. Alternate frequency mode will produce outputs with frequencies that alternate between 20 kHz and 40 kHz. Power alternate mode will produce power mode which alternates between full and half power mode.
Fig. 4. On Off Mode
Fig. 5. Alternate Frequency Mode
Fig. 6. Alternate Power Mode
IV. CONCLUSION
The sonication system is designed to have an ultrasonic frequency range from 20 kHz to 100 kHz with pre-set and self-regulated modes based on previous experiments. Mode of sonication design can be set based on seaweed characteristics. Signal processing can be applied to controller in order to obtain optimum cleaning for seaweed before further process.
ACKNOWLEDGMENT
This research obtains fund competitive grants from the Higher Education, Ministry of Research and Higher Education, Indonesia 2019 fiscal year and is part of the research of sonication method for food processing
REFERENCES
[1] Holdt, S. L., & Kraan, S. (2011). Bioactive compounds in seaweed : functional food applications and legislation. Journal of Applied Phycology, 23, 543–597. https://doi.org/10.1007/s10811-010-9632-5 [2] Pal, A., Kamthania, M. C., & Kumar, A. (2014). Bioactive
Compounds and Properties of Seaweeds — A Review. Open Access Library Journal, 1–17. https://doi.org/10.4236/oalib.1100752
[3] Jithesh, M. N., Rayorath, Æ. P., Hodges, Æ. D. M., Critchley, A. T., Craigie, Æ. J. S., & Norrie, Æ. J. (2009). Seaweed Extracts as Biostimulants of Plant Growth and Development. Journal of Planth Growth Regul, 28, 386–399. https://doi.org/10.1007/s00344-009- 9103-x
[4] Wang, H. D., Li, X., Lee, D., & Chang, J. (2017). Potential biomedical applications of marine algae. Bioresource Technology, (May). https://doi.org/10.1016/j.biortech.2017.05.198
[5] Eom, S. H., Kim, Y. M., & Kim, S. K. (2012). Antimicrobial effect of phlorotannins from marine brown algae. Food Chem Toxicol, 50(9), 3251–3255. https://doi.org/10.1016/j.fct.2012.06.028
[6] Kadam, Shekhar Umakantrao, Tiwari, B. K., & Donnell, C. P. O.
(2013). Application of novel extraction technologies for extraction of bioactives from marine algae School of Biosystems Engineering , Agriculture and Food Science Centre , University College Dublin ,.
Journal of Agricultural and Food Chemistry.
https://doi.org/10.1021/jf400819p
[7] Duarte, K, Justino, C. I. L., Gomes, A. M., & Rocha-santos, T.
(2014). Green Analytical Methodologies for Preparation of Extracts and Analysis of Bioactive Compounds. Analysis of Marine Samples in Search of Bioactive Compounds (Vol. 65). Elsevier B.V.
https://doi.org/10.1016/B978-0-444-63359-0.00004-5
[8] Chemat, F., Vian, M. A., & Cravotto, G. (2012). Green Extraction of Natural Products : Concept and Principles. International Journal of
Molecular Sciences, 13, 8615–8627.
https://doi.org/10.3390/ijms13078615
[9] Lee, S., Kang, M., Moon, S., Jeon, B., & Jeon, Y. (2013). Potential use of ultrasound in antioxidant extraction from Ecklonia cava. Algae, 28(4), 371–378.
[10] Duarte, Kátia, Justino, C. I. L., Pereira, R., Freitas, A. C., Gomes, A.
M., Duarte, A. C., & Rocha-santos, T. A. P. (2014). Trends in Environmental Analytical Chemistry Green analytical methodologies for the discovery of bioactive compounds from marine sources.
Trends in Environmental Analytical Chemistry, 3–4, 43–52.
https://doi.org/10.1016/j.teac.2014.11.001
[11] Kadam, Shekhar U, Tiwari, B. K., Smyth, T. J., & Donnell, C. P. O.
(2014). Optimization of ultrasound assisted extraction of bioactive components from brown seaweed Ascophyllum nodosum using response surface methodology. ULTRASONICS SONOCHEMISTRY.
https://doi.org/10.1016/j.ultsonch.2014.10.007
[12] Luque-García, J. L., & Luque De Castro, M. D. (2003). Ultrasound: A powerful tool for leaching. TrAC - Trends in Analytical Chemistry, 22(1), 41–47. https://doi.org/10.1016/S0165-9936(03)00102-X [13] Vilkhu, K., Manasseh, R., Mawson, R., & Ashokkumar, M. (2011).
Ultrasound Technologies for Food and Bioprocessing, 345–368.
https://doi.org/10.1007/978-1-4419-7472-3.
[14] Yakult, M.,Tangel, A., Tangel, C., (2009). A Microcontroller Based Generator Design for Ultrasonic Cleaning Machines, Journal of Electrical and Electronics Engineering, Instanbul University, Vol.9 Number 1, pp.853-860.
.
Development of Digital Simulation of Intelligent Electronic
Devices Operating Platform for Digital Substation:
An Overview
Lakshmaman Gurusamy Dept. of Electrical and Electronic Eng.
Faculty of Engineering Universiti Malaysia Sarawak
(UNIMAS) Kota Samarahan, Sarawak, Malaysia
Yanuar Z. Arief Dept. of Electrical and Electronic Eng.
Faculty of Engineering Universiti Malaysia Sarawak
(UNIMAS)
Kota Samarahan, Sarawak, Malaysia [email protected]
Mohd Hafiez Izzwan Saad Dept. of Electrical and Electronic Eng.
Faculty of Engineering Universiti Malaysia Sarawak
(UNIMAS)
Kota Samarahan, Sarawak, Malaysia [email protected]
Abstract—The key goal in the operation of electrical power system is to maintain the energy balance between generation and demand in an economical manner. Intelligent Electronic Devices (IEDs) is a generic name that covers various protection control, metering and monitoring devices that uses microcontroller technology and is collectively known as substation automation systems (SASs). The thrust towards the digital substation came from the replacement of the old electromechanical and analogue electronic protection systems to digital power systems protection systems using digital signals, digital signal processing and digital communication systems.
Hence a future research and innovation challenge to the digital substation will be how to improve power system operation and control (e.g. of the system frequency, reactive power balance, etc.) using the IED data and the control room digital signal processing to intelligently handle operation and control. It is whole new area of avenues for which the digital substation may provide solutions. This paper gives an overview of a digital substation development using digital simulation of IEDs operating platform.
Keywords—intelligent electronic devices, digital substation, substation automation system, digital signal, digital communication system
I. INTRODUCTION
The key goal in the operation of electrical power system is to maintain the energy balance between generation and demand in an economical manner. Intelligent electronic devices (IEDs) is a generic name that covers various protection control, metering and monitoring devices that uses microcontroller technology and is collectively known as substation automation systems (SASs) [1]. The thrust towards the digital substation came from the replacement of the old electromechanical and analogue electronic protection systems to digital power systems protection systems using digital signals, digital signal processing and digital communication systems. Hence a future research and innovation challenge to the digital substation will be how to improve power system operation and control (e.g. of the system frequency, reactive power balance, etc.) using the IED data and the control room digital signal processing to intelligently handle operation and control. It is whole new
area of avenues for which the digital substation may provide solutions.
The digital substation comprises of three distinct levels of operation. The first is the Process Level [2.3]. The process bus connects the large variety of electronic sensors embedded in the substation apparatus used for real time measurements of the substation apparatus such as circuit breakers, transformers, incoming and outgoing power lines or underground cables.
Communicate through the process bus to intelligent protection relays, phasor analysis devices, etc., which may immediately process the data coming in from the primary apparatus with embedded electronic sensors. The communication is enabled by the IEC 61850 station bus [2,3] which is the internationally agreed standard that makes communication between present and new sensors and IEDs to communication with domain specific data model handling all communication within the substation, allowing a large amount of data to be transferred within a substation, and between the substation and the control center. The third level is the gateway level, as shown in Fig. 1. It depicts the evaluation of SAS from conventional to present.
The measurement of the system parameters such as voltage and current are done using electronic voltage transformers (EVT) and electronic current transformers (ECT). Optical fibers circled round the high voltage line allows for the measuring of line current by observing the line magnetic field produced angular shift of the polarized light circling inside the optical loop [3].
The Protection and control level is the second of the three levels. Fig. 2 depicts a typical station control area by Alstom [4]. These contain the devices between the process level and the substation and control system devices. The IEDs are critical to intelligently evaluate the state of the substation, to assist in the operation and control of the interconnected power grid, they are all interconnected by the IEC 61850 communication systems made up of optical fibers. The IEDs may perform important functions such as protection, point on wave switching supervision and other tasks through the process bus.
The components found in the protection and control level include digital protective relays, operator user interface,
synchronization units, switches and Ethernet network, security applications.
The third level is the Station Control Area, which is similar but more than the older SCADA system. It allows data to be transferred to remote operators and keep a real time observation on the digital substation. It allows multiple clients to exchange data, wide area communication with other substations, and peer to peer information sharing.
The Converters are used to convert analogue signals that the electronic sensors (e.g. ECT, EPT, pressure sensor, etc.) capture into digital form. The Merging Units perform digital signal processing, including sampling, on the digital data from the converters to produce clean signals, to produce time-synchronized and accurate values.
II. SUBSTATION AUTOMATION SYSTEMS
Substation automation systems (SASs) are based on a lot of dedicated software stored in pieces of hardware that belong to a set of substation secondary components. In a simple approach, using more recent technology, SASs are composed mainly of three groups of devices plus two Local Area Networks integrated. The process devices group includes analog/digital converters and actuator devices to make the transition between SAS and high voltage equipment. The interface devices group covers a set of Intelligent Electronic Devices (IEDs) that receive and process signals coming from high voltage equipment. The application devices group includes all computers and other components required to run control functionalities and to communicate with internal and external subsystems.
The most important functions of a SAS are [1]:
(a) Control:
◦ Selecting, opening and closing circuit breakers and disconnectors.
◦ Blocking and unblocking control commands.
◦ Giving release information to circuit breakers and disconnectors for securing the opening and closing actions.
(b) Monitoring:
◦ Showing substation configuration with position indication (open or closed) of circuit breakers and disconnectors based on signals coming from their own position contacts.
◦ Acquiring and process data coming from power transformers and other primary equipment related to condition operation.
◦ Displaying substation events including information regarding switchgear opening and closing actions due to any external cause, such as the activation/operation of a protective relay.
(c) Alarming:
◦ Announcing to a substation operator all adverse conditions that may represent a risk to substation integrity.
◦ Preventing trouble with SAS operation.
(d) Measurement:
◦ Acquiring and showing current values of electrical or other relevant parameters.
◦ Giving indications of energy flows through substation primary equipment and transmission lines.
(e) Setting and monitoring of protective relays:
◦ Allowing changes on operating parameters of protective relays.
◦ Giving alarm signals when any undesirable condition may affect the right relay performance.
(f) Control and monitoring of the auxiliary power system:
◦ Displaying screens/drawings showing the configuration of the auxiliary power system.
◦ Allowing selection and execution of control commands.
◦ Driving automatic transfer switches.
◦ Managing interlocking logics.
◦ Supervising AC/DC power source conditions.
◦ Giving alarm signals from abnormal conditions.
(g) Voltage regulation:
◦ Monitoring actual voltage value on the power system.
◦ Changing the position of the tap‐changer of power transformers.
◦ Giving alarms and signals.
In summary, SASs take care of all data acquisition process, control, monitoring and alarming functions associated with high voltage apparatus that belong to primary equipment, as well as similar functions associated with secondary substation systems. The control and monitoring information is presented to the operator through a graphical interface that shows overview diagrams, control means, alarms, measurement, trends and sequences of events displayed on user‐friendly screens.
III. CURRENT ISSUE AND POSSIBLE SOLUTION
Electrical substations have typically used miles of copper cabling for point-to-point communication connections. Copper is expensive, has limited signaling capacity, and crucially in the environment of a substation, introduces potential safety risks to workers and equipment.
This outdated method of signaling results in expensive testing and maintenance, leaving critical information stranded until periodic checks are made on location. If supervisors were able to leverage the data in real time, it would be a huge opportunity to improve grid integrity and reduce power interruptions.
By replacing copper wires with fiber-optic connectivity, or wireless communication systems, new IEDs appearing in the market (which are IEC 61850 compatible), it is possible to lay the foundation for automated, high-performance digital substations. Then we collect and analyze data through cloud-based software, arriving at solutions that optimize power-grid asset health.
Condition data is collected via the Industrial Internet of Things in real time around the clock
Device solutions to filter and analyze the data, using cloud-based software.
Develop predictive algorithms provide information regarding maintenance and risk reduction
The insights are also used to optimize performance and improve the substation’s efficiency and cost effectiveness
The issues should be addressed in digital substation are listed as following.
How do we develop better recording of better power transformer and circuit breaker (CB) currents and maintenance strategies, with monitoring done by electronic current and potential transformers (ECT and EVT)?
How do we develop better protection schemes and applications which are time saving in analyzing the faults and relaying?
How do we could analyze and have a better understanding of power Quality (PQ) disturbances, automated correction action at the substation, and the impact on the customers?
The possible solution to overcome the above issues are as follows.
Development of a smart city Digital Substation incorporating and testing of new IED on the RTDS (Real Time Digital Simulator) based simulation before prototype fabrications are deployed.
Design process level network and simulate for real time and reliability.
Test the network’s dynamic performance for both power system fault and communication system fault.
Better operation and control of the power system using the facilities offered by the Digital Substation.
Relevance to power utility company and local government
The benefits of digital automation
Utilities can drive their assets harder
Predictive maintenance identifies issues before they occur
Longer asset lifespans
Reduced environmental footprint
Improved worker safety and asset protection
Smaller physical footprint of future substations Business benefits for utilities and industry
Reduction of copper cable-associated costs by up to 80 percent
Transformer downtime reduced by up to 50 percent
Breaker downtime reduced by up to 50 percent Reduced spending on maintenance
Training of power utility engineers and electrical engineering students on digital substation practices and maintenance and development as new IEDs appear on the market.
IV. PROPOSED DESIGN
A digital substation design and implementation is based on a complex communication architecture as shown in Fig.
3 and is typically grouped into three areas, namely (i) The station control area (ii) The protection and control level section area and (iii) The primary equipment process level area.
The expected design had to be first a RTDS (Real Time Digital Simulator). The reasons for this are outlined below:
RTDS-based studies identify the causes and stabilizing oscillations of synchronous generator phases, both large and small oscillations, and stabilizing these instabilities using, for instance, the STATCOM power systems stabilizers. An extension to these areas of research, training and studies will be a platform for selecting new IEDs (Intelligent Electronic Devices) as new products complaint with the IEC6180 communication standard.
RTDS-based simulation of digital substation communication network shall seek to incorporate a strategy for intelligent fault diagnosis using the data communicated from the Merging Units placed around the substation.
The simulator digital simulator software has to possess a number of properties and functions to make the simulators indeed a useful tool in evaluating IEDs [1]:
• Ability to take field recordings from variety of other IEDs installed in substations so that the operation of new IEDs can be evaluated and compared to operation of others by subjecting it to the recorded waveforms and observing its reaction.
• Suitability for modeling exact power system conditions and events in a given utility and testing IEDs under the circumstance closely resembling actual scenarios.
• Capability of doing sensitivity studies through gradually changing input waveform characteristics to better understand IED behavior and performance under many diverse operating conditions.
• Possibility for using experimental means to tune relay settings for complex applications allowing full benefit of various application options provided by different products.
• Practicality of automatically performing thousands of tests for a large number of scenarios making the evaluation rather comprehensive while assuring a low cost.
The portable simulators are used for periodical routine maintenance tests of the substation protection IEDs, end-to- end tests during commissioning, trouble-shooting tests aimed at quick system restoration. This way the in-service IED performance can be evaluated and a judgment can be
made regarding volume purchases for replacement of the old equipment with advanced IEDs such as the one selected for field evaluation. Since it takes considerable time to take all the equipment to the substation, and to set up, wire, and calibrate the test system before the actual testing can be done, the process of setting up the equipment as well as using it has to be short and straightforward. An example of a portable simulator layout is shown in Fig. 4.
The reason as to why RTDS is very essential as there are lots of important issues to be considered in selecting IEDs.
Thus, in this proposed design we would need to consider the following issues:
The substation automation system will have an abundance of redundant data collected by IEDs connected to the same switchyard. Can this redundancy be utilized to improve consistency and accuracy of substation database?
The substation automation system will introduce an additional processing power at the substation level. Can this processing power be utilized to perform pre- processing for some EMS functions, which will make them more robust and accurate?
The substation automation system will collect large amount of data related to the given events and/or equipment operation. Can this data be automatically processed to reduce the time and inconsistency of data analysis in comparison with the situation where different operators are doing this analysis manually?
The substation automation system will provide integration of data coming from different IEDs but related to the same events and/or equipment operations.
Can this variety of data from different IEDs be utilized to perform better overall analysis of the given events and/or equipment operations?
To better monitor power system equipment and disturbances, data coming from the following IEDs is considered in Fig. 5: digital fault recorders (DFRs), digital protective relays (DPRs), power quality meters (PQMs), remote terminal units (RTUs), sequence of event recorders (SERs), programmable logic controllers (PLCs), circuit breaker monitors (CBMs), operator meters (OPMs).
V. CONCLUSION
As a result of the discussion presented in the paper, the following defining elements of the substation automation strategy can be outlined:
New IEDs are complex and have variety of settings and functions. To be able to utilize them, one needs to very well understand their application features and performance properties. The use of different digital simulators can help in the process of testing and evaluating the IEDs and making more informed decisions.
Selecting new IEDs and integrating them in one substation automation system can offer variety of benefits. To make sure the benefits are fully explored, one needs to think of new functions that can add the value to substation automation solutions.
Present practices regarding IED evaluation and new function specification are very limited and need to be changed to accommodate new business needs in the industry. The new IEDs need to be selected to enhance reliability and security of power system operation as well as operator productivity and decision making.
ACKNOWLEDGMENT
The authors would like to thank Universiti Malaysia Sarawak (UNIMAS) for the financial support under Small Grant Scheme (F02/SGS/1784/2018) in facilitation and support in completing this research work.
REFERENCES
[1] Evelio Padilla, Substation Automation Systems- Design and Implementation, John Wiley & Sons Ltd, 1-e, 2016.
[2] Ikbal Ali, Mini S. Thomas, Sunil Gupta & M. Suhail Hussain, IEC 61850 Substation Communication Network Architecture for Efficient Energy System, Energy Technology & Policy, An Open Access Journal, vol.2, pp.82-91, 2015.
[3] Ren, Y., Xiao, Y., Jin, Y. and Peng, S. (2013) Impact of IEC 61850 on substation design, Journal of International Council on Electrical Engineering 3(3), 210–214, China.
[4] Alstrom Brings to market Digital Substation 2.0 featuring Smart Technologies, available at http://www.alstom.com/press- centre/2014/8/alstom-brings-to-market-digital-substation-20- featuring-smart-technologies/
[5] Mladen Kezunovic, Yufan Guan, Chenyan Guo, Mohsen Ghavami,
“The 21st century Subtation Design: Vision of the Future,” 2010 IREP Symposium- Bulk Power System Dynamics and Control- VIII (IREP), Aug, 2010.
[6] NIST Framework and Roadmap for Smart Grid Interoperability Standards, Release 1.0, available at Standards, Release 1.0, available at
http://www.nist.gov/public_affairs/releases/smartgrid_interoperability .pdf.
[7] M. Kezunovic, “The Next Generation of Monitoring and Control Systems Using Synchronized Sampling Technology and Multifunctional IEDs,” 40th Annual Hawaii International Conference on System Sciences (HICCS 40), Waikoloa Village, Big Island, Hawaii, January 2007.
[8] Jonathan W. Stahlhut, Gerald Thomas Heydt and Judith B. Cardell,
“Power System “Economic Alarms”, IEEE Trans. Power Systems, vol. 23, no. 2, pp. 426-433, May 2008.
[9] Schlabbach, J. and Rofalski, K‐H. (2014) Power System Engineering:
Planning, Design, and Operation of Power System and Equipment, 2nd Edition, Wiley‐VCH, Weinheim.
[10] UCA International Users Group (2004) Implementation Guideline for Digital Interface to Instrument Transformers using IEC 61850–9‐2 (Available at
http://iec61850.ucaiug.org/implementation%20guidelines/digif_spec_
9‐2le_ r2‐1_040707‐cb.pdf, accessed May 26, 2015).
[11] Deng Yong, Mi Weimin, Ren Xiaohui, Xu Dandan & Chen Zhengping, Integrated Modelling Between Smart Substation and Dispatch Automation System, Journal of International Council on Electrical Engineering, vol.4. No.4. pp. 287-292, 2014.
[12] H.S. Fernandes, M.B. Moura, P.C. Gaudelupe, M.Z. Fortes and N.C.
Fernandes, Software to Manage Transformers Using Intelligent Electronic Devices, Ingenieria E investigation, vol.36, No.1, pp. 85- 89, April 2016.
Fig. 1. Evaluation of SAS from conventional to present [1].
Fig. 2. The station control area [4].
Fig. 3. Digital substation classification [1].
Fig. 4. The station control area [4].
Fig. 5. Data sources in a substation automation system [5].
IoT Thingspeak for Miniature Smart Grid Monitoring System
Waluyo
Department of Electrical Engineering Institut Teknologi Nasional Bandung
Bandung, Indonesia [email protected]
Andre Widura
Department of Electrical Engineering Institut Teknologi Nasional Bandung
Bandung, Indonesia [email protected]
Charly Maulana Khafi Department of Electrical Engineering
Institut Teknologi Nasional Bandung Bandung, Indonesia [email protected]
Febrian Hadiatna Department of Electrical Engineering
Institut Teknologi Nasional Bandung Bandung, Indonesia [email protected]
Abstract—At present, energy sources are running low with advancing technological advancements so that renewable source energy needed that can fulfill human necessary. One of them is a solar power plant that can be used for energy sources that utilize solar radiation. With the progress of technological development, where information and communication can be accessed through the internet, it easy to find out information from a system by implementing the internet of things system on solar power plants. The design of loading miniature smart grids with photovoltaic systems uses the thingspeak website monitoring system carried out using NodeMCU as a control to monitor and Arduino IDE software to run the program. The monitored parameters were voltage and current from solar panels, batteries, and loads. From the results of the monitoring on the voltage and current parameters on the solar panel, it was obtained the average energy of 405 Wh with measurements from 08:00-16:00. Based on the results of the design, the monitoring system could operate adequately, as indicated by several sending data parameters.
Keywords—arduino, current, internet of things, photovoltaic, voltage
I. INTRODUCTION
Solar power generation is energy that utilizes solar energy to become electrical energy. Where, at present, energy sources are running low, and technological advances ar
![Fig. 1. Evaluation of SAS from conventional to present [1].](https://thumb-ap.123doks.com/thumbv2/123dok/11601511.0/25.918.277.679.77.352/fig-1-evaluation-sas-conventional-present-1.webp)
![Fig. 3. Digital substation classification [1].](https://thumb-ap.123doks.com/thumbv2/123dok/11601511.0/26.918.263.728.84.413/fig-3-digital-substation-classification-1.webp)