The economic cycle of one country with a major impact on world trade will also have an impact on the others, especially its major trading partners. As it progresses to the next stage, the crisis can be extended as the impact spreads within the region, and the impact returns to the country of origin in the second round. On the other hand, the impact of the next phase, in addition to indirect spillover effects from other economic slowdowns, may lead to a weakening of domestic demand for certain countries.
In the global perspective, the model includes trade across countries. The main advantage of the model is that we can calculate the impact of certain shocks originating from one country or a group of countries to the others, transmitted through global trade networks. The growth rate from freight and insurance and import duties is considered to be equal to the growth rate for imports from national accounts. In this way, the difference between the total intermediate input and output is put into statistical discrepancy; therefore, the total rate of intermediate input will equal the total intermediate product.
The ratio r1 that was obtained was multiplied by each digit in the rows so that the sum of the rows equaled the total intermediate effect target. Get the row total and then compare it to the subtotal target to get the s1 ratio. Multiply the s1 ratio by the specified value of each column, keeping their column sum equal to the total intermediate input target.
For Fij = final demand vector (total sum of consumption and investment); and Qjs = export vector to Hong Kong, to the EU and to the Rest of the World.
METHODOLOGY
Bij is the part of the matrix that reflects the amount of output required from country i (country of origin) to produce one unit of value added in country j (country of destination). The Leontief coefficient matrix can help analyze the output correlation between countries through their trade in intermediate goods. Where LHi is the exporting country of Hong Kong; gij is the share of re-exports from country i (source) to country j (destination) to the total import from the corresponding country i to Hong Kong; and hjg is the share of product type g (intermediate, consumption and capital goods) to total re-exports to country j.
RESULT AND ANALYSIS
- Aggregate Asian IO: Backward and Forward Linkages
- Aggregate AIO: Dependency Rate of Value Added
- AIO Sectors: Backward Linkages and Forward Linkages
- The Simulation of United States Slowdown
- The Simulation of Export Slowdown to EU
- The Impact Simulation of China’s GDP Slowdown
- Robustness Check
This amount is in line with the increase in Indonesia's domestic consumption as a source of economic growth. Sector that had the highest BL, Trade and Transport Sector, had the highest import linkage with China; while the largest FL for this sector (intermediate good exports) is with the United States. On the other hand, textile, leather and its products sector had the largest import content with Malaysia; while it is the highest FL with Korea and the United States.
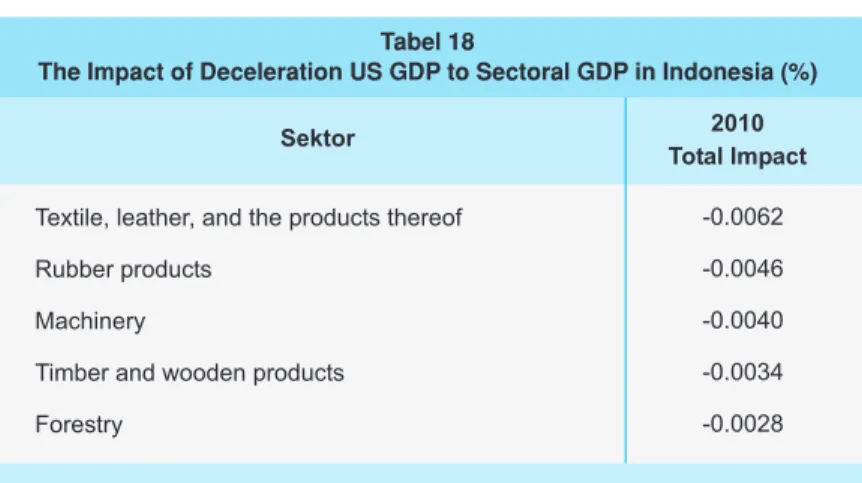
Global economic slowdown in 2009 triggered by the United States became one of the causes of the economic slowdown in other regions. We use the AIO table to simulate the impact of a 1% reduction in US GDP on other countries. The slowdown of the US economy also reduced other economies except for China and Taiwan.
According to their bilateral trade data, 12% of Taiwan's exports go to the United States, making the United States the second largest export destination. Meanwhile, the impact of the United States' slowdown on China increased significantly between the two periods. This was consistent with the fact that the United States was the most important export destination for China, accounting for 17.7% of its total exports in 2010.
The growing relationship between China and the United States was initiated by China's entry into the WTO in 2001 and the abolition of the multi-fiber regime by the United States in 2005. If US GDP slowed by 1%, then textiles, leather and the products there from Sector will slow about 0.0062. This was in line with the decline in Indonesia's non-oil exports to the EU.
The impact of China's slowdown on the United States is the largest and has increased significantly between the two years. This was in line with the increasing rate of export performance from United States to China which is constantly increasing by 542%; from only USD 16.2 billion in 2000 to USD 103.9 billion in 2011. Our simulation showed that the interdependence between China and the United States economy increases over the two periods.
We do the robustness check by comparing the BL coefficient consistency with the number of RAS iterations. The result showed that backlinks on each country have good consistency, see table 23. This was in line with our article in which exports of Indonesian products contributed less to value added.
CONCLUSIONS
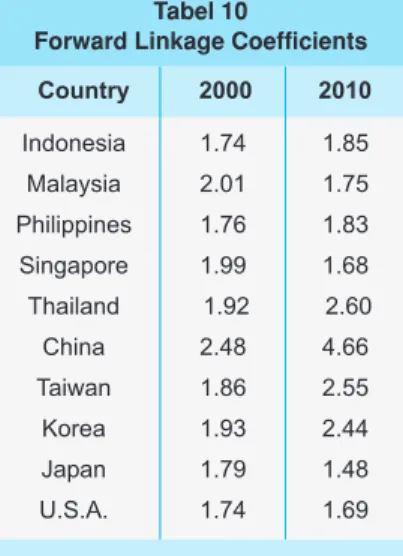
In general, they also found that all AIO countries experience stronger linkages with China, while their linkages with Japan have decreased. Moreover, the commodity exported from Indonesia was mainly used for China's domestic demand, and not for export. First, Indonesia should be more concerned about the long-term global weakening and slowdown of China's domestic demand.
The majority of commodity types on Indonesia's exports and the low indicator of ITT show that Indonesia's role in the global trade relationship is still low.
ASIAN INTERNATIONAL INPUT OUTPUT (AIO)
UPDATING TABEL AIO
CONVERSION TABLE, AIO 24 SECTORS