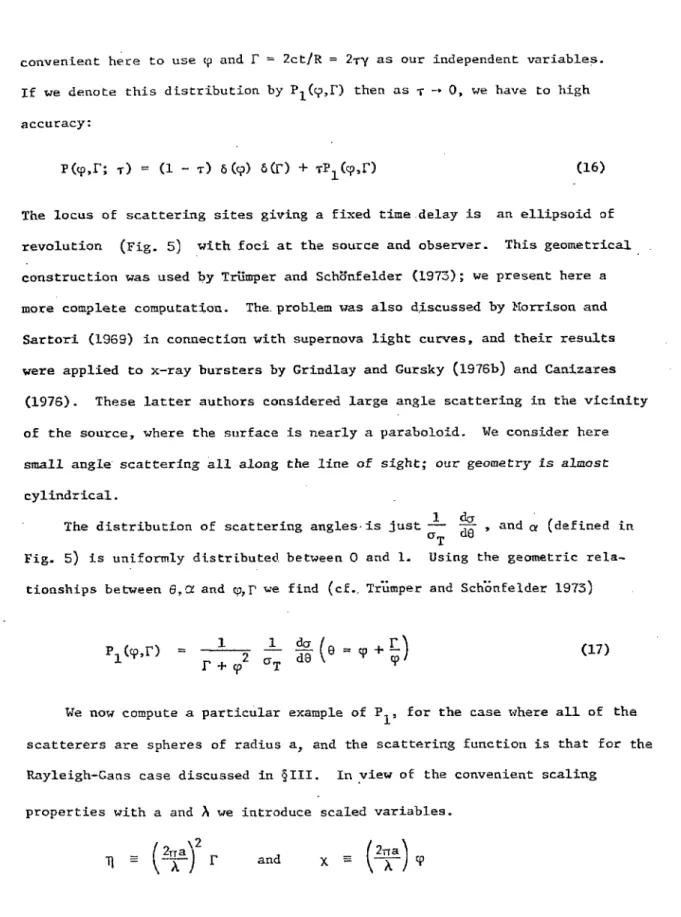
We have analyzed in detail the general problem of the propagation of a radiation pulse through a uniform medium containing small angular scatterers. He hypothesized that all of the X-rays observed from the Crab Nebula came from the pulsar, and that the diffuse, unpulsed component was a halo of scattered radiation. Before proceeding with detailed calculations, we estimate the magnitude of some effects of X-ray scattering by grains.
We simply require that a significant fraction of the mass be in each of these two populations.
THE SCATTERING OF X-RAYS BY GRAINS
That is, in the small angle limit:. where j l is a spherical Bessel function of the first kind. In subsection (a), we derive some exact formulas for the second and fourth moments of the distribution of . The distribution for T +~ is smooth and independent of the shape of the scattering function; this property was indicated in the comments after equation (7).
This description would be a good fit in the x-ray splinter problem if all the dust in the galactic plane was concentrated in a few dense clouds; which could then each be considered a single spreader.
COMPARISON WITH OBSERVATIONS
In the previous article, Figure 2 clearly shows how the time constant of the decay decreases with increasing energy. Unless grain scattering can be disregarded, astrophysical models that produce a softening tail near the source are unnecessary. These observations are fully consistent with the scattering of a small portion of the X-rays by 1 µ grains.
Normalized halo intensity distribution of individually scattered photons when integrated over time (Rayleigh-Gans case).
PAPER 2
We have investigated the excitation of microwave lines in the vibrational ground state of the SiO molecule in the expanding envelope of cool Mira-type stars. For reasonable physical parameters, RIR is much larger than Rc, and 8µ photons appear to dominate the excitation of spin levels. As mentioned in §II, we normally assumed ~V=l km s-l. except for the calculations for V a.
Three values of the asymptotic velocity are considered: 6, 10 and 17 km s-1, covering the range observed in the non-maser SiO and OH and H lines. Radial variation of the excitation temperature (Tex) and the optical depth perpendicular to the vector of radius (T) are shown in figure 1 for three values of fM. Because of the larger area lying on the sky at greater distances from the star, most of the flux in the J=l+O line arises between 5 and 2 x 10¹⁶.
It is instructive to try to make a simplified analytical model for the generation of the microwave lines in SiO. Half arises because in the real molecule - half of the excitations to the excited vibrational state lead to spontaneous decay back to the original level. As mentioned in § II, the near decoupling of the odd and even J levels is extremely important.
At large distances from the star, the gradient of the flow velocity is asymptotically zero. S is the number of SiO molecules that pass through the inner edge of the cloud per second, that is. Three curves are shown for each parameter, each corresponding to a different value of the mass loss rate of SiO molecules from the star.
2 Curves of excitation temperature (Tex) and tangential optical depth (T) of the J;l+O transition as a function of R, the radial distance from the center of the star.
PAPER 3
INTRODUCTION
In an earlier paper (Morris and Alcock 1977, hereinafter referred to as Paper I), we analyzed the excitation of the non-maser emission of SiO molecules in oxygen-rich stellar envelopes. In this paper we look at the excitation of the masers in the rotation lines in the first and second excited vibrational rational states of SiO. Geballe and Townes (1974) proposed radiation pumping mechanisms that rely on random coincidences between different lines in the SiO spectrum.
Their model cannot explain the richness of the SiO mass spectrum, and in particular fails to explain the J = 1 ~ 0 line in the second excited vibrational state. They did not discuss the maser in the second excited vibrational state, and unfortunately their numerical calculations suffer from an incorrect value of the transition velocity b,.v = 2. Deguchi and Iguchi (1976) discussed the radiative pumping of the SiO maser, but did not adequately describe their pumping cycles.
They did not account for saturation of the masers, although Kwan and Scoville had shown how saturation in one transition could lead to an inversion in the next higher transition. The correct description of the shape of the 1612 MHz OH maser lines was given by EHtzur et al. In the next section, we briefly summarize the key observations discussed in this paper.
In §IV we describe in some detail the numerical calculations of the excitation of masers in SiO and present the results. In §v, the pump cycles for each of the masers are carefully discussed and the results compared with observations.
THE OBSERVATIONS
In general, the structure of the lines in the different transitions is the same for each star. Of these, only Elitzur et al. 1975) discussed the shape of the microwave line that would be observed at infinity for their model of the 1612 MHz OH masers. IBB is the specific intensity of the background radiation of 3 °K, and r is the radius of the central star.
In these models we will take S(r) = -1, a simplification that is not strictly consistent with the expected variation of the optical depth. However, in most situations the variation of S(r) is much slower than the variation of the exponentials in the integrands, so this assumption does not qualitatively change the results. In the limit that the Doppler width of the line can be neglected, the function y defined in equation (6) becomes a step function and then PB = P.
Figll: res.3, 4 and 5 we plotted PA and PB for a representative set of parameters. In the case of rE = 0.5, most of the acceleration takes place close to the star. Therefore, cr) is large near the maser, and largest. As the acceleration region moves away from the star, the logarithmic gradient near the inversion approaches zero (see Figure 2) and the gain becomes predominantly radial.
This is because only material directly in front of the star (see Fig. 1) can contribute. Figures 5a and Sb show the dependence of the line shape on the location of the inversion, starting from the stellar surface to the bulk of the acceleration.
THE NUMERICAL CALCULATIONS
We found that collisions, especially collisions between the rotational planes of the ground vibrational state, and between the ground and first excited vibrational state, were very important. It is important to estimate what fraction of the population exists in levels with J > 12. For the two models described, - 1/2 of the population is pumped into these higher levels in the region where the masers work· e.
We investigated the dependence of the sublevel populations at two special radii." on the parameters cr V and T • these calculations are. Figures 6 and 7 show the course of the optical depth with radius at those transitions that reverse, and in Figures 8 and 9 are given calculated line profiles for masers in the J = 1 ~ .o transition of the first excited vibrational state We look only at the excitation11 of the v = l maser transitions and then discuss the v = 2 masers.
We consider that collisions dominate the scattering between rotational levels and the radiation field determines the excitation of vibrational levels. The fractional inversion we can expect from this process would be the ratio of the collision rate between the vibrational scales to the speed within the scales, multiplied by exp{hv/kT }• It turns out that the masers saturate strongly. In both models, the amplification of the stellar continuum and spontaneous emission were comparable.
However, the excitation temperature of the v = 1 scale decreases due to the lower flux of 8 µ, and therefore the fractional populations of the sublevels at the v = 1 scale decrease. Thus, we expect the temperature of the SiO antenna to vary approximately inversely as the square of the distance from the source.
DISCUSSION
In Paper I we found that the fractional abundance of SiO was very low in the envelope at large radii. The blackbody color at 2000 0 K is (3.5µ] - [llµJ 1.1.) The requirement (in our model) for a high SiO content should be contrasted with the conclusion of Paper I that the number density of SiO molecules is .in. Abundance calculations by Vardya (19C6) and Tsuji (1973) also indicate that in coal-rich atmospheres most of the silicon is in the SiO form.
This clearly suggests that SiO is processed very efficiently into grains as the temperature in the coil drops to - 1000 °K or below. In this way we can have the high abundance of SiO near the star, needed to effectively pump masers7, and the lower abundance of SiO in the outer regions of the envelope. Most of the available silicon is in the form of gaseous SiO between the stellar surface and - 2 X 10¹⁴ .
The Salpeter mechanism will produce a strongly aspheric velocity field in the region where the SiO masers operate, which is somewhat inconsistent with the symmetry of the lines. Tiie pumping cycle is only effective if most of the available silicon is in gaseous SiO. The family of flow velocity curves (solid lines) and the logarithm of their logarithmic derivatives (dashed lines) for the analytical form given by equation (12). The dashed line shows the {appropriately scaled) current velocity obtained by Goldreich and Scoville (1976).
The optical depths in the lowest three rotational transitions of the v = 1 ladder (solid lines) and the lowest two in the v = 2. The optical depths in the lowest three rotational transitions of the v = 1 ladder for model II.
