195
This work is licensed under a Creative Commons Attribution 4.0 International License
Response Surface Modelling of the Mechanical Properties of Oil Palm Empty Fruit Bunch Fibre
Reinforced Polyester Composites
Chinwe Evangeline Kamma
1*1Department of Sustainable Environment and Energy Systems, Middle East Technical University, Northern Cyprus Campus 99738 Kalkanli Guzelyurt via Mersin 10 Turkey
*Corresponding Author: [email protected]
(Received 02-09-2022; Revised 16-09-2022; Accepted 21-09-2022) Abstract
This work presents a systematic approach to evaluate and study the effect of fibre aspect ratio and fibre volume fraction on the tensile strength, ultimate elongation, modulus of elasticity, strength and impact energy of oil palm empty fruit bunch fibre reinforced polyester composites. Hand-lay-up technique was used in the fabrication of the composite materials. Response surface methodology was used to study the effect of the selected factors on the mechanical properties of oil palm empty fruit bunch fibre reinforced polymer-based composite. The optimum fibre aspect ratio and fibre volume fraction for each mechanical property was determined. From the result of optimization, the maximum value for tensile strength obtained was 12.15N/mm2 at a fibre aspect ratio of 64 and fibre volume fraction of 26%. The maximum value for ultimate elongation was obtained as 1.939% at a fibre aspect ratio of 124 and fibre volume fraction of 50%, the maximum value for modulus of elasticity was obtained as 1509 N/mm2 at a fibre aspect ratio of 124 and 34% volume fraction. The maximum value for toughness was obtained as 0.12 N/mm2 at a fibre aspect ratio of 89 and a volume fraction of 30%. The maximum value of impact energy was obtaine
196
d as 307.72J/m (5.77ft-lbs/in) at 28% fibre volume fraction and an aspect ratio of 69. The maximum value of impact strength was obtained as 4.57N/mm2 at a 36% volume fraction and an aspect ratio of 64.
Keywords: Polyester Composites, Response Surface Model, Mechanical Properties, Oil Palm Empty Fruit Bunch
1 Introduction
Polymer matrix composites are composed of a variety of lengths of fibres bonded by a polymer matrix [1]. They are designed such that the mechanical loads to which the structure is subjected in service are supported by the reinforcement. According to [2], composites are materials that consist of two or more chemically and physically different phases separated by a distinct interface. The different systems are combined such that a system is achieved in which useful structural or functional properties are non-attainable by any of the constituents alone.
The wake of engineers' uses of composites started when it was discovered that they have great advantages above steel and its alloys such as low weight and higher resistance, high fatigue strength and faster assembly [3, 4].
Composites are used extensively as materials in making aircraft, electronic devices, packaging, vehicles, home building, etc. They comprise the matrix and reinforcing materials and their use until now has been more traditional than technical. They have served many useful purposes for a long but the application of the material for the utilization of natural fibres as reinforcement in polymer matrix took place quite recently [3]. These natural fibres have advantages such as low density, low cost, low weight, high toughness, acceptable specific length recovery, biodegradability and enhanced energy recyclability [5, 6].
The fruit bunches which are by-products of oil processing are presently industrial wastes. The oil palm empty fruit bunch can be found littered everywhere in oil palm producing areas of Nigeria since the wastes have presently no industrial application.
Recently, because of the environmental impact of using oil palm empty fruit bunch as
197
fuel has been discouraged in Nigeria [18]. Its handling in the oil mills consumes energy.
However, oil palm empty fruit bunch used locally to prepare local delicacies like ukwa (breadfruit), ugba (oil bean salad), abacha (slice cassava, popularly called African salad), and in rare cases now, in the production of local black soap because of the large potassium content of the bunch. This study hopes to help find a place for the usefulness of oil palm empty fruit bunch as fibre reinforcement for composites.
Several factors affect the performance of natural fibre reinforced polymer composites such as fibre-matrix adhesion properties, fibre length, fibre volume fraction, and fibre aspect ratio [7]. Composites are generally a combination of heterogenous materials [21], thus to improve the fibre-matrix interaction and adhesion, the fibre is mercerized to remove certain impurities and reduce the hydrophilic characteristics of the fibre leaving the fibre with a rough surface [4, 8-16]. The mixing procedures, type of compatibilizers, and processing and treatment conditions of fibres and the polymer resin have been shown to affect the quality of interfacial bonding between the fibre and the resin [17, 18]. Recent work conducted by Athijayamani et al. highlighted the effects of fibre length and content on composite tensile and flexural strength. The study showed that the tensile and flexural strength of a hybrid roselle/sisal polyester composite increased with increased fibre length and fibre content, while the impact strength reduced correspondingly [19].
Sapuan et al. studied the mechanical properties of woven banana fibre reinforced epoxy composites and found that the composites can be used for household utilities [20].
The industrial potentials of oil palm empty fruit bunch have not been well addressed in the literature to our knowledge. Therefore, the purpose of this work is to evaluate the tensile, and impact strength of short random oil palm empty fruit bunch fibre reinforced polyester composites for application in the automobile industry.
The high demand for low density, low cost, high impact resistance, and renewable and biodegradable materials have led to many works and research on fibre-reinforced polymer composites. However, there has not been rife work in modelling and optimization of the mechanical properties of oil palm empty fruit bunch fibre reinforced polyester composites concerning their fibre aspect ratio and volume traction using the response surface model.
198
This work hopes to address the above limitation by studying the effect of fibre aspect ratio and fibre volume fraction of oil palm empty fruit bunch fibre reinforced polyester composites on the mechanical properties and modelling the mechanical properties of oil palm empty fruit bunch fibre reinforced polyester composites using surface response technology to determine the optimum fibre aspect ratio and volume fraction for optimum mechanical performance.
2 Research Methodology
A brief description of the materials and methods to be used for the preparation of composites is given in this section. The chemicals to be used for various fibre treatments are discussed. A brief description of the different analytical techniques to be used for the characterization of fibres and composites is also given in this section.
2.1 Oil Palm Empty Fruit Bunch Fibre (RPF)
The Oil Palm Empty Fruit Bunch Fibre used in this work was obtained from the eastern part of Nigeria where the crop is grown for consumption as well as for commercial use.
2.2 Unsaturated polyester resin
General Purpose-grade Unsaturated polyester resin (HSR 8113M), was obtained from Nycil Industrial Chemicals, Ota, Ogun State Nigeria.
2.3 Chemicals for fibre modification
The Sodium hydroxide used for fibre surface modification is of reagent grade and was obtained from new concepts laboratories Obinze, Imo state, Nigeria.
2.4 Fibre preparation and surface modification
Extraction of the OPEFBF and preparation was carried out as follows: The fruits from the bunch were extracted mechanically leaving behind an empty fruit bunch, which was then retted utilizing tank water retting for about three days, and the fibres so obtained were sun-dried.
199 2.4.1. Mercerization
For preparing randomly oriented oil palm empty fruit bunch fibre composites, the fibres were treated with NaOH of 6wt% at 90mins at room temperature. Finally, the fibres were repeatedly washed and then dried in air and oven. Fibres of an average diameter of 0.41mm and fibre volume fractions of 10%, 20%, and 30% and fibre aspect ratios of 24.39,73.171, and 121.9512 were obtained.
2.4.2 Preparation of OPEFBF-polyester reinforced composites and test specimens Randomly oriented OPEFBPF-polyester composites containing fibres of specific length and fibre volume fraction were prepared by hand lay-up method using a stainless steel sheet female mould with a marble tile male mould. Before the composite preparation, the mould surface was polished well and a mould-releasing agent (mirror-glaze) was applied to the surface of the mould. General unsaturated polyester resin (GP) was mixed with 5%
by vol. MEKP accelerator and 10% by vol. cobalt naphthenate catalyst. The fibre material was then placed in the mould and the resin mixture was poured evenly on it. After which the mould was closed and the excess resin allowed to flow out as a 'flash' by pressing, the pressure was held constant during the curing process at room temperature for 24 hours.
The composite sheet will then be post-cured at 80°C for 4 hours. Test specimens according to ASTM standards were cut out from the sheet.
2.5 Mechanical property measurements: The standard mechanical properties were determined by the procedures found in ASTM (American Society for Testing and Materials) standards for plastics. The mechanical property tested for in this work is ultimate tensile strength and impact strength.
2.5.1 Tensile properties
The tensile properties were tested at the Civil Engineering Laboratory, University of Nigeria, Nsukka (UNN), using a Hounsfield Monsanto Universal Tensometer Machine.
The Hounsfield Tensometer is a universal testing machine capable of testing metals,
200
plastics, textiles, timber, composites, fibres, papers etc. Provisions are made for such tests as tensile, compression, flexural or bending, shear, hardness etc. an important feature of the equipment/machine is the ease with which an auto-graphic record can be made. It contains a spring beam with ranges that are readily interchangeable and used in conjunction with special attachments. This enables tests to be performed on a wide variety of materials. Like most testing machines, the load is applied at one end and the magnitude of the load is measured at the other. The test piece, held in suitable chucks fixed to the spherically seated nosepieces by the chucks attachment pins, is loaded either by hand or employing a motor-driven unit through a warm gearbox. This causes the operating screw to move to the right and so transmits pull to the test piece. The other end of the test piece is connected via the tension head and bridge to the centre of a precisely ground spring beam. The deflection of this spring-beam, which is supported on rollers, is transmitted through a simple lever system to a mercury piston which displaces mercury in a uniform bore glass tube, thus magnifying the beam deflection and providing an easily read scale of load. The advance of the mercury column is followed manually by the cursor and its attached needle which is used to puncture the graph sheet at frequent intervals; thus recording force. The movement of the worm gear which causes the test piece to elongate is transmitted through a gear train to the recording drum, the rotation of which is proportional to the elongation of the test piece. The resultant graph produced by joining successive punctures shows the load against the cross-head movement which is virtually a true stress/strain diagram from which the modulus of elasticity and tensile strength of the material could be determined. The force will then be recorded and the area of the cross-section's test piece, the mechanical properties are determined such as tensile strength, ultimate elongation and modulus of elasticity.
2.5.2 Impact test
The impact properties such as impact strength and impact energy of the composite sheet were tested in the civil engineering laboratory, university of Nigeria Nsukka (UNN), using a notch impact-testing machine. Force was applied to the composite sheet until it
201
fractured, and the impact strength was recorded. The impact strength of composite material is the fracture energy of the material.
3 Results and Discussions
Cross-sectional area of composite =60.8mm2 Average diameter of fibre = 0.41mm
Table 3.1. Mechanical Properties of OPEFBF Composites at Varying Volume Fractions and Aspect Ratios Using Shape-Preserving-Linear-Interpolant Type of Fitting to Obtain the Youngs’ Modulus and Toughness.
S/N Fibre volume fraction (%)
Fibre aspect ratio
Ultimate tensile strength (N/mm2)
Ultimate elongation (mm)
Youngs’
modulus (N)
Toughness (N/mm2)
1 10 24.39 7.40 0.0086 362.52 0.032
2 10 73.17 8.31 0.011 514.00 0.048
3 10 121.95 6.58 0.012 133.00 0.047
4 30 24.39 10.77 0.0013 1198.60 0.074
5 30 73.17 13.98 0.022 738.026 0.170
6 30 121.95 6.17 0.020 908.05 0.100
7 50 24.39 4.77 0.013 805.44 0.044
8 50 73.17 4.95 0.013 1028.00 0.040
9 50 121.95 4.11 0.017 370.68 0.048
202 3.1.1 Tensile Test Results
Table 3.2 Analysis of Variance Result for Ultimate Tensile Strength Source Sum sq. d.f. Mean square F Prob>F
X1 48.66 2 24.33 6.67 0.053
X2 18.13 2 9.06 2.48 0.19
Error 14.60 4 3.65
Total 81.38 8
From Table 3.2, the ANOVA results of tensile strength, it is seen that the prob>F value for fibre volume fraction (X1) of 0.0532 falls within the acceptable range (≤ 0.05), thus the fibre volume fraction is a significant factor at 95% confidence bound. In comparison with the aspect ratio, fibre volume fraction has a more significant effect on the ultimate tensile strength of the composites. Figure 3.1 reveals that there is an increase in the ultimate tensile strength up to an optimum after which there was a corresponding decrease. Circular contour lines from the plot imply that factors significantly affect the property tested and that the optimum so obtained is a global optimum so improvement may not be possible. The coefficient of determination (R2) obtained was 0.8207, implying 82% variability of ultimate tensile strength as shown in Table 3.3.
The ultimate tensile strength of the polyester laminate is 48N/mm2 so from the results it can be seen that the addition of fibres to the resin reduced the tensile properties.
However, the young’s modulus which is about 400-1000N/mm2 increased to 1500N/mm2 after the addition of fibres, which implies that added fibres to the polyester resin increased the young’s modulus and reduced the tensile strength.
203
Figure 3.1. 3D plot of tensile strength versus fibre aspect ratio versus fibre volume fraction
Table 3.3. Numerical Results for Model Fit to Experimental Data for Tensile Strength Variable Coefficient Standard
Error
T Stat P-Val F Stat
Constant 0.42 3.50 0.12 0.91 Sse=14.594
X1 0.57 0.21 2.77 0.050 Dfe=4
X2 0.13 0.084 1.53 0.20 Dfr=4
X12 -0.011 0.0034 -3.17 0.034 F=4.576
X22 -0.0010 0.00057 -1.81 0.14 P-val=0.084953
R2=0.8207 AdjR2=0.6413
y=0.42381+0.5725*x1+0.12962*x2-0.010716*x1^2-0.0010277*x2^2
Where y is the ultimate tensile strength, x1is the fibre volume fraction and x2 is the fibre aspect ratio.
10
20
30
40
50
0 50
100 150
2 4 6 8 10 12 14
fibre volume fraction (%) X: 26
Y: 64 Z: 12.15
fibre aspect ratio (m/m)
tensile strength (MPa)
204
The optimum tensile strength of 12.15 N/mm2 occurred at a fibre volume fraction of 26%
and fibre aspect ratio of 64m/m as can be seen from the surface plot.
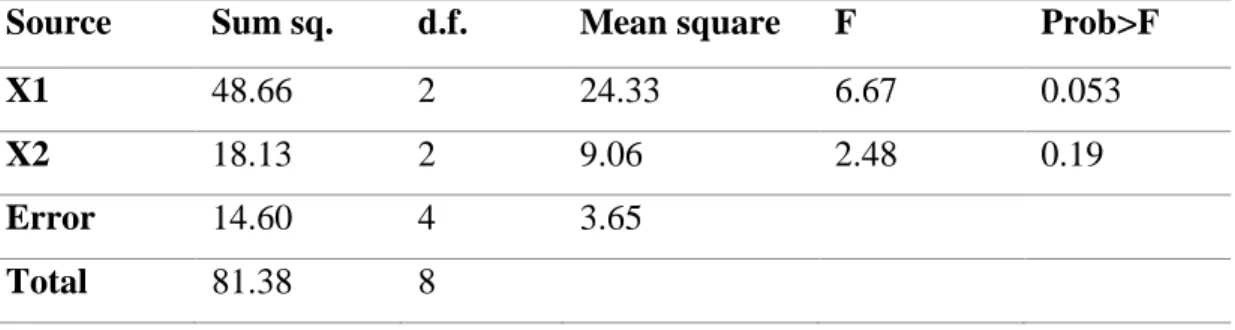
3.1.2 Ultimate Elongation
Table 3.4 Analysis of Variance Result for Ultimate Elongation Source Sum sq. d.f. Mean square F Prob>F X1 0.000030 2 1.50044e-005 0.41 0.6886
X2 0.00013 2 6.59244e-005 1.8 0.2767
Error 0.00015 4 3.65828e-005 Total 0.00031 8
Figure 3.2 3D plot of ultimate elongation vs. fibre aspect ratio and volume fraction
From Table 3.4 ANOVA results for ultimate elongation, it can be seen that the prob>F values for both fibre volume fraction and fibre aspect ratio were greater than 0.1 (90% confidence) suggesting that both factors do not affect significantly the ultimate elongation. In fig 3.2, the contour lines which are parallel indicate that factors do not have a good interaction between them. The P values from t-stats and f-stats in table 3.5 indicate
10 20
30 40
50
0 50 100 150 0.005 0.01 0.015 0.02
fibre volume fraction (%) X: 50
Y: 124 Z: 0.01939
fibre aspect ratio (%)
ultimate elongation (mm)
0.008 0.01 0.012 0.014 0.016 0.018
205
the same as they didn’t fall within the acceptable range of 0.1-0.01(90%-99%) confidence bounds.
Table 3.5. Numerical Results for Model Fit to Experimental Data for Ultimate Elongation Variable Coefficient Standard
Error
T Stat P-Val F Stat
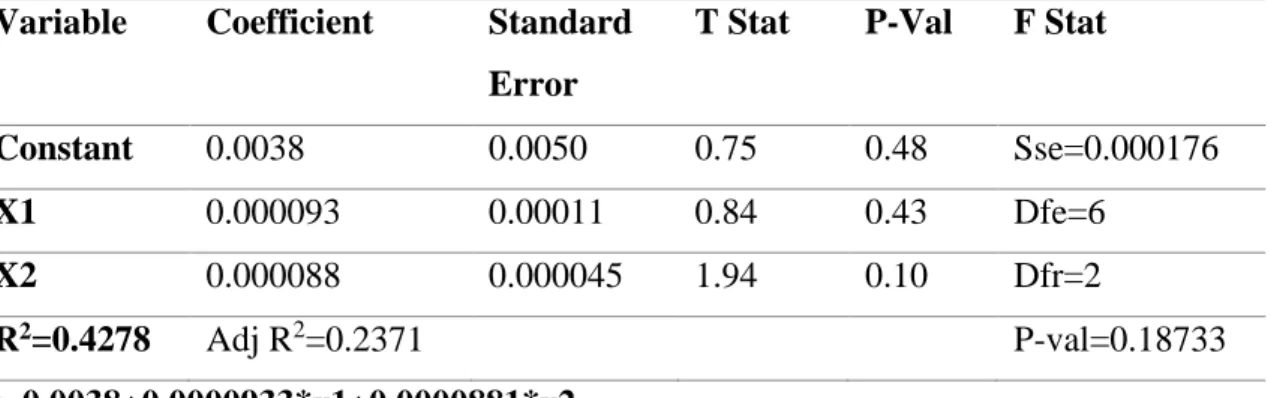
Constant 0.0038 0.0050 0.75 0.48 Sse=0.000176
X1 0.000093 0.00011 0.84 0.43 Dfe=6
X2 0.000088 0.000045 1.94 0.10 Dfr=2
R2=0.4278 Adj R2=0.2371 P-val=0.18733
y=0.0038+0.0000933*x1+0.0000881*x2
x1 is fibre volume fraction; x2 is fibre aspect ratio, and y is ultimate elongation
The optimum ultimate elongation occurred at 0.01939 at a fibre volume fraction of 50, and fibre aspect ratio of 124 as can be seen from the surface plot.
3.1.3 Young’s Modulus Results
Table 4.6 Analysis of Variance Result for Young’s Modulus Source Sum sq. d.f. Mean sq. F Prob>F
X1 578352.9 2 289176.5 5.26 0.0758
X2 185903 2 92951.5 1.69 0.2934
Error 219717.9 4 54929.5 Total 983973.8 8
206
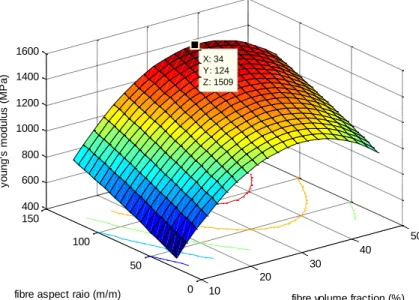
Figure 3.3. 3D-plot of Young modulus versus fibre aspect ratio versus fibre volume fraction.
Table 3.6 indicated that the fibre volume fraction played a more significant role in affecting Young’s modulus of elasticity than fibre aspect ratio based on their prob>F values. From table 3.7 the P-value for t-stats for volume fraction is less than 0.05 which indicates as well how significant a role fibre volume fraction played in the values of Young’s modulus of OPF composites. Fig 3.3, indicated that from the contour lines, there was a good interaction between the factors. R2 of 0.7767 obtained implied a 78%
variability of Young’s modulus.
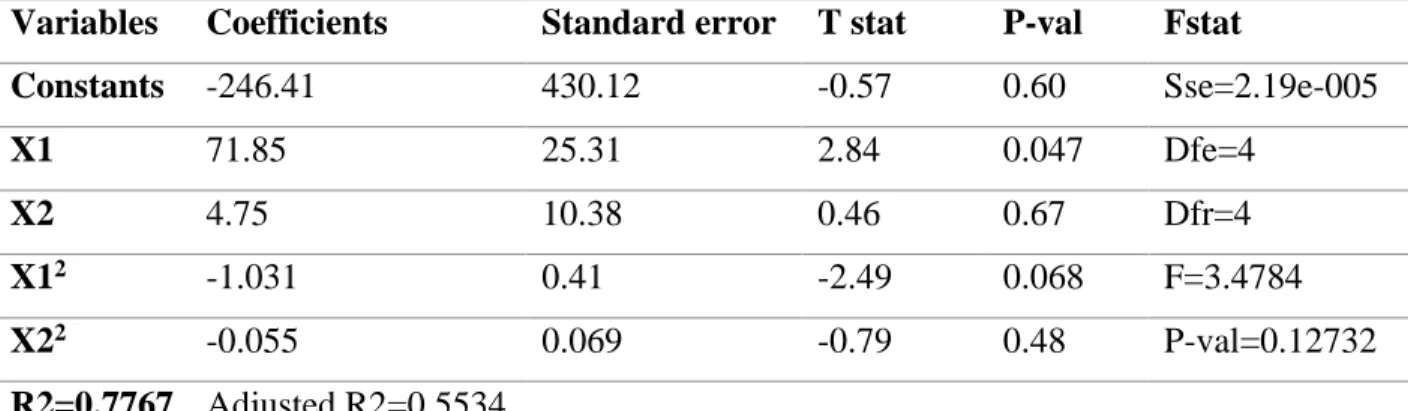
Table 3.7. Numerical Results for Model Fit to Experimental Data for Young’s Modulus Variables Coefficients Standard error T stat P-val Fstat
Constants -246.41 430.12 -0.57 0.60 Sse=2.19e-005
X1 71.85 25.31 2.84 0.047 Dfe=4
X2 4.75 10.38 0.46 0.67 Dfr=4
X12 -1.031 0.41 -2.49 0.068 F=3.4784
X22 -0.055 0.069 -0.79 0.48 P-val=0.12732
R2=0.7767 Adjusted R2=0.5534
y=-246.41+71.848*x1+4.7508*x2-1.0315*x1^2-0.0054756*x2^2;
10
20 30
40
50
0 50
100 150
400 600 800 1000 1200 1400 1600
fibre volume fraction (%) X: 34
Y: 124 Z: 1509
fibre aspect raio (m/m)
young's modulus (MPa)
207
x1is fibre volume fraction; x2 is the fibre aspect ratio, and y is the young’s modulus Optimum occurred at a fibre volume fraction of 34 and a fibre aspect ratio of 124.
Optimum Young’s modulus is obtained as1509N/mm2 =1500N/mm2
3.1.4 Toughness
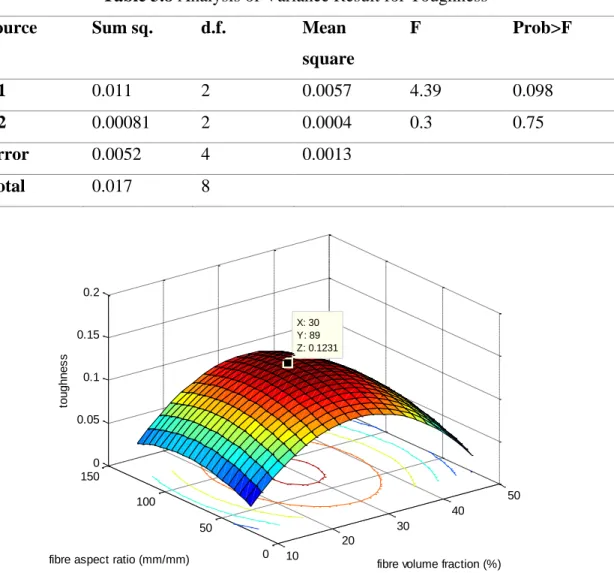
Table 3.8 Analysis of Variance Result for Toughness
Source Sum sq. d.f. Mean
square
F Prob>F
X1 0.011 2 0.0057 4.39 0.098
X2 0.00081 2 0.0004 0.3 0.75
Error 0.0052 4 0.0013
Total 0.017 8
Figure 3.4 3D-plot of toughness versus fibre aspect ratio versus fibre volume fraction
Tables 3.8 and 3.9 showed that the aspect ratio played a more significant role in the toughness of the composites based on their P-value from t-stats and the ANOVA table.
Fig 3.4 revealed a quadratic increase in the toughness until optimum was obtained after
10
20
30
40
50
0 50
100 150
0 0.05 0.1 0.15 0.2
fibre volume fraction (%) X: 30
Y: 89 Z: 0.1231
fibre aspect ratio (mm/mm)
toughness
208
which there was a corresponding decrease. The circular contour lines in the plot indicated a good interaction between factors. In addition, the circular contour line indicated a global optimum so an improvement on the optimum may not be possible. R2 value of 0.7015 obtained indicated 70% variability in the toughness of the composites.
Table 3.9. Numerical Results for Model Fit to Experimental Data for Toughness Variables Coefficients Standard
error
T stat P-value Fstat
Constants -0.085 0.066 -1.28 0.27 Sse=0.0052198
X1 0.011 0.0039 2.83 0.048 Dfe=4
X2 0.0011 0.0016 0.70 0.52 Dfr=4
X12 -0.00018 -0.000064 -2.94 0.042 F=2.3501
X22 -0.0000067 0.000011 -0.62 0.57 P-val=0.21412
R2=0.7015 AdjR2=0.4030
y=-0.085091+0.011027*x1+0.0011183*x2-0.00018798*x1^2-0.0000066892*x2^2 x1is fibre volume fraction; x2 is fibre aspect ratio.
Optimum occurred at a fibre volume fraction of 30 and a fibre aspect ratio of 89.
Optimum toughness is obtained as 123.1N/mm2.
For the rational type of fitting, Tables 3.11 and 3.12 indicated in correspondence to the values obtained above that the fibre volume fraction played a more significant role than the aspect ratio. However, in comparison, the optimum obtained here is higher than that obtained previously, which indicates a better model fit with rational (linear-quadratic fitting).
Moreso, from tables 3.13 and 3.14, fibre volume fraction had a more significant effect on Young’s modulus of elasticity based on their respective values from ANOVA and t-stats and f-stats. An R2 value of 0.9247 was obtained showing a better fit when compared to that obtained from a linear fit.
209
Table 3.10 Mechanical Properties of OPEFBF Composites at Varying Volume Fractions and Aspect Ratios using Rational Type of Fitting to Obtain the Youngs’ Modulus and Toughness.
S/N Fibre volume fraction (%)
Fibre aspect ratio
Ultimate tensile strength (N/mm2)
Ultimate elongation (mm)
Youngs’
modulus (N)
Toughness (N/mm2)
1 10 24.39 7.40 0.0086 523.012 0.032
2 10 73.17 8.31 0.011 616.43 0.048
3 10 121.95 6.58 0.012 884.19 0.048
4 30 24.39 10.77 0.0013 831.36 0.072
5 30 73.17 13.98 0.022 800.35 0.17
6 30 121.95 6.17 0.020 958.075 0.16
7 50 24.39 4.77 0.013 879.98 0.043
8 50 73.17 4.95 0.013 935.54 0.040
9 50 121.95 4.11 0.020 837.20 0.063
For the impact test, tables 3.15 and 3.16 showed that both fibre aspect ratio and fibre volume fraction played a very important role as their P-value are less than 0.05 (95%
confidence bounds). Fig 3.7 showed a quadratic increase in impact energy up to optimum after which there was a corresponding decrease. The circular contour lines indicated a good interaction between the factors and a global optimum-improvement may not be possible. An R2 value of 0.9373 was obtained which implied a good model fit and a 94%
variability of the impact energy.
Also, from tables 3.17 and 3.18, the P-value indicated that both fibre volume fraction and fibre aspect ratios significantly affect the impact strength of the composites.
The 3-D plot of fig 3.8 showed oval contour lines indicating a good interaction between the factors and a global optimum i.e there may not be a possible improvement on it. An R2 value of 0.9117 obtained implies a good model fit and a 91% variability of impact strength.
210 3.1.5 Toughness
Table 3.11 Analysis of Variance Result for Toughness
Source Sum sq. d.f. Mean square F Prob>F
X1 0.018 2 0.0091 7.13 0.048
X2 0.0028 2 0.0014 1.1 0.415
Error 0.0051 4 0.0013
Total 0.026 8
Figure 3.5 3D-plot of toughness versus fibre aspect ratio versus fibre volume fraction for rational model
Table 3.12. Numerical Results for Model Fit to Experimental Data for Toughness Variables Coefficients Standard
error
T stat P-value Fstat
Constants -0.11 0.066 -1.69 0.17 Sse=0.0052146
X1 0.014 0.0039 3.67 0.021 Dfe=4
X2 0.00058 0.0016 0.36 0.73 Dfr=4
X12 -0.00024 -0.000063 -3.77 0.020 F=4.1167
X22 -0.00000091 0.000011 -0.086 0.94 P-val=0.099658 R2=0.8046 AdjR2=0.61
10
20 30
40
50
0 50
100 150
0 0.05 0.1 0.15 0.2
fibre volume fraction (%) X: 30
Y: 124 Z: 0.1574
fibre aspect ratio(mm/mm)
toughness (MPa)
211
y=-0.11124+0.014174*x1+0.00057795*x2-0.000238*x1^2-0.000000911*x2^2 x1 is fibre volume fraction; x2 is the fibre aspect ratio, and y is the toughness Optimum occurred at a fibre volume fraction of 30 and a fibre aspect ratio of 124.
Optimum toughness is obtained as 157.4N/mm2
3.1.6 Young’s Modulus Results
Table 3.13 Analysis of Variance Result for Young’s Modulus
Source Sum sq. d.f. Mean sq. F Prob>F
X1 80333.5 2 40166.8 3.02 0.1585
X2 35795.6 2 17897.8 1.35 0.357
Error 53137.4 4 13282.4
Total 169266.6 8
Figure 3.6 3D-plot of Young modulus versus fibre aspect ratio versus fibre volume fraction for rational model
10
20
30
40
50
0 50
100 150
500 1000 1500
fibre volume fraction (%) X: 30
Y: 124 Z: 1465
fibre aspect ratio (mm/mm)
young's modulus (MPa)
212
Table 3.14. Numerical Results for Model Fit to Experimental Data for Young’s Modulus Variables Coefficients Standard
error
T stat P-value Fstat
Constants 235.38 140.30 1.68 0.19 Sse=12745
X1 25.33 7.45 3.40 0.042 Dfe=3
X2 2.45 3.10 0.80 0.480 Dfr=5
X1X2 -0.10 0.033 -3.08 0.054 F=7.3688
X12 -0.21 0.12 -1.81 0.17 Pval=0.065459
X22 0.015 0.019 0.76 0.50
R2=0.9247 AdjR2=0.7992
y=235.3800+25.3260*x1+2.4531*x2-0.1030*x1*x2-0.2088*x1^2+0.04791*x2^2 where y is young’s modulus, and x1 is fibre volume fraction; x2 is the fibre aspect ratio.
Optimum occurred at a fibre volume fraction of 30 and a fibre aspect ratio of 124.
Optimum Young’s modulus is obtained as 146.5N/mm2
3.1.7 Impact Energy Test
Table 3.15 Analysis of Variance Results for Impact Energy
Source Sum sq. d.f. Mean sq. F Prob>F
X1 9.07 2 4.53 19.98 0.0083
X2 4.50 2 2.25 9.92 0.0282
Error 0.91 4 0.23
Total 14.47 8
213
Figure 3.7 3D-plot of Impact energy versus fibre aspect ratio and fibre volume fraction
Table 3.16: Numerical Results for Model Fit to Experimental Data for Impact Energy
Variables Coefficients Standard error
T stat P-value Fstat
Constants -0.78 0.87 -0.90 0.42 Sse=
0.90738
X1 0.27 0.051 5.28 0.0062 Dfe=4
X2 0.081 0.021 3.86 0.018 Dfr=4
X12 -0.0049 0.00084 -5.84 0.0043 F= 14.9486
X22 -0.00059 0.00014 -4.21 0.014 P-val=
0.0113 R2= 0.9373 AdjR2=0.8746
y=-0.7827+0.2718*x1+0.0814*x2-0.0049*x1^2-0.0005960*x2^2
where y is the impact energy, and x1 is fibre volume fraction; x2 is the fibre aspect ratio.
10 20
30 40
50
0 50 100 150
1 2 3 4 5 6
fibre volume fraction (%) X: 28
Y: 69 Z: 5.765
fibre aspect ratio (mm/mm)
impact energy (ft/lbs)
1.5 2 2.5 3 3.5 4 4.5 5 5.5
214
The optimum 307.72J/m (5.77ft-lbs/in) occurred at a fibre volume fraction of 28, and an aspect ratio of 69 as can be seen from the surface plot.
3.1.8 Impact Strength Test Results
Table 3.17 Analysis of Variance Result for Impact Strength
Source Sum sq. d.f. Mean sq. F Prob>F
X1 0.23 2 0.12 15.13 0.0136
X2 0.084 2 0.042 5.53 0.0705
Error 0.030 4 0.0076
Total 0.35 8
Figure 3.8 3D-plot of Impact strength versus fibre aspect ratio versus fibre volume fraction
10 20
30 40
50
0 50
100 150
1 2 3 4 5
fibre volume fraction (%) X: 36
Y: 64 Z: 4.574
fibre aspect ratio (mm/mm)
impact strength(N/cm3)
2 2.5 3 3.5 4 4.5
215
Table 3.18. Numerical Results for Model Fit to Experimental Data for Impact Strength Variables Coefficients Standard
error
T stat P-value Fstat
Constants -0.20 0.16 -1.27 0.27 Sse=
0.0305
X1 0.049 0.0094 5.16 0.0067 Dfe=4
X2 0.012 0.0038 3.04 0.038 Dfr=4
X12 -0.00084 0.00015 -5.43 0.0056 F= 10.33
X22 -0.00084 0.000025 - 3.24 0.032 P-val=
0.0220 R2= 0.9117 AdjR2=0.8235
y=-0.2029+0.0487*x1+0.118*x2-0.0008375*x1^2-0.0008405*x2^2;
where y is the impact strength and x1is fibre volume fraction; x2 is the fibre aspect ratio.
The optimum 0.046N/mm2 occurred at a fibre volume fraction of 36, and a fibre aspect ratio of 64 as can be seen from the surface plot.
Mean energy absorption capacity is given as s 𝑈 = 𝐴𝑚𝑎𝑥2 × 𝐴0
𝐸𝑚𝑒𝑎𝑛 Where
Amax=maximum breaking stress of the sample A0 = original length of the sample = 160mm =0.16m Emean =Mean Young modulus of elasticity calculated
Emean = 362.52+514+133+1198.6+738.0256+908.05+805.44+1028+370.6796
9 = 673.15𝑁/𝑚𝑚2
= 673.15*106 N/m2
Mean energy absorption capacity is, therefore;
𝑈𝑚 =U1 + U2+ ⋯ + U9 9
Um = 0.2J
216
4 Conclusion
This project work is based on modelling the mechanical properties of OPR composites was done and the properties tested here include ultimate tensile strength, toughness, Young’s modulus, impact strength and impact energy. Based on the results, optimization was carried out and the optimum value for each property tested was determined.
From this work, it was found that the fibre volume fraction significantly affects the properties more than the aspect ratio. For ultimate tensile strength optimization that the optimum obtained was a global one at fibre volume fraction and aspect ratio of 26% and 64 respectively. The optimum ultimate tensile strength was 12.15N/mm2. For Young’s modulus, optimization revealed that at a fibre volume fraction of 34% and aspect ratio of 124, the optimum value for Young’s modulus was obtained to be 1509 N/mm2.
For toughness, the optimization carried out showed an optimum value of 0.1231 N/mm2 at a fibre volume fraction of 30% and an aspect ratio of 89. For the rational (linear- quadratic) type of fitting, the optimum obtained for toughness was 0.16 N/mm2 at a fibre volume fraction of 30% and aspect ratio of 124. Also, the optimum obtained here for Young’s modulus was found to be 1465 N/mm2 at a 30% volume fraction and an aspect ratio of 124. For impact strength, optimization indicated a global optimum at values of aspect ratio and fibre volume fraction of 69 and 28% respectively. An optimum value of impact strength of 307.72J/m (5.77ft/lbs) was obtained.
Acknowledgements
I want to specially acknowledge Engr. Dr Emmanuel C. Osoka for his relentless effort in guiding and supervising this work and ensuring I conduct resourceful research.
217
References
[1] R. M. Guedes and J. Xavier “Understanding and Predicting Stiffness in Advanced Fibre-Reinforced Polymer (FRP) Composites for Structural Applications”, In Advanced Fibre-Reinforced Polymer (FRP) Composites for Structural Applications (pp. 298-360). Woodhead Publishing. 2013.
[2] J. P. Jose, S. Thomas, J. Kuruvilla, S. K. Malhotra, K. Goda, M. S. Sreekala,
“Advances in Polymer Composites: Macro-and Microcomposites—State of The Art, New Challenges, and Opportunities”, Polymer composites, 1, 3-16. 2012.
[3] J. Kuruvilla, R. D. Toledo Filho, J. Beena, T. Sabu, and L. H. Carvalho, “A Review on Sisal Fiber Reinforced Polymer Composites”, Revista Brasileira de Engenharia Agrícola e Ambiental, 3(3), 367-379. 1999.
[4] X. Li, , L. G. Tabiland, S. Panigrahi, “Chemical Treatments of Natural Fibre for Use in Natural Fibre-Reinforced Composites: A Review, Journal of Polymers and the Environment”, 15(1), 25-33. 2007.
[5] S.M. Lee, D. Cho, W.H. Park, S.G. Lee, S.O. Han, and L.T. Drzal, “Novel Silk/Poly (Butylene Succinate) Biocomposites: The Effects of Short Fibre Content on their Mechanical and Thermal Properties”, Composites Science and Technology, 65, 647-657. 2005.
[6] H. Y. Cheung, M. P. Ho, K. T. Lau, F. Cardona, and D. Hui, “Natural Fibre- Reinforced Composites for Bioengineering and Environmental Engineering Applications”, Composites Part B: Engineering, 40(7), 655-663. 2009.
[7] E. C. Osoka and O. D. Onukwuli, The Optimum Condition for Mercerization of Oil Palm Empty Fruit Bunch Fibre, International Journal of Innovative Research in Computer Science and Technology, 3(4), 50-56. 2015.
[8] D. Jones, G. O. Ormondroyd, S. F. Curling, C. M. Popescu, and M. C. Popescu,
“Chemical Compositions of Natural Fibres. In Advanced High Strength Natural Fibre Composites in Construction”, (pp. 23-58), Woodhead Publishing, 2017.
[9] M. Y. Hashim, A. M. Amin, O. M. F. Marwah, M. H. Othman, M. R. M. Yunus, and N. C. Huat, “The Effect of Alkali Treatment Under Various Conditions On
218
Physical Properties of Kenaf Fibre”, In Journal of Physics: Conference Series 914(1), 012030. IOP Publishing, 2017.
[10] A. K. Mohanty, M. Misra, and L. T. Drzal, “Surface Modifications of Natural Fibres and Performance Of The Resulting Biocomposites: An Overview”, Composite interfaces, 8(5), 313-343. 2001
[11] A. Bismarck, A. K. Mohanty, I. Aranberri-Askargorta, S. Czapla, M. Misra, G.
Hinrichsen and J. Springer. “Surface Characterization of Natural Fibres; Surface Properties and The Water Up-Take Behavior of Modified Sisal and Coir Fibres”, Green chemistry, 3(2), 100-107. 2001
[12] L. A. Pothan, J. George, & S. Thomas, “Effect of Fibre Surface Treatments on the Fibre–Matrix Interaction in Banana Fibre Reinforced Polyester Composites”, Composite Interfaces, 9(4), 335-353. 2002.
[13] N. T. Phuong, C. Sollogoub and A. Guinault, “Relationship Between Fibre Chemical Treatment and Properties of Recycled Pp/Bamboo Fibre Composites”, Journal of Reinforced Plastics and Composites, 29(21), 3244- 3256. 2010
[14] T., Padmavathi, S. V. Naidu & R. M. V. G. K. Rao. “Studies On Mechanical Behavior of Surface Modified Sisal Fibre–Epoxy Composites”, Journal of Reinforced Plastics and Composites, 31(8), 519-532. 2012.
[15] Petinakis, E., Yu, L., Simon, G., & Dean, K. (2013). “Natural Fibre Bio- Composites Incorporating Poly (Lactic Acid)”, Fibre reinforced polymers-The technology applied for concrete repair, 41-59. 2013.
[16] O. Faruk, A. K. Bledzki, H. P. Fink & M. Sain, “Biocomposites Reinforced with Natural Fibres: 2000–2010”, Progress in polymer science, 37(11), 1552-1596.
2012.
[17] M. Y. Hashim, A. Zaidi, A. Mujahid, & S. Ariffin, “Plant Fiber Reinforced Polymer Matrix Composite: A Discussion On Composite Fabrication and Characterization Technique”. In Seminar to Faculty of Civil and Environmental Engineering (FKAAS), Universiti Tun Hussein Onn Malaysia (UTHM). 2012.
219
[18] C. M. Ewulonu and , I. O. Igwe. “Properties of Oil Palm Empty Fruit Bunch Fibre Filled High Density Polyethylene”. International journal of engineering and technology, 3(6), 2012.
[19] A., Athijayamani, M. Thiruchitrambalam, V. Manikandan and B. Pazhanivel,
“Mechanical Properties of Natural Fibers Reinforced Polyester Hybrid Composite”, International Journal of Plastics Technology, 14(1), 104-116. 2010.
[20] S. M. Sapuan, A. Leenie, M. Harimi, and Y. K. Beng, “Mechanical Properties of Woven Banana Fibre Reinforced Epoxy Composites”. Materials & design, 27(8), 689-693. 2006.
[21] F. K. A. Nugraha, “Shrinkage of Biocomposite Material Specimens [HA/Bioplastic/Serisin] Printed using a 3D Printer using the Taguchi Method”, International Journal of Applied Sciences and Smart Technologies, 4(1), 89-96. 2022.
220
This page intentionally left blank