INTRODUCTION
LITERATURE REVIEW
U.S. Census Bureau classifications
Urban is defined as “all land, population and housing units located within an urbanized area (UA) or urban cluster (UC).” UA and UC boundaries encompass densely populated territory consisting of core groups of census blocks or blocks that have a population density of at least 1,000 people per square mile, and surrounding census blocks that have a combined density of at least 500 people per square mile. 2) Metropolitan status codes.
Metropolitan status codes
Urban-rural continuum codes
These codes were first developed by the Office of the Budget, the predecessor of the Office of Management and Budget (Arnold et al., June 2007). The Office of Management and Budget defines a metro area as “…a central urban area with a population of 50,000 or more, and a micro area contains an urban core of at least 10,000 (but less than 50,000) residents” and “each metro or micro area consists of one or more counties and includes districts that contain a central urban area as well as any contiguous districts that have a high degree of social and economic integration (as measured by commuting) with the urban core” (Bureau et al These metropolitan status codes classify school districts into three categories: 1 ) the central city of the CBSA, 2) located in the CBSA but not in the central city, and 3) not in the CBSA (Arnold et al., June 2007, Miller, 2006a, 2006b). They were created specifically for more precise descriptions and analysis of rural-urban differences at the district level.
Nonmetropolitan counties are distinguished by the degree to which they are urbanized and whether they border a metropolitan area ("USDA ERS - Rural Classifications Arnold et al., June 2007). or more, adjacent to a metropolitan area, 2) Urban population of 20,000 or more, not adjacent to a metropolitan area, 3) Urban population adjacent to a metropolitan area, 4) Urban population not adjacent to a metropolitan area, 5) Entirely rural or less than 2,500 urban population, adjacent to the metropolitan area, and 6) Entirely rural or less than 2,500 urban population, not adjacent to metropolitan area ("USDA ERS - Rural. Metro-centric location codes were developed in the 1980s by the National Center for Education Statistics (NCES) to identify schools and the respective districts.
Metro-centric locale codes
Nonmetropolitan counties have six codes, which are: 1) urban population of 20,000 or more adjacent to a metropolitan area, 2) urban population of 20,000 or more not adjacent to a metropolitan area, 3) urban population adjacent to a metropolitan area , 4) Urban population not adjacent to a metropolitan area, 5) Totally rural or less than 2,500 urban population adjacent to a metropolitan area, and 6) Totally rural or less than 2,500 urban population not adjacent to a metropolitan area (" USDA ERS - Rural Any incorporated place, census-designated place, or territory that is not a place within a CBSA or CSA of a large or medium-sized city and is defined as rural by the Census Bureau (Arnold et al., June 2007; National Center for Education Statistics, 2006b).
Urban-centric locale codes
Area within an urban cluster that is more than 56 kilometers away from an urbanized area. 10) Rural, Fringe: Census-defined rural area that is less than or equal to 5 miles from an urban area, as well as an area that is less than or equal to 5 miles from an urban area. equal to 4 km from an urban cluster, 11) Rural, remote: rural area defined by the census that is more than 8 km away but less than or equal to 40 km from an urbanized area, as well as an area more than 4 km is removed but less than or equal to 16 km from an urban cluster, and 12) Rural, remote: Census-defined rural. These are statistically defined geographic areas as defined by the school district's NCES and CBSA.
Core-based statistical areas
During this time, the role and function of school psychologists in various community settings also developed. As previously mentioned, school psychologists have undergone many changes since the beginning of the profession. Second, it examined the factors that influence the percentage of time school psychologists spend outside of special education assessment.
Third, the factors influencing the number of roles in which school psychologists engage were explored. The fourth area that was investigated was the differences in the role and function of school psychologists within the village. The current project used a survey design to examine various factors related to the role and function of school psychologists in different community settings.
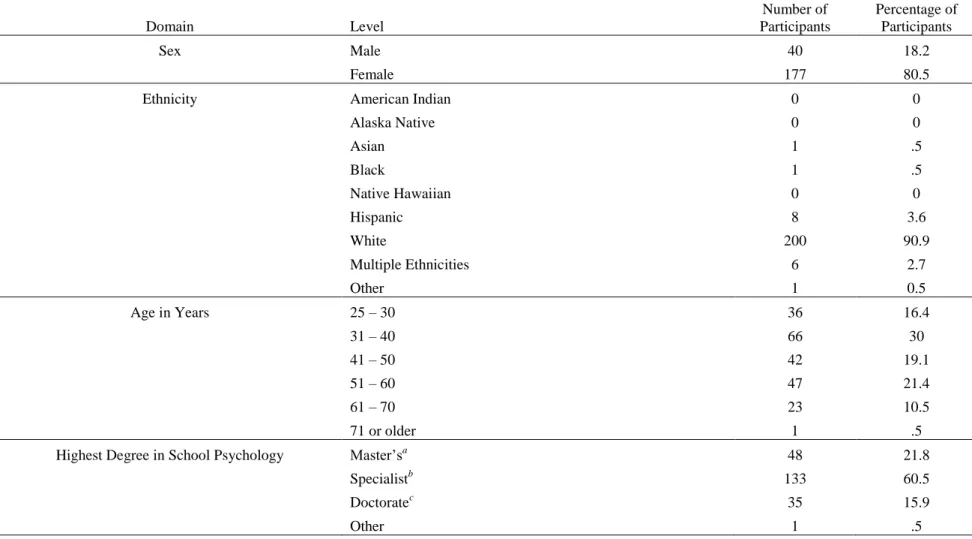
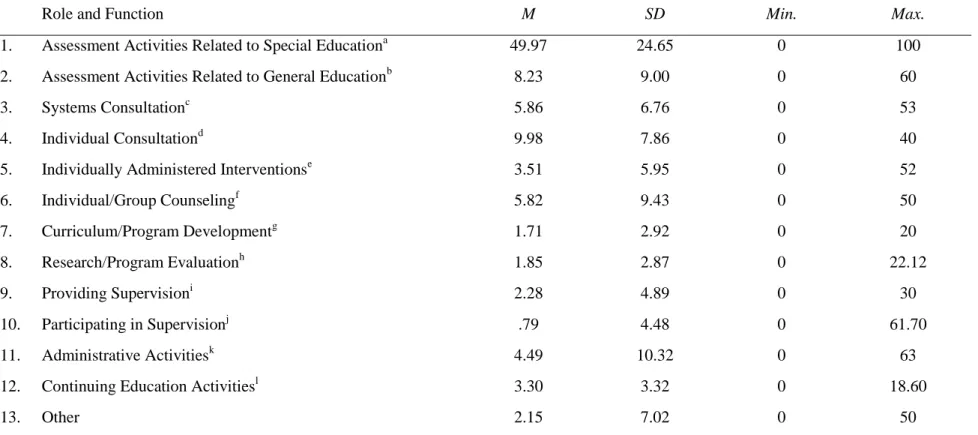
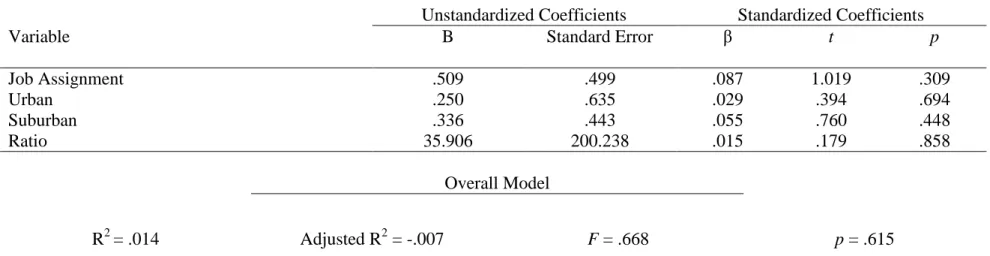
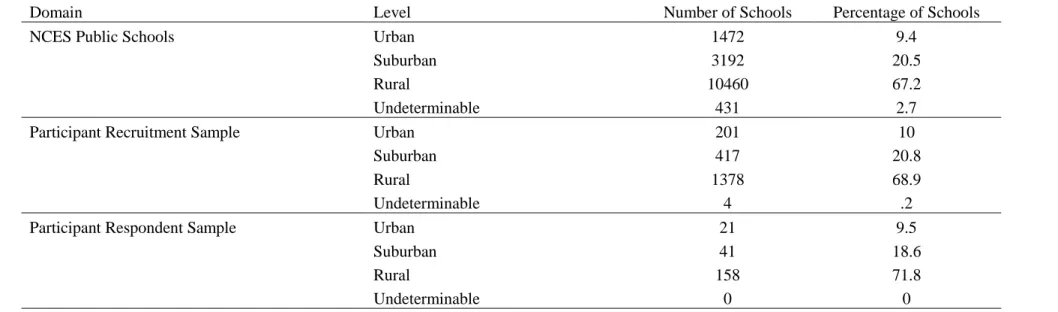
To get an idea of the number of school psychologists working nationwide, NASP membership statistics were used. School psychologists in all three zip code communities spent the majority of their time on assessment activities related to special education (49.97%) (see Table 6). The dependent variable, the number of roles played by the school psychologist, was regressed on the independent variables: the community setting in the zip code (i.e., rural, suburban, urban), the ratio of school psychologists to students, and the job assignment (i.e., internal or urban). . traveling).
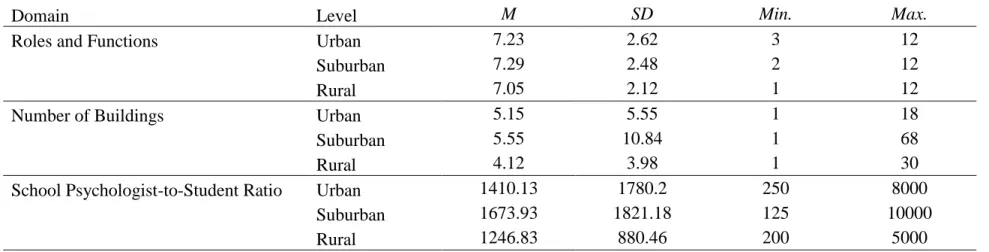
On average, the school psychologists in the sample involved seven separate roles (SD = 2.33, min. No significant result was found among the school psychologists in any of the three levels of community setting (see Table 16). 2) Factors influencing time use. beyond special education assessment. The first research question addressed diversity of roles in which school psychologists are involved and their job satisfaction based on their community setting.
This can ultimately better inform best practices for school psychologists regarding appropriate roles and functions based on the needs of the community environment in which they work. Finally, the third area of research relates to the optimal number of school psychologists for an individual system. Rather, what impact does community placement have on the students with whom school psychologists work?
A demographic profile of school psychology: A report to the delegate meeting of the National Association of School Psychologists.
METHOD
RESULTS
Community setting and effect on role diversification and job satisfaction
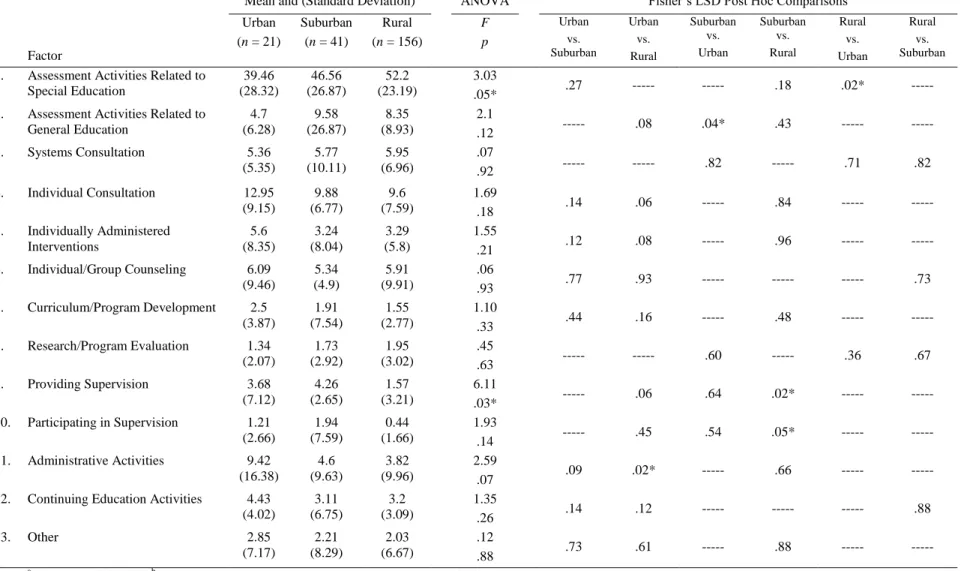
To compare the thirteen levels of RFM with the three levels of self-identified community attitude, ANOVA analyzes were used. School psychologists in all three self-identified community settings spent the majority of their time on assessment activities related to special education (49.64%), which was similar to the results from the primary analysis. This category was the highest endorsed role and function on the matrix for each postcode community setting.
The second largest endorsed category in terms of percentage of time spent in this role was individual consultation (10.11%), again similar to primary analysis. The third largest endorsed role and function category was assessment activities related to general education (8.06%), which was also similar to the primary analysis. In this second set of analyses, only one significant result was obtained, unlike the primary analyses, which produced two significant results.
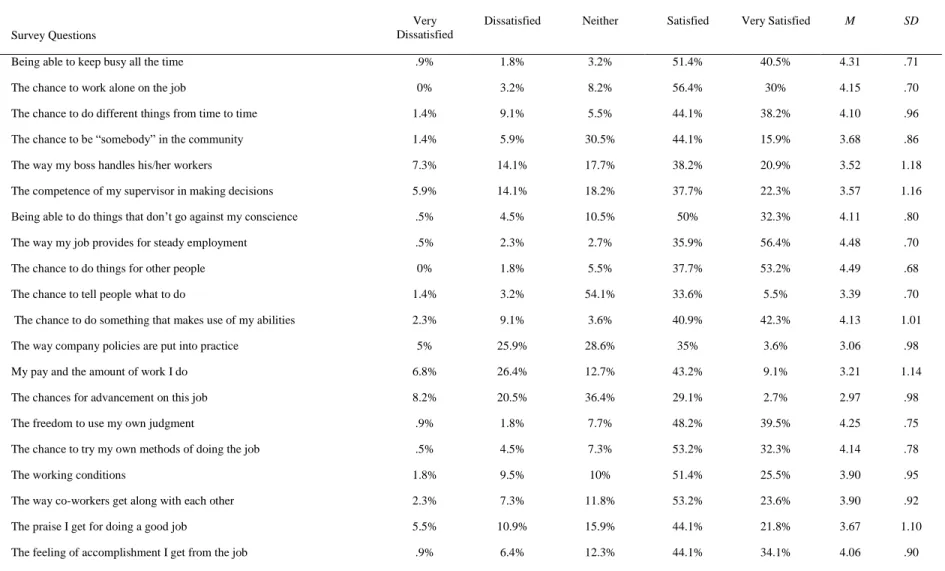
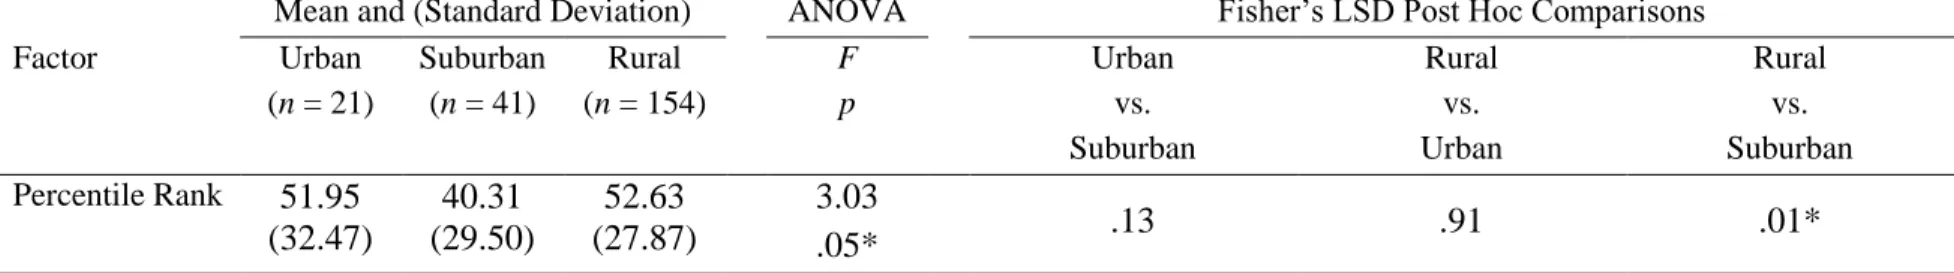
The level of job satisfaction based on the school psychologist's self-identified community setting was also analyzed. This was compared to the percentile rank calculated for each participant based on the MSQ – SF. No significant result was found among the school psychologists at any of the three levels of the community setting (see Table 16).
Factors influencing time spent outside of special education assessment
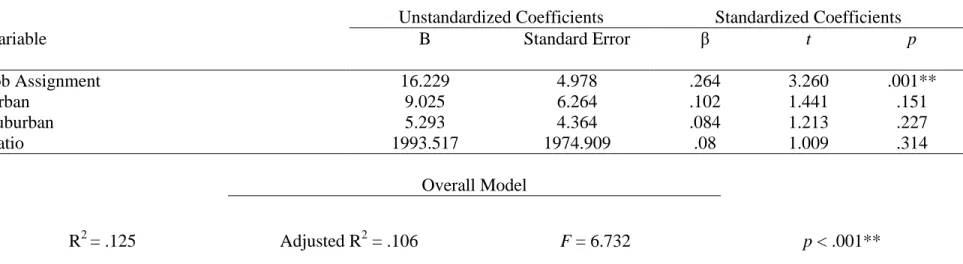
Among school psychologists, no significant results were found at any of the three levels of community environment (see Table 16). p = 0.04, β = 0.14). These results again indicate that a school psychologist considered in-house is more likely to engage in a higher percentage of activities unrelated to special education assessment (14.7%, R2 = 0.147). Additionally, these results also indicated that school psychologists who identified as working in suburban schools were more likely to participate in a higher percentage of roles unrelated to special education assessment.
Factors influencing the number of roles in which school psychologists engage
Variation in role and function of school psychologists within rural settings
Factors related to school psychologist’s job satisfaction
Finally, the fifth research question explored school psychologists' job satisfaction in relation to their community environment and the factors that predict it. Role diversification has been described in the literature as one of the characteristics that distinguish school psychologists working in rural areas from all other community settings. A contributing factor may have been that school psychologists in rural settings spent a large percentage of their time traveling between school buildings or school districts.
It is difficult for school psychologists to address boundary violations when much of their time is spent assessing special education. The factors hypothesized to predict the percentage of time school psychologists spend outside of a special education assessment role were in the community, in-house, or in the school. This was also significantly less time than what school psychologists endorsed in the field's first NASP survey (Curtis et al., 1999) (70% of their time spent on assessment activities related to special education).
The results of this study indicate that school psychologists do often involve other roles and functions, such as. Regardless of the community setting, a school psychologist is likely to engage in a similar number of roles and will spend a similar percentage of time in those roles and functions compared to school psychologists in other community settings. 1984) and others have attempted to establish school psychology practiced in a rural setting as a distinct specialty relative to school psychologists in other community settings.
Transparency measures were used to address all criticisms of previously completed community environmental research related to school psychologists and other fields. Community differences are important considerations for school psychologists as they enter the field and as they continue to practice. Demographics and professional practices of school psychologists: A comparison of NASP members and non-NASP schools.
DISCUSSION